
ABSTRACT
An important issue affecting operation of ground‐based observatories is the local environmental conditions, including dust in the atmosphere. Dust "events" can appear suddenly and without warning, and can be very detrimental to a telescope's optics. Due to these dust events, optics may be required to undergo cleaning and recoating which can cost the observatory a substantial amount of money, in addition to lost observing time. This research involves the statistical analysis of dust event data obtained from the Apache Point Observatory (APO) in Sunspot, New Mexico, which has similar weather conditions to our observatory, the Magdalena Ridge Observatory. The objective of this work is to determine whether there are any correlations between dust events and basic weather effects, such as levels or changes in pressure, humidity, wind speed, and wind direction, which could be used to predict the likelihood of such an event. We have identified one correlation between a drop in humidity and concurrent rise in temperature which precedes 76.23% of the measured dust events at APO during a 17 month period.
Export citation and abstract BibTeX RIS
1. INTRODUCTION
The goal of this project is to find a way to predict dust events before they occur in order to protect an observatory's optics. A dust event occurs when the particulate (aerosol) level in a particular size distribution in the air surrounding the observatory surpasses some defined level predetermined to require securing the optics from continued exposure to the outside air. Unfortunately, few analytical studies have been able to determine whether any precursors to dust events exist, which could be used to help predict and avoid these dust exposures. A study performed at the Italian Galileo telescope (TNG) found no correlation between dust content, humidity, and wind direction at the time of the event (Porceddu et al. 2002). Research performed at the VLT Observatory in Cerro Paranal found no relation between the wind direction and dust events. These scientists were able to conclude that the dust events were not from local phenomena (e.g., a mine located over 50 km away). They proposed that the notable increase in particle density during the warmer, humid months of the year was due to whirlwinds, a thermal phenomenon particular to desert areas (Giordano & Sarazin 1994).
We undertook a study of archival weather data from the Apache Point Observatory (APO) to look for possible correlations between documented dust events and other possible weather precursors. We chose APO because it has a vast amount of archival weather data available online, and because in previous research by Gorgievska & Steinebach (2004) it was concluded that the weather at APO is very similar to that at MRO due to the observatories' proximity to each other. This paper covers the analysis of 223 dust events during 17 months from the APO site where we looked for a phenomenon, or group of phenomena, preceding a dust event within about 1 day. In § 2 we discuss dust events, how they are monitored at APO, and how we analyzed the data. In § 3 we discuss the results of our analysis of APO's weather and dust data, trying to find a reliable precursor of the dust events. Here we also discuss various aspects of the dust events, including their seasonal variance and the time of day at which they typically occur. In the final section, we draw some preliminary conclusions and suggest future analyses which could be completed to augment this work.
2. DATA COLLECTION AND ANALYSIS
2.1. Weather Data Comparison at MRO and APO
Weather at the Magdalena Ridge Observatory (MRO) and the Apache Point Observatory (APO) is very comparable because of their similar altitudes, close proximity to each other, and location near desert/arid settings. MRO is located in the Magdalena Mountains at an elevation of 10,600 feet (3231 m) 30 miles west of the New Mexico Tech campus in Socorro, New Mexico, and overlooks the St. Augustine plains to the west, where the Very Large Array (VLA) is located. APO is located in the Sacramento Mountains at Sunspot, New Mexico, which is 18 miles south of Cloudcroft at an elevation of 9147 feet (2788 m). APO is northeast of the White Sands National Monument, while MRO is located east and northeast of two large deserts extending into Arizona and Mexico, the Sonoran and Chihuahuan. The weather data from APO has been shown to be almost identical to the data from MRO, except that some of the events are slightly staggered temporally because of the difference in longitude and latitude of the observatories (Gorgievska & Steinebach 2004). The prevailing wind direction at MRO is out of the southwest to west (Klinglesmith et al. 2004). The prevailing wind direction at APO is generally southwesterly, with some slight seasonal variance (D. Woods 2007, private communication).
2.2. Dust Events
Dust events are generally defined to occur when there is a readily observable amount of particulate matter in the surrounding air. Some observatories use a flashlight to determine how dusty it is outside and whether they should close down to protect the optics. Others use quantitative scientific devices such as particulate monitors to determine the amount of dust in the atmosphere. Based on criteria discussed below, the APO observatory has preliminarily reported that dust events in New Mexico are seasonal. They define three different seasons for their dust events during the period 1996 May–December (Varsik et al. 1997). The first one is in the spring, from May to June, the second is during New Mexico's monsoon season (July through September), and the final one is from October through December. Further, based on their studies of observatory logs from night observers examining the air with a flashlight, and correlation of these logs with dust monitor levels, Varsik et al. (1997) conclude that the majority of visible dust events (9 out of 12) correspond to dust count peaks at a size distribution greater than 1.0 μm. Some events (2 of 12), characterized by observers as "smoke," correspond to dust count peaks at the 0.3 μm size distribution (Varsik et al. 1997).
Dust particles are detrimental to operating observatories because they can damage the coating on an exposed optic in two ways. If the surface of the optic accumulates dust, moisture reacting with this dust can cause a chemical reaction which triggers the rapid erosion of the coating (Sawyer & Reddell 1997). Dust can also scratch the surface of a mirror during periods of high winds. One way to avoid such damage would be to mitigate dust settling on the observatory's exposed optics. Some observatories choose to clean optics regularly to mitigate damaging effects of dust exposure. It is worth mentioning that dust can also produce the nuisance effect of increasing scattered light in the atmosphere, resulting in a loss of photometric conditions, which does not affect the optics but may affect the data collected at the telescopes.
2.3. Dust Monitoring at APO
APO employs a particle counter to characterize dust in the atmosphere. They use the Met One model 227B available from Hach Ultra. It is mounted in a weather‐tight enclosure about 50 feet above the ground on the APO weather tower, which places the instrument in free air flow, away from the effects of most human activities at the site (Varsik et al. 1997). It operates by drawing air through a tube into the counter, where photodiodes measure the light transmitted by an infrared laser and scattered by the dust particles (Gorgievska & Steinebach 2004). The air pump draws 0.1 cubic feet of air per minute through the counter which is operated for 1 minute every 15 minutes throughout the day. Data are collected in two different channels which measure the number of dust particles ≥0.3 μm and those particles ≥1.0 μm. The data are downloaded via RS‐232 cable, analyzed with IDL, and then placed on the APO Web site for public viewing.
2.4. Data Analysis
We examined 223 dust events which occurred over approximately 17 months from 2004 September 1 to 2006 May 31. This comprised all of the recorded dust events which occurred during that time interval. There were four periods during which the dust monitor was inoperable in this time period, so there were not any data to analyze: 2004 August 22 to 2004 September 6, 2004 October 4 to 2004 October 11, 2004 December 28 to 2005 February 24, and 2005 August 30 to 2005 October 30. For purposes of this analysis, we used APO's shutdown criteria to define a dust event, which states that a dust event occurs when the levels of particles in the ≥1.0 μm channel exceed the value of 3000 counts per cubic foot. The channel which measures the smaller particles' sizes appears to be unused by APO for defining those dust events that would result in an observatory shutdown. Consequently, we looked for any weather trends that occurred prior to a dust event (in only the ≥1.0 μm channel) by hours or up to 2 days, and which could serve as a reliable predictor of a dust event. Our analysis included different combinations of weather phenomena, such as temperature and barometric pressure, dew point and wind speed, etc. We chose to examine combinations of weather phenomena because previous studies at this and other observatories (Gorgievska & Steinebach 2004; Giordano & Sarazin 1994; Porceddu et al. 2002) found no single correlatable weather phenomenon useful for predicting dust events. Hence, we examined the data looking for a set of two or more levels or changes in levels in meteorological measurable quantities which precede most dust events.
3. RESULTS
After examining these 223 dust events with other meteorological measures, we found there was one pair of measures which changed together in a similar fashion, occurring 76.23% of the time (170 events) before a dust event at an interval of 28.6 ± 6.7 hr. The weather phenomenon includes a drop in the relative humidity of on average 26.1% over a mean time period of 14.2 hr and a simultaneous mean temperature rise of 12.2°F (6.8°C) over the same time interval. At the end of this time period the relative humidity and temperature return to levels very close to their starting levels. We determined that the weather phenomenon began where the temperature starts to rise as the humidity falls. The two together then will reach a peak/dip at approximately the same time. An example of this, along with other meteorological measures taken over the same 72 hr period, is shown in Figure 1. The weather phenomenon is indicated on the humidity and temperature plots, as is the time when the dust counts in the 1.0 μm and larger channel exceeds the APO criteria for a dust event.
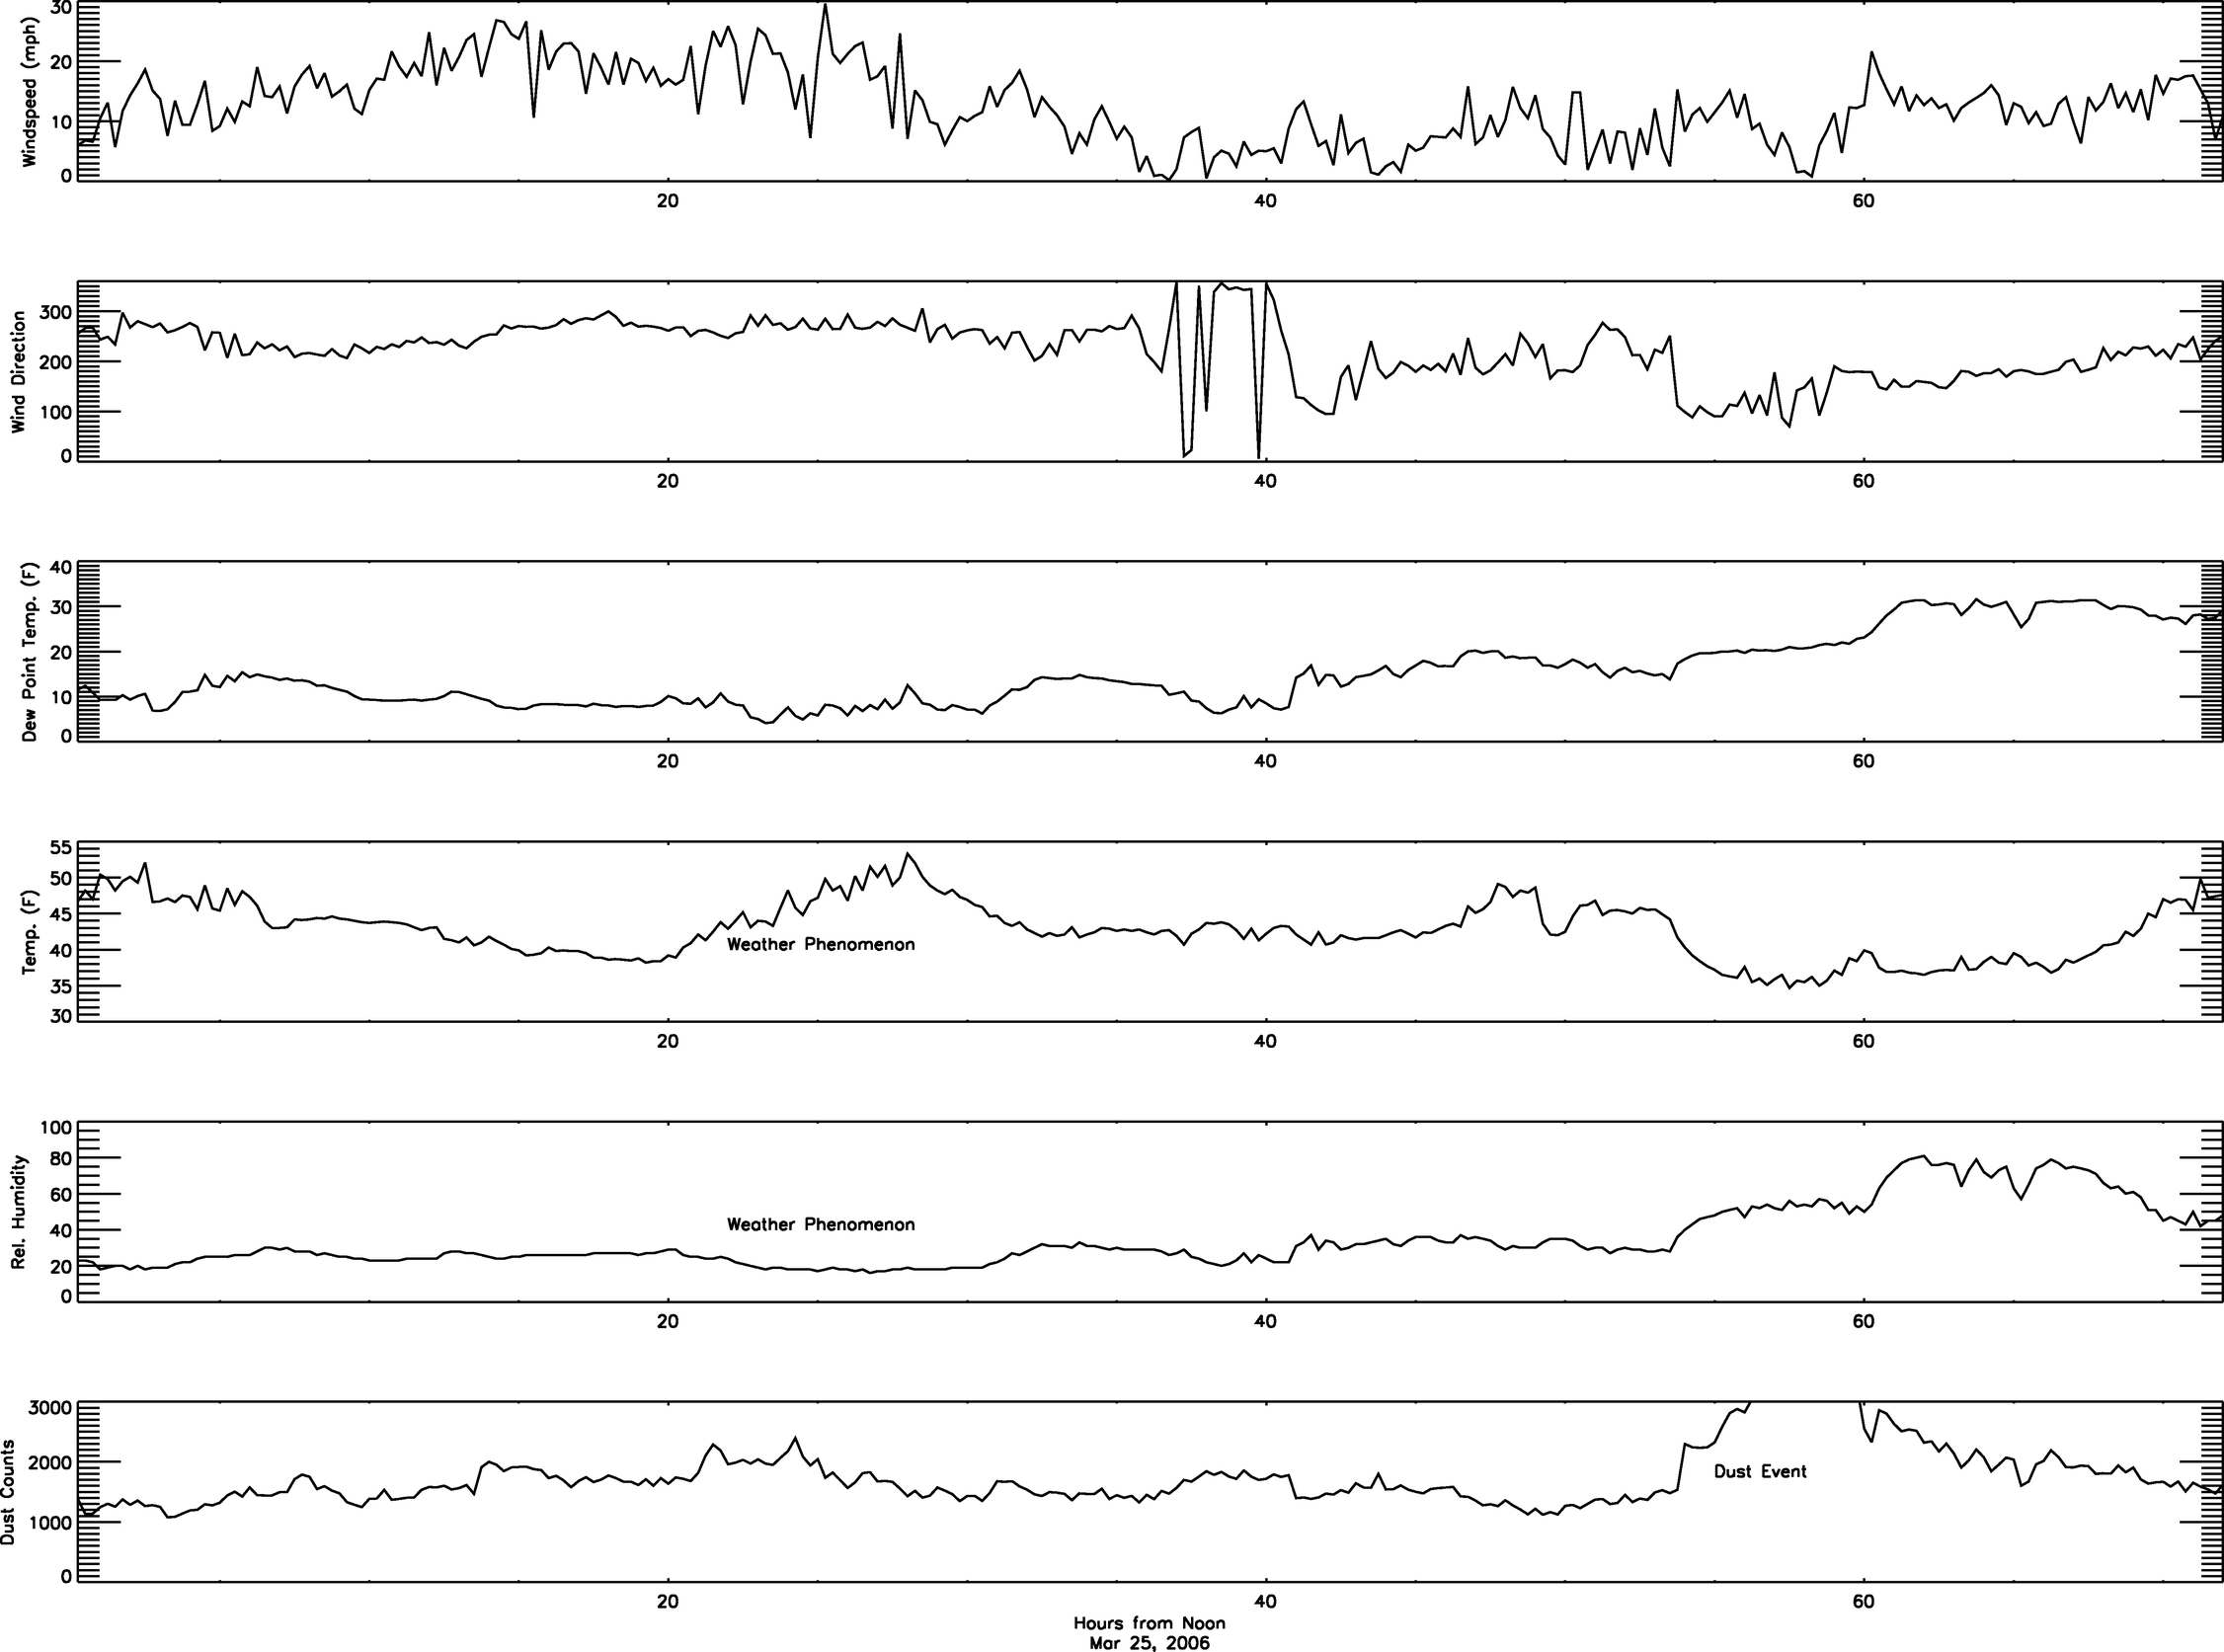
Fig. 1.— This plot shows several meteorological measures and a dust event for the 72 hr time period starting at noon on 2006 March 25. The weather phenomenon is indicated by a rise in temperature and fall in relative humidity during a 14 hr period which precedes a majority of the dust events (defined as particle counts greater than 3000 per cubic foot) by approximately 28 hr in our sample. No other single correlatable event could be found as a precursor of the dust events during a 48 hr period prior to the dust events. (See text for details.)
One of the assumptions we made in the data analysis was that an individual dust event occurs when the dust counts for particles larger than 1.0 μm exceeds 3000 particles per cubic foot. If the level of dust falls below 3000 particles per cubic foot for at least 1 hr (4 time samples for APO), and then rises back above 3000, it will be considered a separate dust event for purposes of this analysis. The time the weather phenomena began/ended is the average of the drop/rise of the temperature and humidity. The peak time of the weather phenomenon is measured to be the highest point in the temperature change.
In Figure 2 we show examples of eight events from among our 223, half of which exhibit the weather phenomena preceding the dust events (left plots), and half of which do not. The plots, which each cover 72 hr of time starting from noon on the date below the plot, are shown chronologically from top to bottom in both categories. One of the general characteristics of these plots which is immediately obvious is the difference in the relative humidity when the weather phenomenon is present versus when it is not. Other statistics about the distribution of events for the entire sample are discussed below.
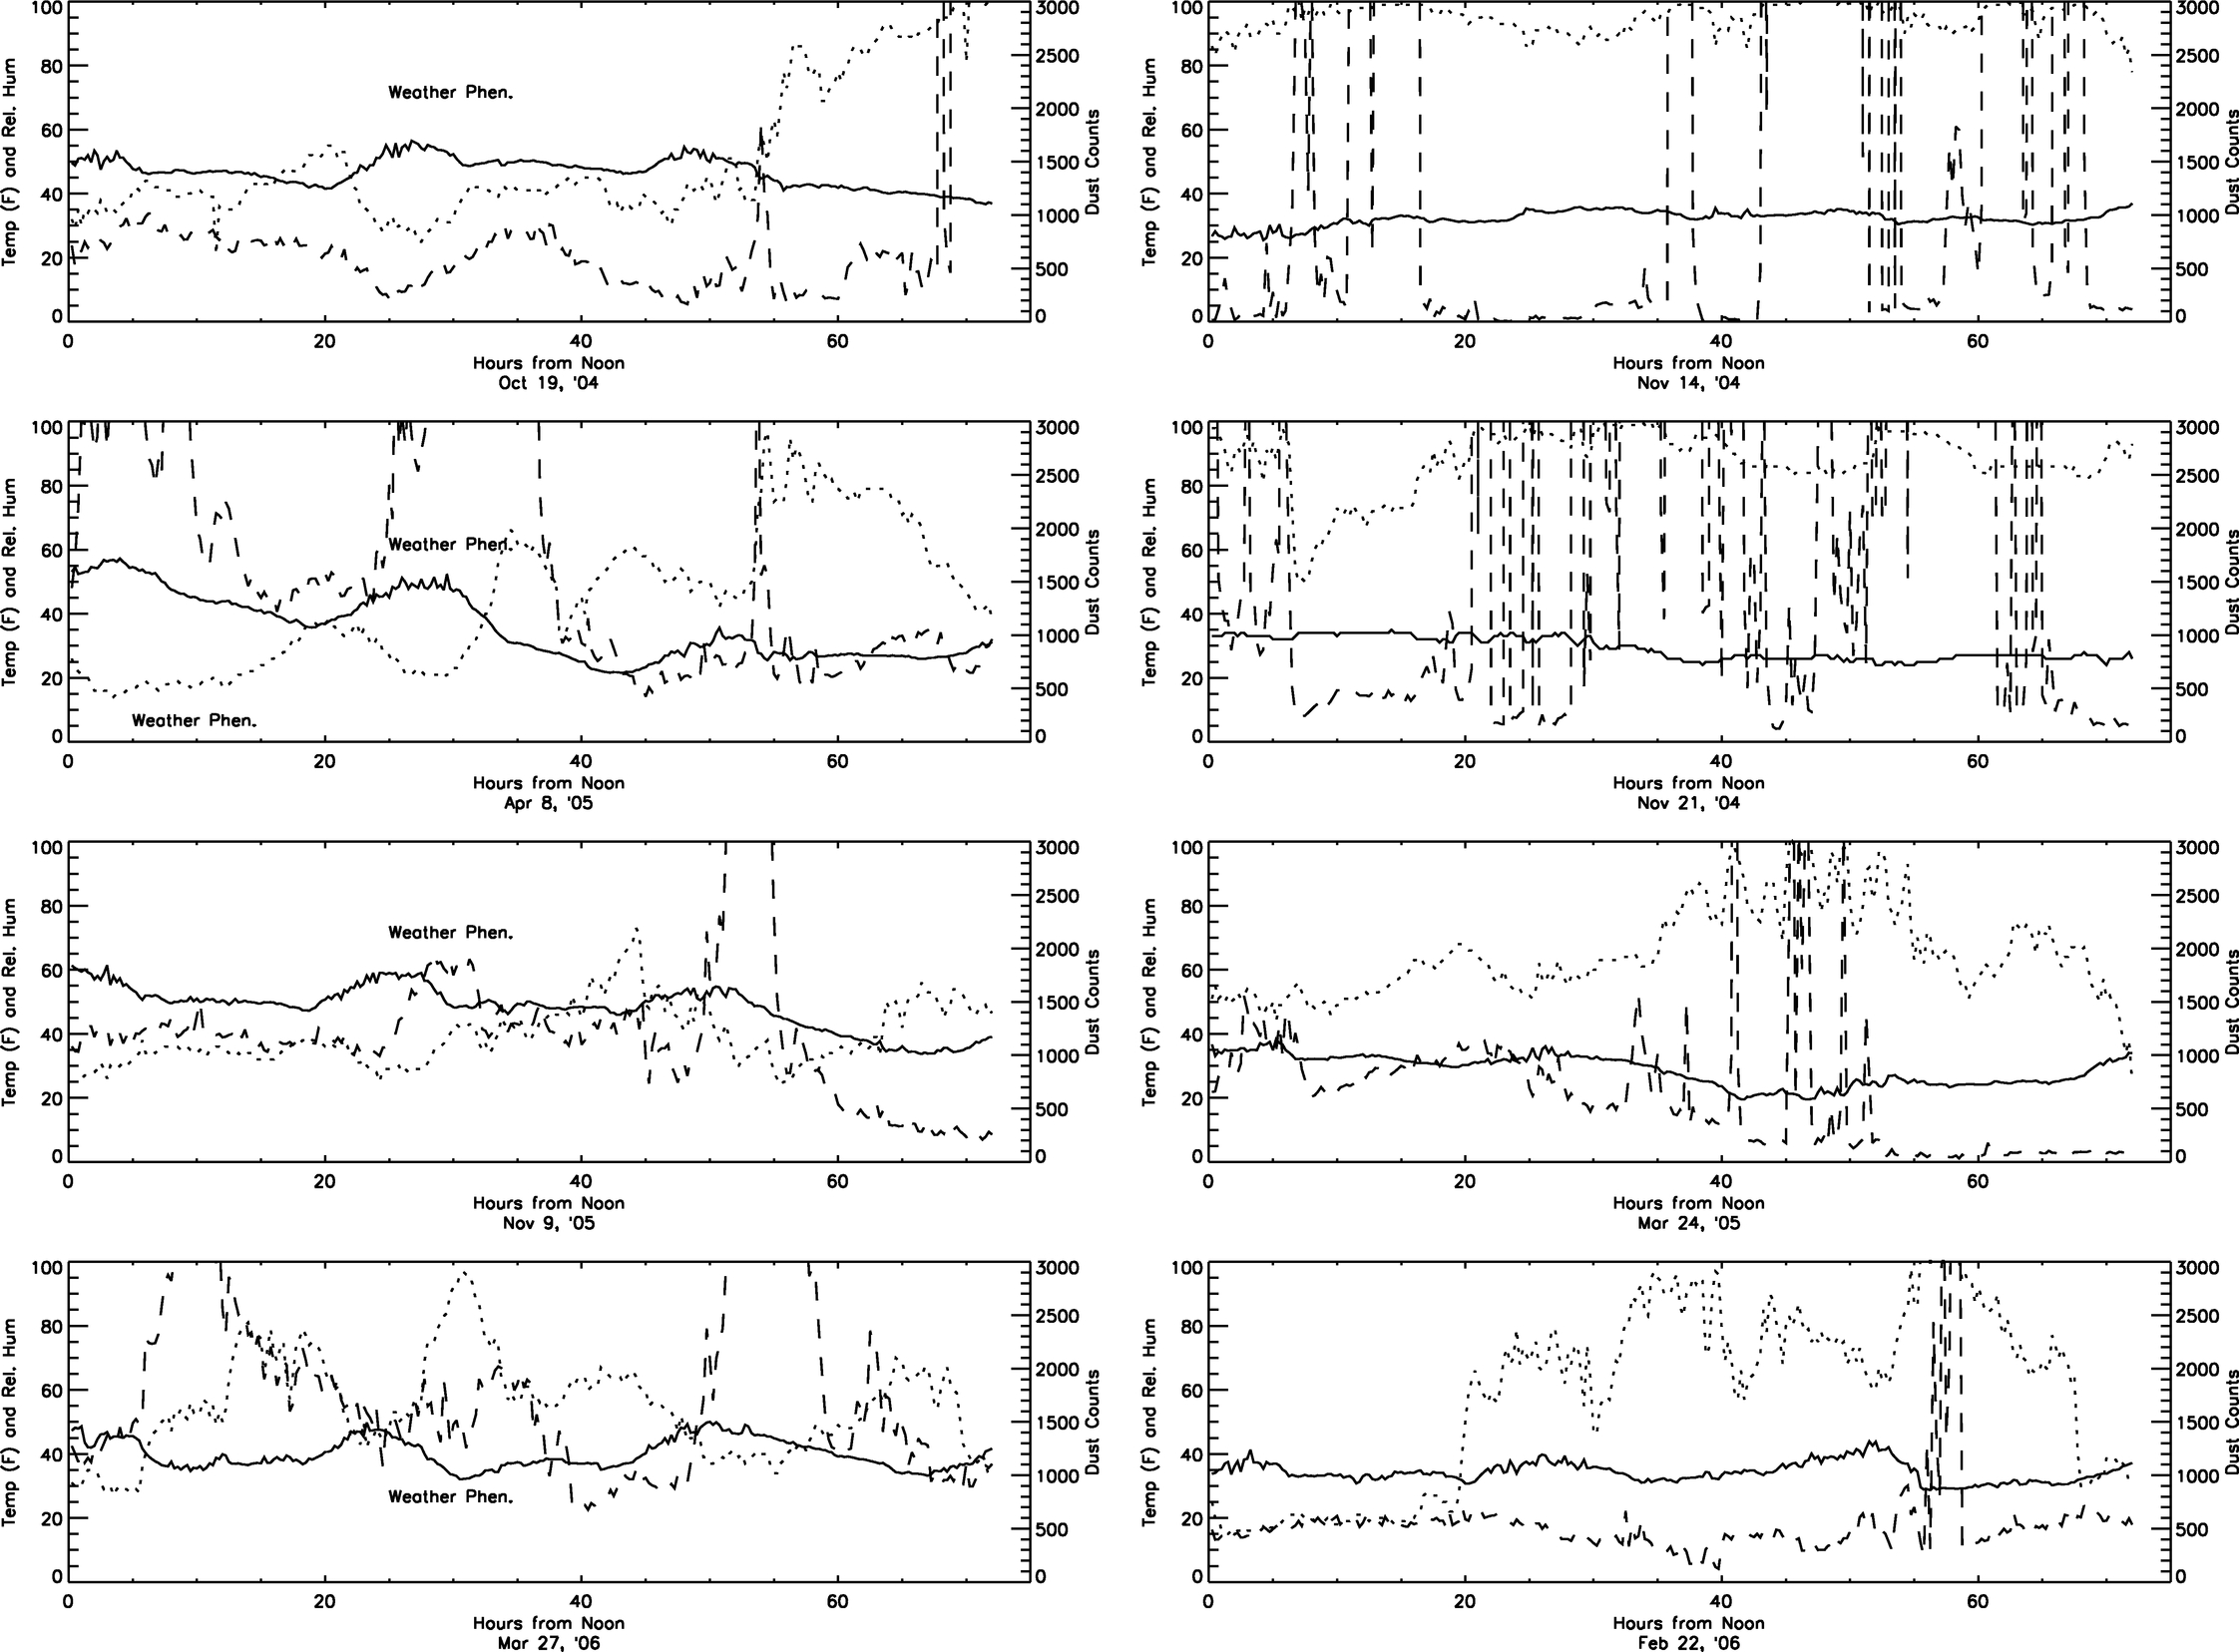
Fig. 2.— This plot shows eight dust events at the APO taken from our study. Each plot begins at noon local time on the date indicated below the plot and extends for 72 hr. Temperature in Fahrenheit (solid line) and relative humidity (dotted line) are shown on the left axis, while particle counts (dashed line) are on the right. When the particle counts go off‐scale (above 3000 counts per cubic foot), this is a "dust event." On the left column of plots are four dust events preceded by the identified weather phenomenon (indicated), while on the right are dust events without preceding weather phenomena. In our analysis we have found that 76.23% of the 223 dust events measured at APO during 17 months of data are preceded by the identified changes in temperature and humidity which we refer to as a weather phenomenon. (See text for details.)
3.1. Distribution of the Dust Events
We examined the normalized (by number of days per month in the sample) distribution of all 223 dust events by month from APO to see their seasonal variation/trends, and encapsulate our results in Figure 3. We find that, unlike the results stated by APO for a shorter sample of time (Varsik et al. 1997), there appear to be only two distinct "dust seasons" where more dust events occur, separated by interim periods with fewer dust events. There is a high percentage of dust events in the spring, peaking in April, and another peak in the fall around September. There were two periods with very few dust events, one which occurred in June and July, and the other in December and January. In New Mexico the monsoon season generally starts in the late summer and lasts for 6–8 weeks, and so this may account for the lower dust period around June and July.
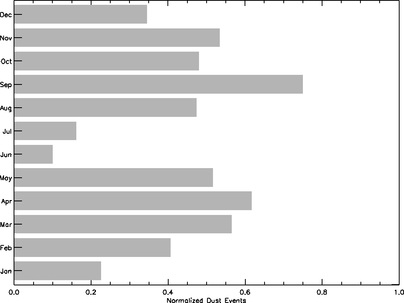
Fig. 3.— This plot shows the normalized (by days sampled in the period) yearly distribution of dust events by month at APO. There appear to be two distinct time periods when dust events are more likely to occur. A 1.0 on this plot would indicate that on average one dust event occurred every day during the time period sampled.
3.2. Dust Events without Weather Phenomenon
To explain these events, we attempted to determine whether anomalous sources of particulates might be in higher concentrations during these dust events. We used data available online to determine information on wildland fires in the area1 and analyzed archival North American jet stream data to investigate possible modes of transportation of dust particles from other, nonlocal areas. Analysis of the 53 identified dust events (out of 223) where the weather phenomenon did not occur during the preceding 48 hr showed that 68% of the time a large wildland fire (>100 acres) was burning in either New Mexico or Arizona. We also found that during the 30 hr preceding the beginning of a dust event the jet stream was centered over New Mexico 59% of the time.2 More analysis likely needs to be performed to determine what would cause the dust event to occur without the weather phenomenon.
3.3. APO's Dust Closure Policy
APO began archiving dust data with their weather data in early 1997. Effective 1998 May 5, APO established a dust closure policy which states that when their dust monitor's counts in the ≥1 μm channel exceeds 3000 particles per cubic foot, they will close their telescopes' domes to protect the optics until the dust level reentered the safe range. The policy further states that when particulate readings in this channel are between 2000 and 3000 particles per cubic foot, they will closely monitor the level of the particulates every 15 minutes to watch for sudden peaks in the readings which indicate the onset of a dust event. We analyzed the 223 dust events from APO to determine whether these criteria were sufficient to mitigate optics' exposure to dust events. We found that 52% of the time when there was a dust event, the level of the particulates 15 minutes prior to the dust event was below 2000 particles per cubic foot. This suggests that the APO criteria might need to be set to lower values or to more frequent monitoring to avoid exposure events for the optics if short‐term predictors are employed to mitigate dust exposure.
3.4. Time Dust Events and Weather Phenomenon Occurred
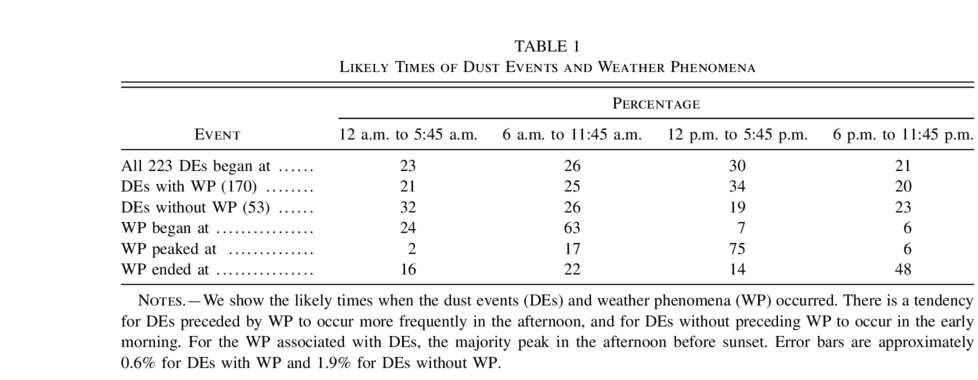
We examined the time of day when the dust events occurred to see whether there was a trend for either the case with (170) or without (53) a weather phenomenon preceding the event by splitting the day up into 6 hr time segments starting at midnight (to roughly correspond to normal diurnal cycles). We found that the dust events appeared to be evenly distributed throughout the day to within about 10%, with a slightly higher tendency toward all 223 events occurring in the afternoon. There was a slight difference in the predominant time of occurrence of the two populations. The dust events with a preceding weather phenomenon began more often in the afternoon (34% vs. 20%–25% for all other periods), and those without a preceding weather phenomenon began more often in the early morning hours (32% vs. 19%–26% for all other periods). For the 170 dust events preceded by the weather phenomenon, the weather phenomenon began predominantly in the morning (nominally around or after sunrise), peaked in the afternoon, and ended in the evening (nominally around or after sunset). Clearly the temperature excursions are coincident with a normal diurnal cycling associated with sunlight exposure. What is perhaps most striking is the fact that the weather phenomena preceding dust events peak predominantly (75%) in the afternoon hours. Based on the numbers of events in these samples, and the careful by‐hand sampling to find evidence of these weather phenomena, we would set error bars on the data associated with a preceding weather phenomenon at 0.6%, and for those without at 1.9%. Our results are encapsulated in Table 1.
 |
3.5. The Null Hypothesis
We performed some preliminary analysis for the "null hypothesis" of "a weather phenomenon without a subsequent dust event" by studying the month of 2004 December, which we chose because it had very few dust events recorded compared to other months in the sample. We found that of the 9 weather phenomena occurring in that month, 5 were followed by a subsequent dust event meeting APO's shutdown criteria (and that are part of our statistics discussed here). Another 2 were followed by a dust peak among particles larger than 1.0 μm roughly corresponding to our criteria above for the weather phenomenon, but which would have been too small to meet APO's shutdown criteria based on dust levels. From this small sample, only 2 of the 9 weather phenomena were not followed by a subsequent spike in the particulate levels at APO. Clearly more research needs to be performed on the occurrence of weather phenomenon without subsequent dust events, with possibly new criteria needed for classifying a "dust event."
3.6. Humidity Effects
Examining Figure 2 above, it is immediately clear that a difference in the relative humidity exists in the two sets of plots showing examples of dust events with a preceding weather event, and those without. Examining our entire data set, we find that the relative humidity is above 90% at the time of the dust event in 35 of the 53 (66%) dust events that are not preceded by a weather phenomenon. In the case of a preceding weather phenomenon, only 58 of those 170 (34%) dust events have a relative humidity value above 90%. While this is not a correlation, it may suggest different mechanisms for the two different classes of dust events. Other investigators have looked for a correlation between relative humidity, wind, and dust events and found no correlation at the time of the dust event (Porceddu et al. 2002). We recognize that the high relative humidity could effect the measurement of a dust event in two ways: (1) it could potentially result in false‐positive measurements by the dust sensor in saturated air, or (2) the humid air could be responsible for suspending more particulate matter. The presence of high humidity and dust together are one of the known damaging combinations for optics at telescopes. While the relative humidity does not appear to be useful as a predictive measure for dust events, it does suggest that further study of correlations with humidity may be warranted.
4. CONCLUSIONS AND FUTURE ANALYSIS
4.1. Explanation for Phenomenon
Several possible explanations likely exist for the association between the weather phenomena (temperature rising and then returning, while humidity falls and then recovers over about a 14 hr period) and subsequent dust event. The weather phenomena itself is most likely explained by normal diurnal cycling due to solar illumination, based on time of day when the weather phenomenon predominantly peaks. However, mountain environments are known for complex weather associated with the motion of winds along the slopes and over the mountain, and for phenomena such as mountain waves (see Salby 1996). While no correlation has been found with the wind speed or direction at the time of the dust events at APO (Gorgievska & Steinebach 2004), winds are not monitored at APO along the slopes of the mountain itself to determine larger scale trends around the mountain. Also, APO, as with most observatories, has no provision for measuring the chemical content of the dust arriving during the dust events. So currently it is not possible to determine whether the dust is from a local environment (e.g., a nearby desert) as opposed to being transported a much farther distance.
The weather phenomenon may signal a disruption of the normal air flow patterns in the mountain area. If we presume that most of the dust in these events is not local, as has been found in a previous study, then a disruption of air might make the location more susceptible to nonlocal air masses infiltrating the air near the observatory. Another avenue of investigation that may help resolve the relationship between weather phenomena and dust events is the study of a possible shear layer in the winds over the observatory (which, if absent, could allow the downward transportation of dust under favorable conditions). We have considered this hypothesis due to an indication by Gorgievska & Steinebach (2004) that the winds tend to be low to moderate (not high) at the beginning of a dust event at APO. The weather phenomena may also signal a large‐scale weather pattern which may bring with it air laden with more particulates; however, the timescales associated with this hypothesis and the measurements here seem too long for an obvious causal relationship. While we were able to identify a meteorological precursor which seems reasonably robust in its occurrence before the majority of dust events at APO, this study actually has produced many more questions than it has answered.
4.2. Future Analysis and Plans
Because no easy meteorological explanation is presented by the 28 hr time difference observed here, we have also investigated the possibility of a closer occurrence of the weather phenomenon preceding a dust event, nominally by only a few hours. Such a weather phenomenon could help to explain the flow of local winds, diurnal cycling, or possibly mountain waves in the immediate surroundings of the observatory—a more obvious causal relationship. Preliminary analysis of 100 of the dust events has found that 69% of the time before a dust event, the weather phenomenon we have identified here occurs approximately 7.2 ± 4.7 hr before the beginning of the dust event (as compared to the 76.23% of the time for weather phenomena occurring 28.6 ± 6.7 hr before reported above). The dates which we sampled included 2004 September 1 to September 30 and 2006 January 14 to May 31. More analysis needs to be completed on this closer temporal phenomenon and on possible correlations of repeated weather phenomena occurring before a particular dust event.
Further analysis also needs to be performed to ascertain correlations between other larger scale physical/meteorological characteristics associated with the dust events. In particular, a study of the 500 mbar surface height maps could be useful for backward projections of air masses over the preceding few days to determine a possible source of the dust particles. (The 500 mbar maps are at the level in the atmosphere which would reside at approximately ground level for APO and MRO observatories.) Further analysis to determine the origin of the dust, whether somewhat local or from very nonlocal sources, may best be accomplished through chemical analysis of collected particulates, which is done for aerosol studies in urban environments. For instance, such a study was performed in Hong Kong where "local dust" was chemically traced with X‐ray spectrometry, ICP‐MS analysis, and mesoscale modeling to have originated from over 2500 km away in northern China (Fang et al. 1999). Placement of weather monitors at other locations around the mountain and along the slopes may help identify whether the weather phenomenon is also correlated with certain air flow patterns around the mountain. Samples of dust at larger sizes, as indicated by Varsik et al. (1997), may also help in the identification of sources of the particles. Finally, comparison of dust event timings with ultraviolet aerosol maps may aid in our understanding of these phenomena, and may generally be useful for observatories to monitor if they are concerned about dust exposure.
Over the next year as MRO enters operations, we will be installing a Met One 227B particle counter in order to start archiving our own data on dust events. We are also planning on launching a larger study to compare the dust event data at MRO with that from APO and the McDonald Observatory (located 450 miles west of Austin, Texas, in the Davis Mountains near the Texas–New Mexico border). McDonald Observatory, we have recently learned, also has a Met One 227B particle counter, and all of their data is archived online for public viewing. These studies of the three nearby observatories may aid in determining larger patterns of dust events and weather phenomena associated with them.
We want to thank MRO and LANL for funding to support this primarily undergraduate research, and APO and their staff for making the data available for analysis and for answering our numerous questions. We also want to thank several atmospheric physics experts—Z. Fuchs, K. Minschwaner, D. Raymond, S. Sessions, and R. Sonnenfeld at NMT and J. Kleissel at UCSD—for valuable conversations regarding these data. Finally, we thank the anonymous referee for several comments which improved and clarified the manuscript. This paper made use of the NASA Astrophysics's Data System, which we gratefully acknowledge.
Footnotes
- 1
See http://gacc.nifc.gov/swcc/predictive/intelligence/ytd_historical/ytd_historical.htm (Southwest Coordination Center).
- 2
See http://squall.sfsu.edu/crws/archive/jetstream_archive.html (California Regional Weather Server).