
ABSTRACT
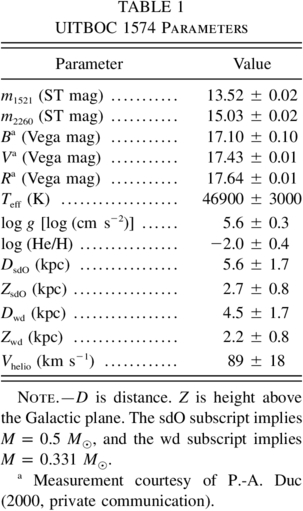
We have obtained the optical spectrum (3750–7500 Å) and ultraviolet fluxes at 1521 and 2260 Å for the quasar candidate UITBOC 1574. The optical spectrum shows strong Balmer absorption lines through at least n = 9 and the He ii line at 4686 Å. We compared the optical spectrum with non‐LTE stellar atmosphere models and find Teff = 46,900 ± 3,000 K, log g = 5.6 ± 0.3, and helium abundance log (He/H) = -2.0 ± 0.4. We classify the object as a hot subdwarf O star (sdO). With its high effective temperature and low helium abundance, UITBOC 1574 may be considered as belonging to the hot end of the subdwarf B population. The location of this object on the theoretical Teff‐g diagram suggests that it is most likely in a post–extreme horizontal branch evolutionary stage. However, we cannot exclude the possibility that UITBOC 1574 may be a low‐mass helium white dwarf precursor. We estimate a spectroscopic distance of 5.6 ± 1.7 kpc with a height of 2.7 ± 0.8 kpc above the Galactic plane if it is a helium‐poor sdO. The heliocentric radial velocity of the star is 89 ± 18 km s−1.
Export citation and abstract BibTeX RIS
1. INTRODUCTION
The object UITBOC 1574 (α = 9h45m45 5, δ = −14°17'11' ' [J2000]; l = 249
 6, b = 288 Galactic) drew our attention when we were inspecting the near‐UV and far‐UV images of the galaxies NGC 2992/3 from the Ultraviolet Imaging Telescope (UIT) because it appears projected near a tidal arm (Fig. 1) and is extremely bright in both UV passbands unlike most foreground stars.
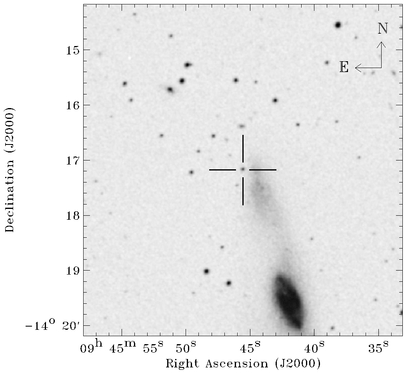
Fig. 1.— Finding chart for UITBOC 1574 (α = 9h45m455, δ = −14°17'11' ' [J2000]) obtained from the Digitized Sky Survey. The extended object is NGC 2992.
Weedman (1971) first noticed this object, because of its very blue color, in a search of Palomar Observatory Sky Survey (POSS) plates for possible quasars associated with nearby galaxies. Although an extremely low resolution (≥80 Å) spectrum taken by Burbidge et al. (1972) showed no emission lines, they described the spectral energy distribution as consistent with the characteristics of the quasar 3C 245. The preceding references have led to the object's inclusion as a quasar or quasar candidate by Monk et al. (1986) as well as in the Hubble Space Telescope Faint Object Spectrograph Quasar Absorption Snapshot Survey (Bowen et al. 1994). More recently, the object was cataloged in the UIT Near‐Ultraviolet Bright Object Catalog (Smith et al. 1996), where it has been given the designation UITBOC 1574. Had it been a quasar, it could have served as a useful probe of the interstellar medium in the NGC 2992/3 system.
In order to classify UITBOC 1574, we obtained a medium‐resolution optical spectrum. The spectrum reveals UITBOC 1574 to be clearly stellar. The presence of relatively strong Balmer absorption lines and the weak He ii 4686 Å line suggest that the object is a subdwarf O (sdO) star.
The sdO spectral class encompasses a large variety of stars. Stars belonging to this class cover a wide range of effective temperatures (40,000 K≤Teff≤90,000 K), have relatively high surface gravities (4.0≤log g≤6.5), and show substantial variation of hydrogen and helium abundances (see, e.g., Heber 1998). Although several evolutionary scenarios have been proposed to explain the positions of these stars in the H‐R diagram, Heber (1992) distinguished two basic groups. The first group includes stars with lower gravity that lie close to the post–asymptotic giant branch (post‐AGB) evolutionary tracks, while the second group comprises stars with higher gravity that are close to the post–extreme horizontal branch (post‐EHB) evolutionary tracks.
The position of UITBOC 1574 in the Teff‐g diagram suggests that it has evolved from the extreme horizontal branch (EHB). Moreover, its low helium abundance, which is a factor of 10 smaller than the solar abundance, is typical of the subdwarf B (sdB) stars that are part of the EHB. Stellar evolution studies of this class of stars show that these progenitors of low‐mass white dwarfs should intersect the position of UITBOC 1574 in the Teff‐g diagram at some point (Caloi 1989; Dorman, Rood, & O'Connell 1993). In this context, the discovery of UITBOC 1574 may be very important because it could shed light on the evolution of sdB stars.
In this paper we describe the optical spectrum (§ 2.1), complementary optical photometry (§ 2.2), and UV photometry (§ 2.3) of UITBOC 1574. The observations are compared to non‐LTE (NLTE) stellar atmosphere model computations in order to determine its atmospheric parameters (§ 3.1). The evolutionary status is then discussed (§ 3.2), and the distance is determined (§ 3.3).
2. OBSERVATIONS
2.1. Optical Spectroscopy
The optical spectrum of UITBOC 1574 was obtained on 2000 Feburary 15 at the Apache Point Observatory with the 3.5 m Astrophysical Research Consortium telescope and the Double Imaging Spectrograph (DIS). The DIS instrument employs a dichroic with a transition wavelength of 5350 Å. The medium‐resolution gratings were used to provide a dispersion of 3.15 Å pixel−1 in the blue (3750–5300 Å) and 3.5 Å pixel−1 in the red (5600–7500 Å).
The spectra were reduced using standard procedures within IRAF and employed bias frames, quartz lamp flats, and helium/neon/argon arc lamp frames taken prior to observing UITBOC 1574. Four exposures using the 1 5 wide slit were taken of the object for a total integration time of 50 minutes. The slit was oriented at the parallactic angle. The seeing was subarcsecond. Although the spectrophotometric standard star Hiltner 600 was observed, we did not flux‐calibrate the spectrum because of concerns about the quality of the standard‐star observations. A maximum signal‐to‐noise ratio of 50 (20) was obtained for the blue (red) portion of the combined spectrum. An FWHM resolution of 4.9 Å (7.9 Å) was achieved in the blue (red).
Figure 2 shows the normalized spectrum. All features are in absorption. The details of the spectral region between 3800 and 5000 Å are highlighted in the top panel of Figure 2. The hydrogen Balmer series lines (Hβ–H9) are the most significant features. The He ii (λ4686) line is present, but note the lack of any He i lines, indicating that the star has a high effective temperature. The bottom panel of Figure 2 details the spectral region between 5800 and 7000 Å, which shows the strong Hα line and the interstellar Na i (D) (λλ5890/5896) line. The absorption feature at 6873 Å is telluric.
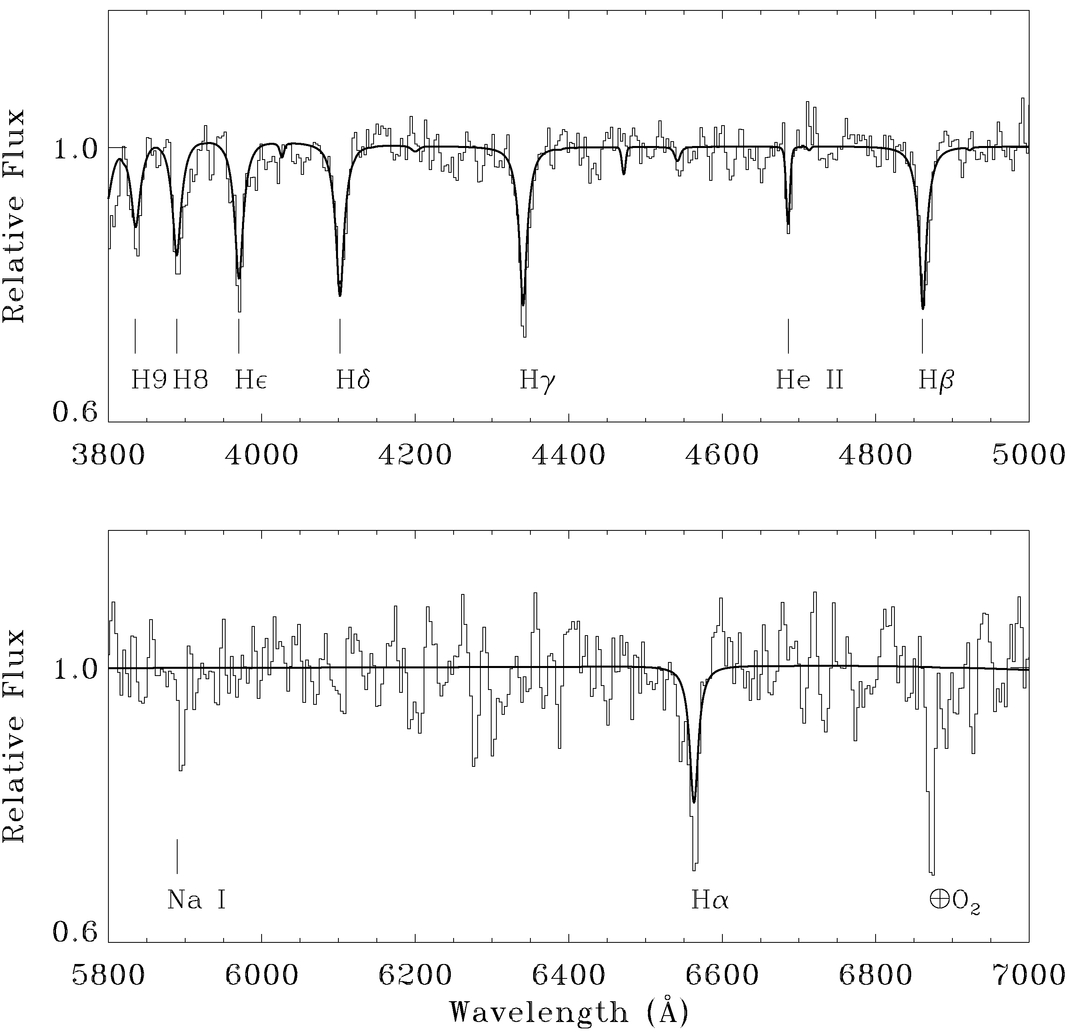
Fig. 2.— Normalized optical spectrum of UITBOC 1574 (histogram line). Top: The principal absorption lines are the hydrogen Balmer series Hβ (λ4861), Hγ (λ4341), Hδ (λ4102), H (λ3970), H8 (λ3889), H9 (λ3835). He ii (λ4686) is the only other prominent feature. Bottom: The principal absorption lines are Hα (λ6563) and Na i (D) (λλ5890/5896). The feature at 6873 Å is telluric O2. The smooth line is an NLTE synthetic spectrum calculated using TLUSTY/SYNSPEC with Teff = 46,900, log g = 5.6, and log (He/H) = -2.0.
A mean heliocentric radial velocity of 89 ± 18 km s−1 was measured from the six Balmer lines and the He ii line. The radial velocity measured from the interstellar absorption Na i line is just 4.1 km s−1.
2.2. Optical Photometry
The USNO‐A2.0 catalog (Monet 1998) offers a photometric measure of B = 16.8 ± 0.4 mag and R = 17.9 ± 0.4 mag derived from scanned POSS plates. The Monk et al. (1986) and Bowen et al. (1994) quasar candidate catalogs state V = 17.5. We have traced their V measurement backward through the literature to the estimate (by eye) of Weedman (1971) of B = 17.5 ± 1.0 from the POSS plates. It appears that this poorly estimated B magnitude was erroneously transcribed as a V magnitude by Monk et al. and now is in common use.
The NGC 2992/3 system was recently imaged by Duc et al. (2000), and UITBOC 1574 was in the field of view of their observations. P.‐A. Duc (2000, private communication) kindly provided us with photometric measurements of B = 17.10 ± 0.1, V = 17.43 ± 0.01, and R = 17.64 ± 0.01 for UITBOC 1574. These new measurements are within the error limits of the USNO‐A2 catalog, and we will use them henceforth. The details of the data collection and reduction can be found in Duc et al. (2000).
2.3. Ultraviolet Photometry
The ultraviolet fluxes are derived from images taken by the Ultraviolet Imaging Telescope (UIT). Details of the UIT instrument and characteristics of the data set can be found in Stecher et al. (1997). The far‐UV and near‐UV fields used are fuv0097 and nuv0090, respectively. Both images were taken on the 1991 Astro‐1 space shuttle mission and have an exposure time of 256 s. The far‐UV image was taken with the B1 filter (λeff = 1521 Å, Δλ = 354 Å). The near‐UV image used the A1 filter (λeff = 2488 Å, Δλ = 1147 Å). The data were obtained from the Multimission Archive at STScI (MAST). The UIT archived images are reduced and flux‐calibrated in units of ergs cm−2 s−1 Å−1. Photometry was performed using routines in the MOUSSE and Astronomy User's Software libraries of IDL.
Smith et al. (1996) have shown that the effective wavelength of the near‐UV A1 filter varies widely as a function of spectral type (or effective temperature) because of the large width of the filter. From their Figure 1, we take λeff∼2260 Å for our B−V = -0.33. The apparent ST2 magnitudes for UITBOC 1574 are thus m2260 = 15.03 ± 0.02 and m1521 = 13.52 ± 0.02 as measured within 8'' radius apertures. For comparison, Smith et al. measured m2260 = 15.02 ± 0.03.
3. RESULTS
From the optical spectrum combined with its overall faintness, we classified UITBOC 1574 as a spectroscopic sdO following Moehler et al. (1990b), who describe the sdO spectral class as having strong broad Balmer lines accompanied by He ii absorption and no He i. Furthermore, the published spectrum (4000–5000 Å) of the sdO PG 1339+052 by Moehler et al. (1990b) is nearly identical to that of UITBOC 1574. The blue B−V color of −0.33 is also consistent with the hot subdwarf colors in the Edinburgh‐Cape Blue Object Survey (Stobie et al. 1997). Moehler et al. (1990b) also define the spectral class of sdOB stars as essentially sdOs with the addition of He i absorption and note that they tend to have Teff≤40,000 K. UITBOC 1574 shows no He i absorption, and the effective temperature as determined by comparison with synthetic NLTE stellar atmosphere models is higher than 40,000 K (§ 3.1). Thus, classification as sdOB is excluded. All of the parameters measured or derived for the object are summarized in Table 1.
 |
3.1. Atmospheric Parameters
We compare the blue portion of UITBOC 1574's visible spectrum to grids of non‐LTE model spectra that were computed using the stellar atmosphere codes TLUSTY/SYNSPEC (Hubeny & Lanz 1995) and PRO2 (Napiwotzki 1997; Werner & Dreizler 1999). The models incorporate only detailed hydrogen and helium model atoms and no heavy elements. Having only low‐resolution optical spectroscopy, we have no information about the heavy‐element content of UITBOC 1574's atmosphere. For that reason we decided to neglect the effect of metal line blanketing, even though Lanz, Hubeny, & Heap (1997) demonstrated that the inclusion of metal line blanketing can decrease the derived Teff. However, this effect would be less than 10%.
We derive the atmospheric parameters of UITBOC 1574 by applying a χ2‐fitting technique to match the observed data to our best synthetic spectrum. By fitting the Balmer and helium line profiles, we estimate the effective temperature, gravity, and helium abundance of UITBOC 1574 (see, e.g., Saffer et al. 1994). One of us (R. N.) determined these atmospheric parameters by using the grid of models computed by the atmosphere code PRO2, obtaining Teff = 46,500 ± 3000 K, log g = 5.6 ± 0.2, and log (He/H) = -2.1 ± 0.3, when simultaneously fitting three Balmer lines (Hβ, Hγ, and Hδ), two He ii lines (λ4686, λ4552), and one He i line (λ4472). Using the grid of models computed by TLUSTY, we find Teff = 47,000 ± 2000 K, log g = 5.6 ± 0.2, and log (He/H) = -1.8 ± 0.3 when simultaneously fitting the same lines. The surface gravity drops by 0.2 dex when the three additional Balmer lines (H, H8, and H9) are included in the fitting process for the TLUSTY models. We find that the main reason for the small differences in the effective temperature and helium abundance is not due to the use of different atmosphere codes but to the continuum placement involved in the normalization of the data, which was different for both results.
We take the error‐weighted average of those results and obtain Teff = 46,900 ± 3000 K, log g = 5.6 ± 0.3, and log (He/H) = -2.0 ± 0.4. The relatively large quoted errors are the mean formal errors (ΔTeff = 2000 K; Δlog g = 0.2; Δlog He/H = 0.2), to which we add a systematic error. The formal errors give the precision of fitting the data to the model and indicate the quality of the observed spectrum, while the systematic error considered here illustrates how well we can normalize the data. The normalization of the observed spectrum is complicated because of its moderate signal‐to‐noise ratio (S/N∼50). Figure 2 shows a comparison between the entire optical spectrum of UITBOC 1574 and our best model computed with the atmospheric parameters cited above.
3.2. Evolutionary Status
Figure 3 shows the position of UITBOC 1574 in the Teff‐g diagram as the solid square with error bars. The Teff‐g diagram, which is similar to the H‐R diagram, is more suitable for describing the evolution of post‐HB stars. As pointed out by Hunger & Heber (1987), the Teff‐g diagram requires only spectroscopic data such as the effective temperature and gravity, while the H‐R diagram needs the additional knowledge of the star's distance in order to estimate its luminosity.
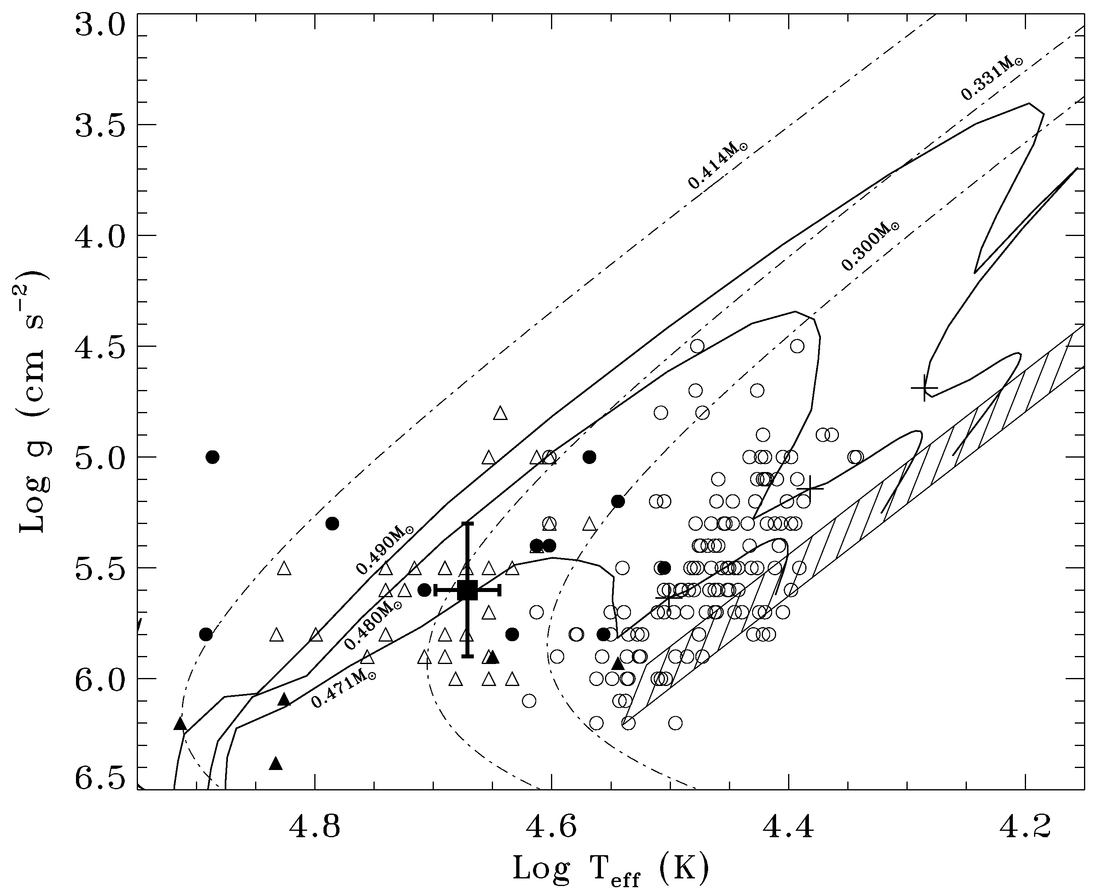
Fig. 3.— Location of UITBOC 1574 (filled square with error bars) on the Teff‐g plane. Open circles are sdB and sdOB stars. Solid circles are sdO stars. Open triangles are He‐sdO stars. Solid triangles are CSPNs. Hashed region is the ZAEHB. Solid lines are post‐EHB tracks of Dorman et al. (1993). Dot‐dashed lines are post‐RGB helium white dwarf tracks of Driebe et al. (1998). See text for details.
The position of UITBOC 1574 in the Teff‐g diagram is compared with a sample of stars taken from the literature (see Fig. 3). We can distinguish four groups of stars. The open triangles are helium‐rich sdO stars (He‐sdO) compiled from the works of Dreizler et al. (1990), Dreizler (1993), Thejll et al. (1994), and Lanz et al. (1997). They occupy the lower left corner of the Teff‐g diagram. Optical spectra of He‐sdO stars show very strong helium absorption lines and often no hydrogen lines at all. The filled triangles are low‐luminosity, low‐gravity, and hydrogen‐rich central stars of planetary nebulae (CSPNs; Méndez et al. 1988a, 1988b; Napiwotzki 1999). These CSPNs have helium abundances ranging from solar to 0.1 solar. The open circles are sdB and subdwarf OB (sdOB) stars (see, e.g., Moehler, Heber, & de Boer 1990a; Saffer et al. 1994). Optical spectra of these stars show strong and broad hydrogen lines. In addition to the hydrogen lines, faint He i lines are present in sdB stars, and faint He i and He ii lines are observed in sdOB stars. Finally, the solid circles are other sdO stars (Lemke et al. 1997) with low He abundances (log (He/H)≤0).
In order to specify the evolutionary status of UITBOC 1574, we display in Figure 3 the post‐EHB evolutionary sequences computed by Dorman et al. (1993) for objects of 0.471, 0.480, and 0.490 M⊙. These sequences were computed by assuming [Fe/H] = 0 (Z = 0.0169). They possess the same core mass (Mc = 0.469 M⊙) but have different hydrogen envelope masses (Menv = 0.002, 0.011, and 0.021 M⊙). Caloi (1989) and Dorman et al. (1993) demonstrated that the hydrogen envelope mass is the important parameter that determines the properties of the EHB stars at the zero‐age EHB (ZAEHB). For instance, as illustrated in Figure 3, they showed that the effective temperature of a star increases as its hydrogen envelope mass is decreased. The ZAEHB for helium core burning objects with core masses of Mc = 0.469–0.500 M⊙ is represented by the hashed region in the Teff‐g diagram. SdB and sdOB stars that are in or near this region have central helium‐burning cores of about 0.5 M⊙ with small hydrogen envelopes (Menv<0.05 M⊙), which are too small to ignite the hydrogen‐burning shell. They are in their HB phase of evolution that lasts about 120–150 Myr according to Dorman et al. (1993). This is illustrated by the tracks (solid lines) that rise from the ZAEHB and move first to the right and then to the left toward the plus signs, which represent the core helium exhaustion point.
The post‐EHB sequences suggest that UITBOC 1574 has evolved from the EHB. The post‐EHB evolutionary sequences at 0.471 and 0.480 M⊙ show that UITBOC 1574 should have left the helium core burning phase to undergo a helium shell burning phase. Because the hydrogen envelope mass is small, no hydrogen‐burning phase takes place and the star should reach higher effective temperatures as it contracts. This phenomenon is known as AGB‐manqué, or failed AGB, according to Greggio & Renzini (1990). UITBOC 1574 has a helium abundance typical of the sdB and sdOB stars, even though it appears among the He‐sdO stars in the Teff‐g diagram. This suggests that the atmosphere of UITBOC 1574 has experienced no dramatic changes since the helium core exhaustion phase.
One other possibility to interpret the evolutionary status of UITBOC 1574 is illustrated in Figure 3. It shows three post–red giant branch (post‐RGB) sequences computed by Driebe et al. (1998) at M = 0.300, 0.331, and 0.414 M⊙ (dot‐dashed lines). These sequences cross the domain where UITBOC 1574 lies in the Teff‐g diagram. Stars leaving the main sequence and reaching the RGB may undergo huge mass loss if, for example, they are members of close binary systems that experience common‐envelope evolution. In this situation, a large fraction of the star's mass is peeled off, and, instead of undergoing a helium flash followed by a helium‐burning phase, the star moves rapidly to the left in the Teff‐g diagram toward the white dwarf cooling sequences. As a result, the star evolves into a white dwarf with a low‐mass helium core.
Napiwotzki (1999) proposed that the CSPNs that are displayed in Figure 3 may be post‐RGB stars, except for one star (PHL 932: log Teff = 4.54 and log g = 5.95). The position of these stars in the Teff‐g diagram is not compatible with a post‐AGB status. The masses of these low‐gravity CSPNs range from 0.300 to 0.414 M⊙ according to the evolutionary tracks of Driebe et al. (1998). UITBOC 1574 is located near the post‐RGB track at 0.331 M⊙. Although we cannot confirm that this star has a nebula, its position on the Teff‐g diagram suggests that it could be a post‐RGB star with a mass of ∼0.331 M⊙ evolving into a helium white dwarf.
By comparing the time a star spends on a post‐EHB sequence to a post‐RGB sequence around the locus of UITBOC 1574, we can predict which evolutionary scenario is the most likely. A star evolving on a post‐RGB track passes the region of UITBOC 1574 very rapidly. For example, by taking the evolutionary track of Driebe et al. (1998) at 0.331 M⊙, we estimate that UITBOC 1574 should spend only ∼2 × 10⁵ yr in this section of the Teff‐g diagram. On the other hand, a post‐EHB star with a mass of 0.471 M⊙ spends ∼4 × 10⁶ yr in the vicinity of UITBOC 1574. The time passed on the post‐EHB track is about a factor of 20 longer than the time spent on the 0.331 M⊙ post‐RGB track. Consequently, UITBOC 1574 is more likely to be a post‐EHB star rather than a post‐RGB star. However, because we do not know whether or not a nebula is present around UITBOC 1574, we cannot rule out the possibility that it is post‐RGB.
3.3. Distance
We estimate the distance to UITBOC 1574 from the measured photometric magnitudes and the spectroscopic data. The observed intrinsic flux Fobs at the Earth relates to the emergent flux at the surface of the star F by
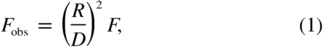
where R and D are the radius and distance of the star. If we assume that UITBOC 1574 is a post‐EHB star, stellar evolution theory predicts that its mass must be very close to 0.5 M⊙ (see, e.g., Dorman et al. 1993). With a known value of log g = 5.6 and by assuming a mass of 0.5 M⊙, we estimate the radius of UITBOC 1574. We obtain F by computing a stellar model atmosphere from the parameters derived in § 3.1 (in fact, we obtain the Eddington flux H that is equal to F/4π). We determine the observed intrinsic flux by comparing the apparent visual magnitude V of UITBOC 1574 to that of Vega. This is given by
where AV is the interstellar absorption and F0, V is the average absolute flux of Vega at V as specified in Heber et al. (1984). Given the above parameters, we substitute equation (2) into equation (1) and obtain an expression of UITBOC 1574's distance,
where G is the gravitational constant, M is the mass of the star, HV is the Eddington flux from the model atmosphere weighted by the Johnson passband V provided by Bessel (1990), and g is the gravitational acceleration.
To derive AV we compute the intrinsic color index (B−V)0 by using the best model fit parameters and the passbands of Bessel (1990). We obtain an observed color index (B−V) = −0.33 ± 0.1 that is bluer than (B−V)0 = -0.283 ± 0.004, indicating that either the stellar atmospheric parameters or the observed colors are inaccurate. The larger uncertainty in the computation of AV comes from the observed B color (ΔB = 0.1), so in order to obtain an upper limit of AV, we take the lower limit of B and the upper limit of V. This gives B−V = -0.23, which yields a color excess E(B−V)≤0.06. This is in agreement with the value E(B−V) = 0.06 as determined by Schlegel, Finkbeiner, & Davis (1998) based on their maps of infrared dust emission for this region of the sky. By taking RV = 3.1 and E(B−V) = 0.06, the interstellar extinction is then AV = 0.186. Consequently, the distance to UITBOC 1574 is 5.6 ± 1.7 kpc. If we assume no extinction, then the distance increases to 6.1 kpc.
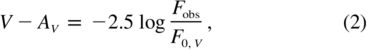
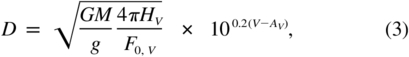
The spectral energy distribution of UITBOC 1574 is displayed in Figure 4. The diamonds represent the far‐UV, near‐UV, B, and V photometric measurements with filter FWHMs shown as error bars. The thin line is the non‐LTE model atmosphere spectrum normalized to a distance of 5.6 kpc and reddened by applying the extinction curve from Fitzpatrick (1999) with E(B−V) = 0.06 and RV = 3.1 (essentially the V magnitude). The observed spectrum has been normalized to the model continuum and overplotted as a thick line. The far‐UV data point is the only significant deviation from the reddended model spectrum. However, the far‐UV is sensitive to the assumed slope (R) and shape of the Galactic extinction curve.
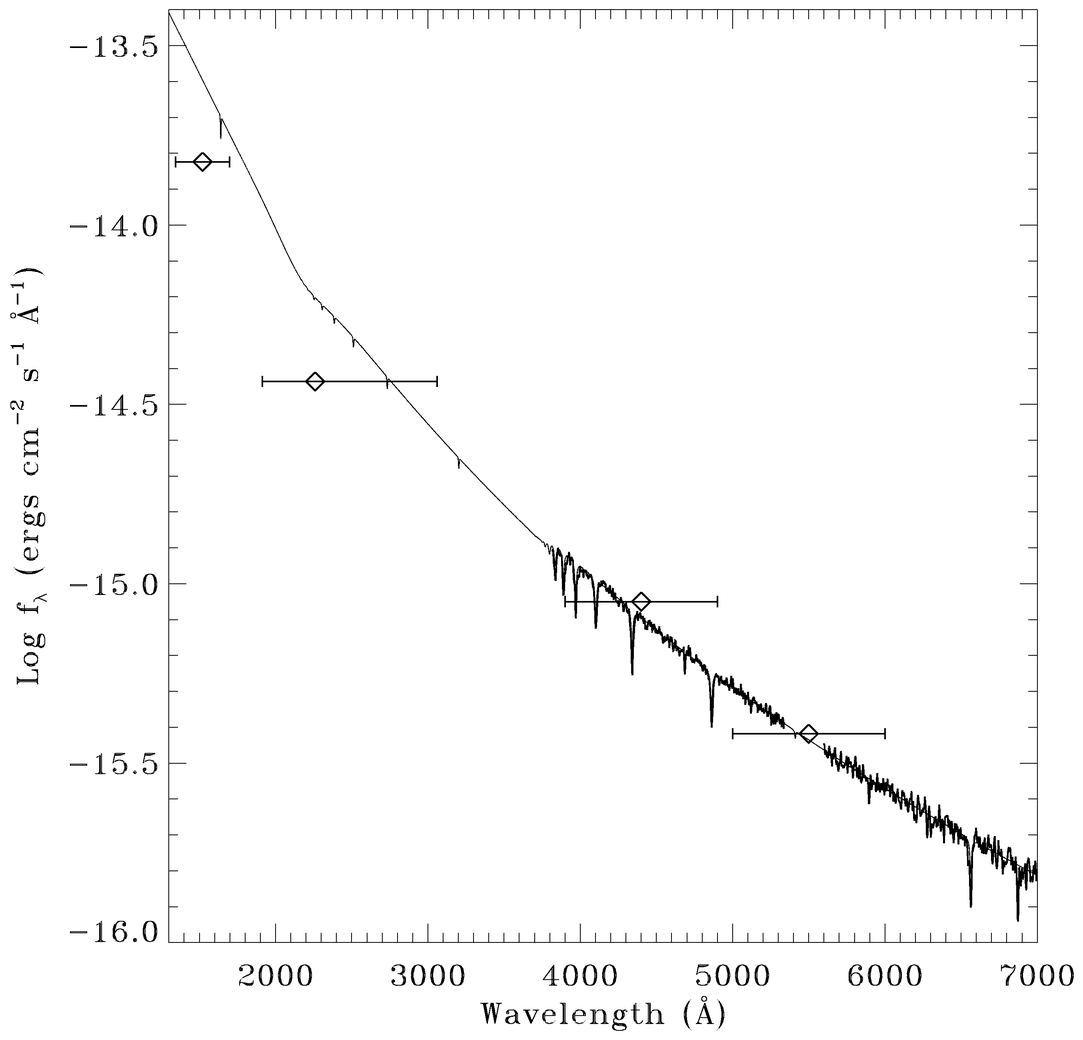
Fig. 4.— Spectral energy distribution of UITBOC 1574. The diamonds are flux values measured from the UIT and the optical imaging of Duc et al. (2000). The horizontal error bars represent the FWHM of the filters. The thin line is our best NLTE model normalized to a distance of 5.6 kpc and reddened with E(B−V) = 0.06. The thick line is the observed spectrum normalized to the model continuum.
UITBOC 1574 may be the most distant known subdwarf. This may not be surprising because it is below or near the detection limit of most blue object surveys. The spectroscopic‐based distance and its Galactic latitude b = 288 imply a height of 2.7 ± 0.8 kpc above the Galactic plane, placing it in the thick disk or halo of the Galaxy. Saffer & Liebert (1995) estimate the scale height of the subdwarf stellar population to be at least ∼500 pc; but they also note the bright limiting magnitude of the surveys used. UITBOC 1574 is certainly in the far tail of the distance distribution. If UITBOC 1574 is a helium white dwarf with M = 0.331 M⊙, then the distance is at least 4.5 kpc with a height of 2.2 kpc above the Galactic plane.
4. CONCLUSIONS
We have analyzed the optical spectrum, optical photometry, and ultraviolet photometry of UITBOC 1574. We classify the object as an sdO star because of the strong Balmer absorption lines, the He ii line at λ4686, the lack of He i, and the very blue color. UITBOC 1574 should be removed from the catalogs and electronic databases of quasars and quasar candidates.
We have compared the observed spectrum with models computed using two separate NLTE stellar atmosphere codes. The models are in very close agreement with each other, and the weighted average atmospheric parameters are Teff = 46,900 ± 3,000 K, log g = 5.6 ± 0.3, and helium abundance log (He/H) = -2.0 ± 0.4.
The position of UITBOC 1574 on the Teff‐g diagram suggests that it is likely in a post‐EHB evolutionary stage and may serve as an example of sdB evolution without atmospheric He enrichment.
If it is a helium‐poor sdO, the estimated spectroscopic distance is at least 5.6 ± 1.7 kpc, which may be the most distant sdO star known. However, we cannot exclude the possibility that UITBOC 1574 is a low‐mass helium white dwarf precursor. A deep search for a surrounding planetary nebula could help settle this question.
We would like to thank Nolan Walborn (STScI) and Howard Bond (STScI) for discussions regarding the classification of UITBOC 1574. M. S. would also like to thank Alan Uomoto (JHU) for his patience and guidance at Apache Point Observatory, Ivan Hubeny (GSFC/NASA) for providing the TLUSTY/SYNSPEC stellar atmosphere modeling code, and Pierre‐Alain Duc for generously sharing data. This research has made use of the NASA/IPAC Extragalactic Database, which is operated by the Jet Propulsion Laboratory, California Institute of Technology, under contract with the National Aeronautics and Space Administration.
Footnotes
- 1
Based on observations obtained with the Apache Point Observatory 3.5 m telescope, which is owned and operated by the Astrophysical Research Consortium.
- 2
ST mag = -21.1–2.5log fλ.