


Abstract
We compare the structure and kinematics of the 11 known satellites of the Milky Way with high-resolution simulations of the formation of its dark halo in a ΛCDM universe. In contrast to earlier work, we find excellent agreement. The observed kinematics are exactly those predicted for stellar populations with the observed spatial structure orbiting within the most massive ‘satellite’ substructures in our simulations. Less massive substructures have weaker potential wells than those hosting the observed satellites. If there is a halo substructure ‘problem’, it consists of understanding why halo substructures have been so inefficient in making stars. Suggested modifications of dark matter properties (for example, self-interacting or warm dark matter) may well spoil the good agreement found for standard cold dark matter.
1 Introduction
In hierarchical cosmologies such as the now-standard ΛCDM model, objects like the dark halo of our Milky Way grow through the merging of previously collapsed systems with a wide range of masses. Even the earliest detailed models for the growth of a ‘Milky Way’ showed that simple assumptions for star formation efficiency imply many more visible satellites than are actually observed (Kauffmann, White & Guiderdoni 1993). Kauffmann et al. argued that gas condensation and thus star formation must be strongly suppressed in systems with low escape velocity, perhaps by photoionization heating. This echoed the arguments of Efstathiou (1992) on the related question of why the faint-end slope of the observed galaxy luminosity function is much shallower than predicted by the simple hierarchical galaxy formation theory of White & Rees (1978) and its later reworkings in the cold dark matter (CDM) context (e.g. White & Frenk 1991).
This issue drew relatively little attention until N-body techniques became capable of simulating haloes with hundreds of thousands of particles. Moore et al. (1999) and Klypin et al. (1999) showed that galaxy haloes in a CDM cosmogony are not smooth systems. Roughly 10 per cent of the mass within their virialized regions is contributed by a host of dense self-bound substructures. These are the surviving cores of objects which merged together to make the final system, and so correspond directly to the overabundant satellites of the earlier models. The apparent overabundance may again be reconciled with the small number of visible satellites by invoking the inhibiting effects of photo-heating (Bullock, Kravtsov & Weinberg 2000; Benson et al. 2002). Both Moore et al. (1999) and Klypin et al. (1999) emphasized a different problem, however. The maximum circular velocities of the 10 or 20 most massive substructures within a Milky Way halo are predicted to be in the range 20 to 60 km s−1, whereas the observed velocity dispersions of seven of the 11 satellites of the Milky Way are below 10 km s−1. Halo models typically have well over a hundred substructures with maximum circular velocity above 10 km s−1.
This discrepancy has been considered a ‘crisis’ for the conventional ΛCDM cosmogony, prompting proposals to modify the microscopic properties of the dark matter (e.g. Spergel & Steinhardt 2000; Moore et al. 2000; Yoshida et al. 2000; Bode, Ostriker & Turok 2001). We here examine the discrepancy more critically, using ΛCDM simulations with similar resolution to the best simulations of Moore et al. (1999) or Power et al. (2002). We analyse the potential well structure of the most massive ‘satellites’ in our final system, calculating the velocity dispersion profiles predicted if stellar systems identical in structure to the observed satellites are placed in each. Remarkably, we find excellent agreement with the observed velocity dispersions, even for systems like Fornax and Draco where resolved profiles are available (Mateo 1997; Kleyna et al. 2002).
As we were completing this work, Hayashi et al. (2002) posted a preprint addressing similar issues (and with similar conclusions). Their approach is complementary to the one we adopt here. They do not analyse a fully consistent simulation of a Milky Way halo and its substructure, nor do they compare in detail with the kinematic structure of the observed dwarfs. On the other hand, they carry out a much more complete and reliable analysis of the structural evolution of individual satellite substructures than is possible with our own simulation data. We will use their results below to provide an independent check on the most uncertain aspect of our own simulations – whether they give reliable estimates for the inner ‘core’ structure of satellite subhaloes.
In the next section we will give a brief description of the simulations that we have carried out, the methods that we have used to find substructures and to characterize their potential wells, and the checks that we have made on the reliability of these measures. Section 3 then shows how to predict the line-of-sight velocity dispersion profile for a dwarf galaxy of given spatial structure within a given potential well. We apply the technique to the 11 known satellites of the Milky Way and the 20 deepest satellite potential wells of our highest resolution simulation. Section 4 discusses our results, their principal remaining uncertainties and their implications.
2 The N-body simulations
We work with a flat Λ-dominated cold dark matter universe, with matter density Ωm= 0.3, cosmological constant ΩΛ= 0.7, expansion rate H0= 70 km s−1 Mpc−1, index of the initial fluctuation power spectrum n= 1, and present-day fluctuation amplitude σ8= 0.9. We begin with a dark matter simulation of a ‘typical’ region of the Universe (N∼ 6 × 10⁷, particle mass ∼2 × 10⁸ M⊙) for which the techniques of Springel et al. (2001b, hereafter SWTK) have been used to follow the formation of the galaxy population (Stoehr et al., in preparation). We identify a relatively isolated ‘Milky Way like’ galaxy and re-simulate its halo at a series of higher resolutions, again using techniques from SWTK and the N-body code gadget (Springel, Yoshida & White 2001a). In the simulations GA0, GA1 and GA2 analysed in this paper, the re-simulated halo has 13 603, 123 775 and 1 055 083 particles respectively within r200, the radius enclosing a mean density 200 times the critical value. The density profiles of these three re-simulations agree well and are accurately fitted by the NFW formula with concentration c= 10 (Navarro, Frenk & White 1997). We show the corresponding circular velocity curves in Fig. 1(a). These have been scaled down by a factor of 0.91 in velocity and radius (corresponding to a factor of 0.74 in mass, but unchanged density- and time-scales) so that they peak at 220 km s−1. With this scaling, dark matter particle masses are 1.8 × 10⁸, 1.9 × 10⁷ and 2.0 × 10⁶ M⊙, and Plummer equivalent softening lengths are 1.8, 1.0 and 0.49 kpc in GA0, GA1 and GA2, respectively. In all three r200≈ 270 kpc. Note that, since the stars of the Milky Way contribute significantly to its measured rotation velocity, our chosen scaling probably produces too large a mass for the Milky Way halo and thus also for substructures within it. This is conservative for the purposes of this paper.
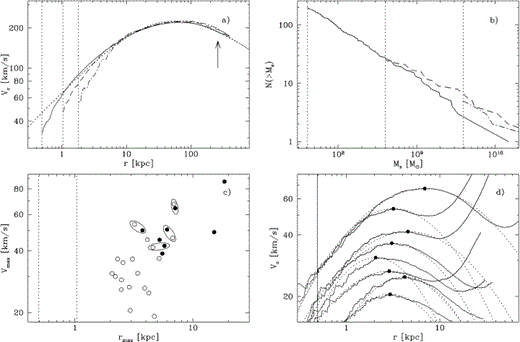
(a) Circular velocity curves for the ‘Milky Way’ haloes in our three re-simulations, scaled to peak at 220 km s −1 . An arrow indicates r200 . We overplot an NFW fit with c = 10 (dotted line). Vertical lines show the Plummer softening lengths. (b) The cumulative number of subhaloes within r200 as a function of their mass for these same three re-simulations. Vertical lines show the 20 particle limits. (c) The maximum of the circular velocity curve against the radius at which it is reached for all subhaloes with more than 100 particles in GA1 (filled circles) and with more than 300 particles in GA2 (open circles). Vertical lines show the softening lengths and ellipses enclose counterpart subhaloes. (d) Circular velocity curves and fits to equation (1) for subhaloes 1, 2, 5, 8, 11, 14, 17 and 20 in GA2 in order of decreasing Vmax . The vertical line shows the softening length.
We identify self-bound substructures within our final haloes using the procedure subfind described in detail by SWTK. In Fig. 1(b) we compare the number of substructures found within r200 in each of our simulations. For each we plot cumulative abundances down to a mass corresponding to 20 particles. Clearly the agreement is good. For example, down to 4 × 10⁹ M⊙, the 20-particle limit for GA0, we find five, seven and two subhaloes in GA0, GA1 and GA2, respectively, well within the fluctuations expected for Poisson statistics. Down to the 20-particle limit for GA1 (4 × 10⁸ M⊙) there are 28 and 27 subhaloes in GA1 and GA2. We have also verified that our cumulative function of peak velocities is consistent with that of Font et al. (2001).
For each subhalo we define the centre as the position of the densest particle, where densities are evaluated using a smoothed particle hydrodynamics (SPH) smoothing kernel. We then calculate a circular velocity curve as Vc(r) =[GM(r)/r]1/2, where M(r) is the total mass within r of this centre. In almost all of the more massive subhaloes, these curves rise from the centre, peak at a distance of a few kpc, and then fall for a while before eventually rising again because of the contribution from the smooth halo. Fitting such curves we can define a maximum circular velocity and a radius at which it is achieved for each subhalo. In Fig. 1(c) we plot these two quantities against each other for all subhaloes in GA1 and GA2 with more than 100 and 300 particles, respectively. There is a weak correlation but no clear tendency for the GA1 subhaloes to be less concentrated (i.e. to have larger rmax at given Vmax) than those in GA2. By comparing the evolution of the two simulations in detail, it is possible to identify counterparts in GA2 for all the eight GA1 subhaloes plotted in Fig. 1(c). Four of these lie within r200 in GA2, and the corresponding pairs of points are indicated with ellipses in the plot. There is good agreement between the (Vmax, rmax) values measured in the two simulations despite the factor of 10 difference in mass resolution.

3 Subhalo potentials and the observed Milky Way satellites
Except for the Magellanic Clouds, all the known satellites of the Milky Way are dwarf spheroidal galaxies. All have measured core and tidal radii, as well as measured central line-of-sight velocity dispersions. We summarize the data in Table 1. They are taken primarily from the review of Mateo (1998), but we have preferred the more recent density profile parameters measured for Draco by Odenkirchen et al. (2001). Sagittarius is also a special case. Here we take the core and tidal radii from the pre-disruption model of Helmi & White (2001) and carry out our analysis using both the current central velocity dispersion given by Mateo and the higher pre-disruption value from the model of Helmi & White. The latter value and quantities based on it are indicated in parentheses in Table 1. For Fornax and Draco there are also published velocity dispersion profiles with good signal-to-noise ratio; we compare these with our ΛCDM predictions below. To characterize the potentials of the Magellanic Clouds we take a circular velocity of 50 km s−1 at a distance of 5 kpc for the Large Magellanic Cloud (LMC) (van der Marel et al. 2002) and a circular velocity of 60 km s−1 at a distance of 2.5 kpc for the Small Magellanic Cloud (SMC) (Stanimirovic 2000). Comparing with Fig. 1(d), we see that the Clouds fit well in the two most massive subhaloes of GA2. We now ask whether the next 10 or so most massive simulated subhaloes could host the observed dwarf spheroidals.
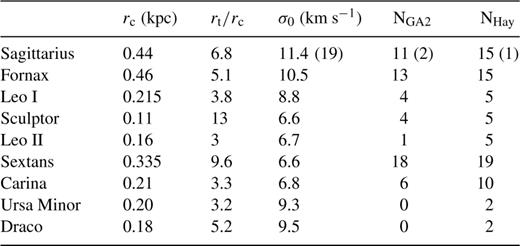
Core radii rc, tidal-to-core radius ratios rt / rc and central velocity dispersions σ0 for the Milky Way dwarf spheroidals. The last two columns show the number of simulated subhaloes for which the predicted central velocity dispersion is larger than that observed. The first takes a in equation (1) from a fit to our data, the second fixes a = 0.37 .

We have used this method to calculate the expected central line-of-sight velocity dispersion of a stellar system with the core and tidal radii of each of the observed dwarf spheroidals embedded in each of the 20 most massive substructures in our GA2 halo. For each dwarf spheroidal, we count the number of subhaloes for which the predicted central dispersion is larger than that observed, and we record this number in Table 1. We have carried out this exercise twice: once using the fits to the individual simulated circular velocity curves (see Fig. 1d), and once taking rmax and Vmax from the simulation and then using a= 0.37 in equation (1) for all subhaloes. The latter procedure forces the inner structure of each subhalo to resemble that of the most concentrated of the stripped satellites simulated by Hayashi et al. (2002). These numbers show a remarkable result. For both assumptions, all 11 of the satellites of the Milky Way can be accommodated within the 20 most massive subhaloes, and all but three can be accommodated within the 10 most massive (all but two if the higher dispersion value is adopted for Sagittarius). Given that substantial realization-to-realization fluctuations are expected in the properties of the more massive subhaloes, there is surprisingly good agreement between the kinematics of the observed satellites and those predicted by our ΛCDM simulation.
For Fornax and Draco, more detailed kinematic data have been published and allow a closer comparison. In Fig. 2 we reproduce velocity dispersion profiles from Mateo (1997) for Fornax, and from Kleyna et al. (2002) for Draco, and we overplot the predictions of the above equations for a number of our more massive subhaloes. From this figure it is clear that GA2 predicts not only the correct central velocity dispersion values, but also the correct shapes for the dispersion profiles. Within the observational uncertainties this is equally true for circular velocity curves taken directly from GA2 and for curves with the most concentrated shape consistent with the simulations of Hayashi et al. (2002). The maximum circular velocities of the subhaloes compared with the Fornax data range between 31 and 46 km s−1. The corresponding range for the subhaloes compared with Draco is 35 to 54 km s−1. In a ΛCDM model the dark haloes of dwarf spheroidals are predicted to have maximum circular velocities much larger than the observed velocity dispersions. It is a curious that the observational data require Draco and Fornax to have similar haloes despite the fact that Fornax is more luminous by a factor of almost 60.
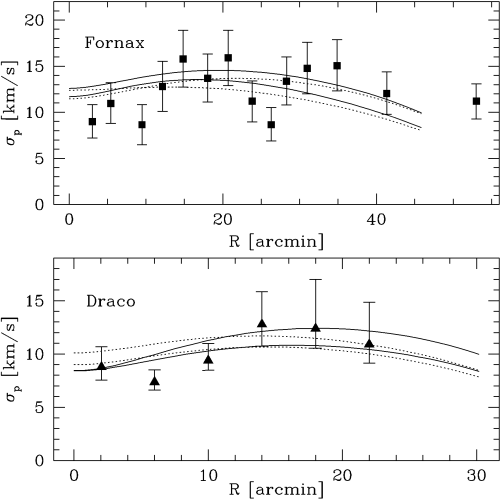
Observed velocity dispersion profiles for Fornax and for Draco are compared with those predicted for stellar systems with the observed density structure embedded in some of the most massive dark matter satellites in our ΛCDM simulation. The solid lines show results for circular velocity curves estimated directly from our simulation (GA2), while dotted lines assume a circular velocity curve shape similar to that of the most concentrated satellites in the simulations of Hayashi et al. (2002) .
4 Discussion
The previous section shows that the potentials of the most massive subhaloes in our ΛCDM simulation are in excellent agreement with the observed kinematics of the Milky Way satellites. There is some reason to be cautious, because subhalo concentrations could be significantly underestimated as a result of numerical limitations, in particular the relatively large gravitational softening and particle mass in even our highest resolution simulation. We have argued from a comparison of simulations with differing resolution that the induced bias in the values of Vmax and rmax is small for objects as massive as those that concern us here. Furthermore, our subhalo circular velocity curves agree well at small radii with those that Hayashi et al. (2002) obtain from much higher resolution simulations of the tidal stripping of individual satellites. These authors explain why tidal effects produce objects with lower central concentration than isolated haloes of similar maximum circular velocity. Even adopting the most concentrated profile consistent with their simulations has only a minor effect on our analysis. (Compare the rankings for the two cases in Table 1.) On the basis of the currently available observational and simulation data, it seems more appropriate to consider the observed kinematics of the Milky Way satellites as a triumph for the ΛCDM model than as a crisis.
If the observed dwarf spheroidals do indeed have dark haloes of the kind that both we and Hayashi et al. (2002) suggest, there are a number of interesting consequences. In the first place, the measured ‘tidal radii’ can have nothing to do with tidal effects, but must reflect an edge to the visible stellar population within a much more extended dark halo. This kind of structure appears to be a direct and inevitable consequence of the flat or rising velocity dispersion profiles measured in Fornax and Draco. Tidal tails and extra-tidal stars should not, then, be present in most systems. Although there is no problem accommodating a single disrupting object like Sagittarius, it would become uncomfortable if tidal stripping were detected unambiguously in other systems. There are some indications that Carina might be such a case (Majewski et al. 2000).
A second consequence is that the total mass associated with the dwarf spheroidals is much larger than usually assumed. The tenth most massive subhalo in our GA2 simulation has a bound mass of 1.2 × 10⁹ M⊙ and its progenitor system was several times more massive just before it fell into the halo of the Milky Way. This sharpens the problem of understanding why the dwarf spheroidals have formed stars with such low efficiency: their stellar masses lie in the range 106 to 108 M⊙. Clues presumably lie in their comparatively narrow ranges of size and velocity dispersion, and in their surprisingly varied star formation histories (Mateo 1998).
Finally, if the observed satellites do occupy the most massive subhaloes in a ΛCDM model, then many smaller subhaloes are presumably also present but are devoid of stars. It is interesting to look for observable consequences of their existence. Dynamical effects, for example heating or distortion of the Galactic disc or scattering of the orbits of visible halo objects, are weak, and are dominated by the most massive subhaloes rather than by their more abundant low-mass brethren. Such effects may, nevertheless, be detectable in favourable cases (Font et al. 2001; Johnston, Spergel & Haydn 2002). It may also be possible to detect substructure in gravitational lens galaxies through the statistics of flux ratios in samples of multiply imaged quasars (Mao & Schneider 1998; Chiba 2002; Dalal & Kochanek 2002); again the effects are dominated by the few most massive subhaloes. If dark matter detection experiments are successful, it may become feasible to search for structure in the dark matter distribution at the position of Earth. Detailed analysis suggests that in a ΛCDM model the signal will be difficult, but perhaps not impossible, to see (Helmi, White & Springel 2002).
The fact that the core structure of satellite subhaloes in a ΛCDM model agrees with the kinematics of observed satellites is prima facie evidence against dark matter with modified properties, for example warm dark matter or self-interacting dark matter. In recent work, the primary motivation for considering such modifications to the microscopic physics of the dark matter particles has been to reduce the concentration of haloes and the abundance of substructure (e.g. Spergel & Steinhardt 2000; Yoshida et al. 2000; Bode et al. 2001). A significant reduction of the central concentration of satellite subhaloes in our simulations would, however, make it difficult to produce satellites with velocity dispersions as large as those observed.
References
