


Abstract
The properties of gamma ray bursts (GRBs) and their afterglows are used to investigate the location of star formation activity through the history of the Universe. This approach is motivated by the following: (i) GRBs are thought to be associated with the deaths of massive stars and so the GRB rate ought to follow the formation rate of massive stars; (ii) GRBs are the last phase of the evolution of these stars, which do not live long enough to travel far from their place of birth, and so GRBs are located where the stars formed; and (iii) GRB afterglows occur over both X ray and optical wavelengths, and so the differential effects of dust extinction between the two wavebands can reveal whether or not large amounts of dust are present in galaxies hosting GRBs. Recent evidence suggests that a significant fraction of stars in the Universe formed in galaxies that are bright at rest frame submillimetre (submm) and infrared wavelengths rather than at ultraviolet wavelengths; we estimate about three quarters of the star formation in the Universe occurred in the submm bright mode. High redshift submm selected galaxies are thought to have properties similar to local ultraluminous infrared galaxies (ULIGs) such as Arp 220, based on the concordance between their luminosities and spectral energy distributions. If this is the case, then GRBs in submm bright galaxies should have their optical afterglows extinguished by internal dust absorption, but only very few should have their  X ray afterglows obscured. The value that we quote of three quarters is marginally consistent with observations of GRBs:
  per cent of GRBs have no detected optical afterglow, whereas almost all have an X ray afterglow. A more definitive statement could be made with observations of soft X ray afterglows
  , in which extinction should be severe for GRBs located in submm bright galaxies with gas densities similar to those in local ULIGs. If the X ray afterglows disappear at soft X ray wavelengths in a large number of GRBs, then this would provide strong evidence that much of the star formation in the Universe is heavily obscured. Far infrared and submm follow up studies of the hosts of GRB would reveal this population. We expect about 20 per cent of GRB hosts to be detectable using the SCUBA camera at the James Clerk Maxwell Telescope (JCMT) after several hours of integration.
Introduction
One of the major recent achievements in extragalactic astronomy has been an estimate of the history of the cosmic star formation rate, using two types of complementary measurements. First, optical and near infrared observations can be made of distant galaxies. The rest frame ultraviolet (UV) or optical luminosities of these galaxies can then be converted into star formation rates and summed over a representative sample of galaxies in each redshift interval to derive the form of the comoving star formation rate of the Universe as a function of redshift, as is conventionally presented in the Madau plot (Lilly et al. 1996; Madau et al. 1996; see Somerville, Primack & Faber 2000 or Blain 2001 for recent compilations). Secondly, submillimetre (submm, Blain et al. 2000) and far infrared (Kawara et al. 1998; Puget et al. 1999) measurements of source counts and the extragalactic background light (Fixsen et al. 1998; Hauser et al. 1998; Schlegel, Finkbeiner & Davis 1998) can be used to infer the amount of dust enshrouded high redshift star formation activity. The redshift distribution of sources contributing to these source counts and backgrounds is poorly known; nevertheless the constraints are tight enough that reasonable progress has been made in constructing a far infrared/submm Madau plot (Blain et al. 1999b; Blain 2001).
At redshifts  the most luminous UV bright galaxies are the Lyman break galaxies, identified by the Lyman break technique of Steidel et al. (1996) and the most luminous submm galaxies are the galaxies seen by the Submillimetre Common User Bolometer Array (SCUBA) on the James Clerk Maxwell Telescope (JCMT; Smail, Ivison & Blain 1997; Barger et al. 1998; Hughes et al. 1998; Eales et al. 1999). Both the Lyman break (Steidel et al. 1999) and some SCUBA (Ivison et al. 1998, 2000) galaxies are now being studied in some detail.
The most striking conclusion from these studies are that the Lyman break and SCUBA galaxies appear to be distinct populations of objects. The Lyman break galaxies are faint at submm wavelengths (Ouchi et al. 1999; Peacock et al. 2000; Sawicki 2001), although they certainly undergo some internal dust extinction (Calzetti et al. 1997; Steidel et al. 1999). The SCUBA galaxies tend to be faint at rest frame UV wavelengths (Ivison et al. 2000; Smail et al. 2000, 2001) given their huge bolometric luminosities. Both sets of sources contain extremely luminous galaxies. In fact the 850 μm background is composed at the 50 per cent level by sources with bolometric luminosities above 1012L⊙ (Blain et al. 1999a),1 comparable to those of local ultraluminous infrared galaxies (ULIGs; Sanders & Mirabel 1996). These conclusions are perhaps suggestive of an analogy with the nearby Universe, in which the most powerful star forming galaxies are either UV bright late type giant Sc galaxies such as NGC 4603 (see Fig. 1a) or infrared bright ULIGs such as Arp 220 (see Fig. 1b), which are extremely faint at rest frame UV wavelengths (Meurer et al. 2001), presumably as a result of internal extinction.
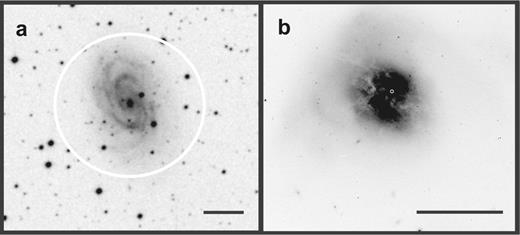
Two extreme examples of local galaxies, representing star formation happening in the UV and submm modes and the consequent effects on extinction of the radiation produced by the young stars. The bars represents 10kpc in the rest frame of the galaxy. (a) NGC 4603 (image from the Palomar Observatory Sky Survey) is a luminous Sc galaxy that is bright at UV and blue wavelengths. The circle represents the 90 per cent isophote, indicating that the star formation is occurring over the whole galaxy. (b) Arp 220 (image from Hubble Space Telescope WFPC2) is a ULIG that is very bright at far infrared wavelengths, but very faint at ultraviolet wavelengths (Meurer et al. 2001). The white dot represents the size of the far infrared emitting blackbody nucleus (Solomon et al. 1997), indicating that the star formation activity is concentrated near the centre of the galaxy. The far infrared emitting blackbody nucleus represents 90 per cent of the total bolometric emission and hence the white dot is the equivalent of the 90 per cent isophote shown in panel (a).
It is therefore plausible that the star formation in the Universe happened predominantly in two distinct modes – UV and submm. If the analogy with the nearby Universe is valid (for the SCUBA galaxies this is still speculative, as very high resolution submm maps do not yet exist), then we expect the star formation to occur either in relatively diffuse and unobscured UV bright star forming galaxies or in very compact and heavily obscured (the internal extinction to the central power source in Arp 220 is greater than 30mag; Genzel et al. 1998; Scoville et al. 1998; Shioya, Trentham & Taniguchi 2001) submm bright ULIGs.
One important remaining question is: how much of the star formation that has happened over the age of the Universe occurred in each mode? It appears that most of the energy is generated in the submm mode (Blain et al. 1999b, c). However, this does not necessarily mean that most of the star formation in the Universe is happening in this mode, because (i) the stellar initial mass function (IMF) may be high mass biased in the SCUBA galaxies (Blain et al. 1999b), resulting in more energy generation per unit mass of stars formed; (ii) there may be a substantial contribution to the energy output of SCUBA galaxies from active galactic nuclei (AGNs). Given the huge line of sight extinctions to the galaxy centres, it is not possible to determine the power sources unambiguously; and (iii) there may be considerable star formation activity in UV bright galaxies that is hidden by dust, but in which the extinction is not sufficiently great to generate SCUBA galaxies (Adelberger & Steidel 2000). What we see directly in the UV would then only be a fraction of the total star formation activity in those galaxies. Both the total amount of obscured star formation in the Lyman break galaxies and the conversion factor from UV luminosity to a star formation rate are uncertain (Pettini et al. 2001).
We now attempt to address this question by studying the extinction towards gamma ray bursts (GRBs) and their afterglows. Several arguments suggest such an approach. First, GRBs are thought to be associated with the deaths of massive stars and so their formation rate ought to trace that of the massive stars responsible for the observed UV and far infrared luminosities of both the Lyman break and SCUBA galaxies (Totani 1997; Blain & Natarajan 2000; Lamb & Reichart 2000; Ramirez Ruiz, Fenimore & Trentham 2001). Secondly, GRBs are the final phase of the evolution of these massive stars. These stars do not live long enough to travel far from their place of birth, and so GRBs should be located where the stars formed. Thirdly, GRB afterglows are seen in both the optical and X ray wavebands, and so we can hope to exploit the differential effects of extinction between the two wavebands to test whether large amounts of dust and gas are present in the galaxies hosting the GRBs. We can then infer how many of the GRBs occurred in galaxies with both moderate and considerable amounts of dust, and so are likely to be Lyman break and SCUBA galaxies, respectively.
To elucidate the total amount of obscured star formation that happened over the age of the Universe, we investigate the direct observational constraints on the UV/submm fraction of cosmic star formation in more detail in Section 2. We outline the properties of GRBs and their afterglows which make them suitable for this kind of analysis in Section 3, and in Section 4 we describe how dust might affect the emergent X ray and optical radiation from GRBs and their afterglows. The constraints on the UV/submm fraction from analysis of the extinction of GRB afterglows are presented in Section 5. We present some caveats in Section 6, and in Section 7 we summarize our results and outline future prospects. We assume  ,
,  and
and 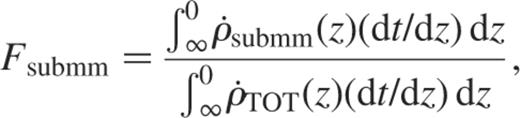 .
.
The location of cosmic star formation
A compilation of measurements of the UV star formation rate history is presented in Fig. 2 (Somerville et al. 2000), along with a model curve that shows the total (UV and submm) star formation rate history that has been derived from a fit to the far infrared and submm counts and backgrounds (Blain 2001). Because the curve is so much higher than the points, it is immediately apparent that most star formation has happened in the submm mode, subject to the caveats discussed in the last section. Given that a significant fraction of the submm wave background is originated in luminous SCUBA galaxies (Blain et al. 1999a), this suggests that most of the high mass star formation activity in the Universe is heavily obscured.
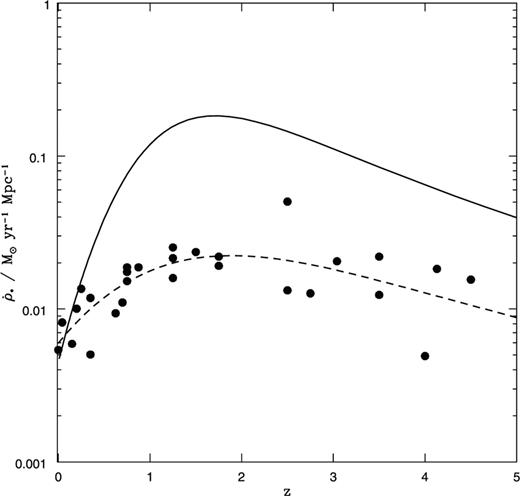
The comoving star formation rate of the Universe as a function of redshift. The points represent the optical/UV data compiled by Somerville et al. (2000) with no corrections for dust extinction; the dashed line represents a fourth order polynomial fit to this data – the UV–optical Madau plot. The solid line represents the total (UV and submm) Madau plot, from the models of Blain et al. (1999a, b) and Blain (2001), assuming no AGN contribution to the far infrared and submm backgrounds and counts. The stellar IMF of Kroupa, Tout & Gilmore (1993) is assumed.
To investigate this in more detail we now compute Fsubmm, the fraction of the total star formation activity over the age of the Universe that has taken place in the submm mode, and compare with the fraction of GRBs for which afterglows might have been expected to be extinguished by an amount greater than the average line of sight optical depth to a star forming in a SCUBA galaxy. We define

where
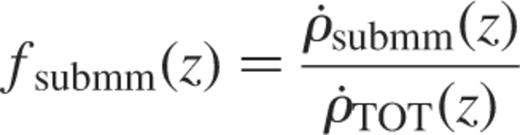
is shown by the solid line in Fig. 2, while ρ˙UV is shown by the dashed line. Here t(z) is the age–redshift relation, determined by the adopted cosmology. In order to evaluate this integral, we need to derive the instantaneous submm fraction
as a function of redshift.
We can compute ƒsubmm(z) in two different ways, both shown in Fig. 3. First, in Method A, we simply evaluate the ratio  from Fig. 2. Secondly, in Method B, we assume that all the star formation activity in objects above some threshold far infrared luminosity LFIR,c is obscured and occurs in the submm mode, whereas at luminosities less than the threshold, all the star formation activity is unobscured and visible in the UV mode. This assumption is motivated by the observation (Rieke & Lebofsky 1986) that for low redshift galaxies, the blue luminosity is proportional to the far infrared luminosity for luminosities below some critical value
 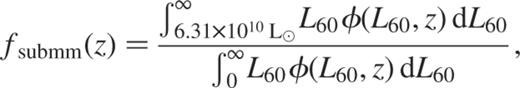 in terms of the 60 μm luminosity L60). If we assume that this value does not depend on redshift, then
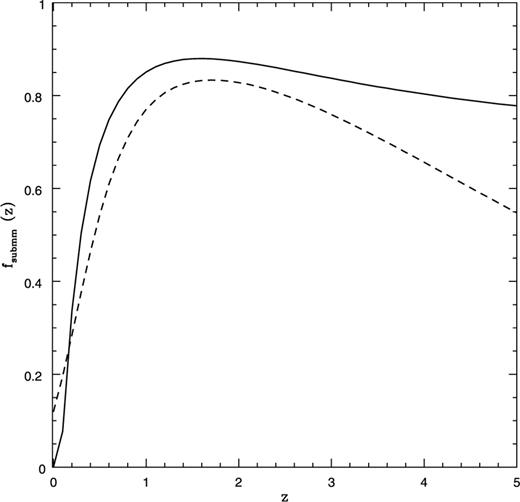
The instantaneous submm fraction as a function of redshift ƒsubmm(z) computed as described in the text by method A (solid line) or method B (dashed line).

where (Blain 2001)


and  , as for the local Universe (Saunders et al. 1990, adapted to our cosmology).
The computed values of ƒsubmm(z) are presented in Fig. 3. The methods agree reasonably well, except at high redshift where the data is rather sparse and uncertain, and so the models of ρ˙TOT(z) are poorly constrained.
The global submm fractions Fsubmm are then  (method A) or
  (method B). This quantifies a statement we made earlier: about three quarters of the star formation in the Universe happened in the submm mode.
As the interpretation of the rest of this paper depends on the accuracy of this statement, it is worth examining the caveats we listed in the previous section in some detail.
- (i)IMF dependence. If the IMF is high mass biased in the SCUBA galaxies, we need to multiply Fsubmm byto get the total fraction by mass of the stars in the local Universe that formed in the submm mode, where(9)
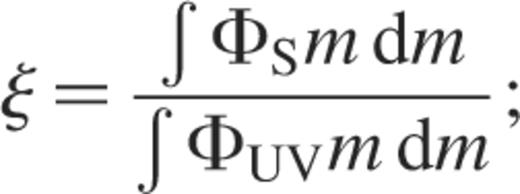 ΦS is the IMF of stars forming in a SCUBA galaxy and ΦUV is the IMF of stars forming in a UV bright galaxy. If ΦS is truncated at lower masses ζ can be significantly less than 1. In this work, however, we are concerned with Fsubmm and not ζFsubmm because GRBs are expected to be generated only by the highest mass stars.(10)
- (ii)
AGN dependence. If the SCUBA sources are powered predominantly by AGN, then our derived value of Fsubmm should be multiplied by a factor
 , where ƒAGN is the luminosity weighted AGN fraction.
 - (iii)
The star formation rates in UV bright galaxies could be underestimated because either the UV luminosity to star formation rate conversion factor assumed is too large or the UV luminosities are underestimated as a result of internal absorption in the galaxies, as even small amounts of dust can have appreciable signatures at UV wavelengths. It is conventional to make corrections for this latter effect using an empirical extinction law (Calzetti et al. 1997). However, recent near infrared observations (Pettini et al. 2001) suggest that the star formation rate derived from the Hβ line can be close to that derived from the UV luminosity with no correction for extinction.
γ ray bursts and massive stars
Until recently, GRBs were devoid of observable traces at other wavelengths. Measurement and localization of fading X ray signals from some GRBs has now led to the detection of optical and radio afterglows, and enabled the measurement of redshifts and the identification of host galaxies. The bursts with known redshifts (in the range  are brightenough to be detectable out to much larger distances than those of the most luminous quasars. An example of this was the discovery (Akerlof et al. 1999) of a prompt, extremely bright
  , optical flash 50s after GRB 990123 started at
  . However, such bright and prompt optical flashes may be very rare, because they have not yet been detected in another burst. Within the first minutes to hours after the burst, optical light from the afterglows of bursts normally has
 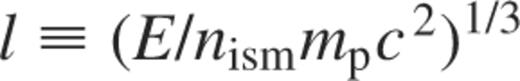 .
.
One can understand the dynamics of the afterglows of GRB in a fairly simple manner, independent of any uncertainties about the progenitor systems, from the relativistic generalization of the method used to describe supernova remnants. The basic model for GRB afterglow hydrodynamics is a relativistic blast wave expanding into the surrounding medium (Rees & Mészáros 1994; Sari & Piran 1995; Sari, Piran & Narayan 1996; Mészáros & Rees 1997). External shocks arise from the interaction of the shell with the surrounding matter. The typical scale is the Sedov length,  . The rest mass energy E within a sphere of radius l equals the energy of the shell. Typically
  . The relativistic external shocks convert a significant fraction of their kinetic energy into radiation at

the radius at which the external mass of ISM encountered equals γ−1 of the mass of the shell.
The most widely discussed models of the central engine of GRBs involve either the cataclysmic collapse of a massive star in a very energetic hypernova like explosion (Paczyński 1998; MacFadyen & Woosley 1999; McFayden, Woosley & Heger 2001), or the coalescence of two compact objects such as black holes or neutron stars (Lattimer & Schramm 1976).2 The former are expected to occur near to or within star forming regions of their host galaxies, while most of the latter are expected to occur outside the galaxies in which they were born.
For the long duration GRB afterglows localised so far, the host galaxies show signs of the ongoing star formation activity necessary for the presence of young, massive progenitor stars (e.g. Paczyński 1998; Fruchter et al. 1999). Castander & Lamb (1998) showed that the light from the host galaxy of GRB 970228, the first burst for which an afterglow was detected, is very blue. Subsequent analyses of the colour of this (Castander & Lamb 1999) and other host galaxies (Kulkarni et al. 1998; Fruchter 1999) have strengthened this conclusion, as has the detection of [Oii] and Lyα emission lines from several other host galaxies (see Bloom et al. 1998; Kulkarni et al. 1999). X ray spectral edges and resonance absorption lines are expected to be detectable in the immediate environment of the GRB, in particular from the remnants of massive progenitor stellar systems (Mészáros & Rees 1998). Observations with the BeppoSAX and Chandra X ray spectrographic cameras have provided tentative evidence for iron line and edge features in the spectrum of at least two bursts (GRB 991216, Piro et al. 2000; GRB990705, Amati et al. 2000). One possible explanation of the iron lines is that X rays from the afterglow illuminated an iron enriched supernova remnant, produced days or weeks before the burst by the same progenitor, leading to iron recombination line emission (Vietri et al. 2000; but see Rees & Mészáros 2000 for an alternative explanation involving continued decaying X ray emission from the GRB outflow impacting on the stellar envelope following core collapse). There is independent evidence that suggests that, at least in some bursts, a supernova may be the origin of a red component, a factor of about 60 times brighter in flux than the extrapolated afterglow, detected several weeks after the burst (GRB980326, Bloom et al. 1999; GRB970228, Reichart 1999). The presence of iron line features would strongly suggest a massive stellar progenitor; however, the exact nature of the central engine and the progenitor depend on the details of the models, as we are not able to observe them directly.
These associations provide indirect evidence that long duration GRBs and their afterglows are produced by highly relativistic jets emitted in core collapse explosions. In this context, high redshift GRBs could become invaluable probes of the history of high mass star formation and galaxy evolution (Blain & Natarajan 2000; Lamb & Reichart 2000). Because γ rays are not attenuated by intervening dust and gas, the selection of cosmic sites of massive star formation by this method is unlikely to be affected by the biases associated with dust absorption.
Extinction of GRB afterglows
Because GRBs represent the final phase of the evolution of very massive stars which do not live long enough to leave their birth place, a large fraction are likely to be still enshrouded in their placental clouds of molecular gas and dust. This environment will attenuate the GRB afterglow radiation at X ray and optical wavelengths. As we expect the molecular clouds and dust to be more prevalent in submm galaxies than in UV ones, we expect the afterglows originating in the submm galaxies to be more attenuated.
Optical extinction
Dust that is associated with a column density NH of cold gas extinguishes V band optical radiation by an amount

if external galaxies have dust to gas ratios similar to that of the Milky Way (Predehl & Schmitt 1995).
The line of sight extinction to a GRB is, however, complicated by local physical processes. For example, optical/UV/X ray radiation from the GRB may heat and sublime nearby dust (Waxman & Draine 2000), or winds from the GRB progenitor may tunnel a hole through the surrounding medium. A slowly varying near and mid infrared emission should be detectable from the dust reprocessed in the vicinity of the GRB (Venemans & Blain 2001), especially if the GRB emission is isotropic. Both processes would partially allow the escape of optical photons which would otherwise be extinguished. Such processes are probably important as (i) the observed optical absorption is  times less than that inferred from the corresponding X ray absorption, and (ii) the standard afterglow model fits to the data seems to indicate an ambient gas density that is generally lower than that expected in star forming clouds (Galama & Wijers 2001). The result is that optical afterglows could be visible at distances far from the GRB in the absence of further extinction.
In ULIGs, however, there is expected to be very substantial further extinction along most lines of sight. There can be up to tens of magnitudes of extinction, maybe more, to the centre of ULIGs at optical wavelengths, as shown in Fig. 4 for the case of Arp 220, where considerable amounts of dust are certainly present.
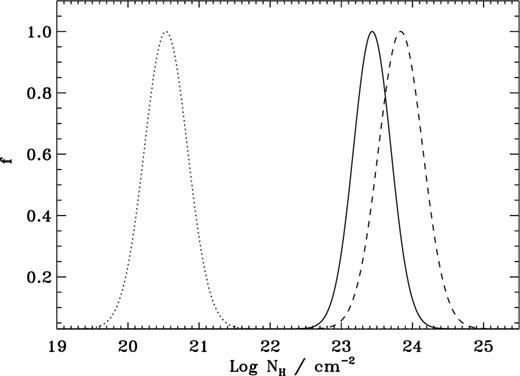
Distributions (normalized to unity at the peak) of column densities of lines of sight towards stars forming in an idealised compact spherical gas cloud with the mass and size of the infrared source in Arp 220 (see Fig. 1b; Solomon et al. 1997). The solid and dashed lines represent distributions for two different density distributions of stars, gas, and dust  within the cloud, with
  and 2 respectively. The much lower Galactic column density distribution for the sample of observed bursts without optical afterglows (Lazzati et al. 2001) are represented by the dotted line.
This cumulative extinction is due to the large amounts of dust along our line of sight and differs fundamentally from the extinction removed by the sublimation of dust, which is essentially a local phenomenon. The X rays from the GRB are unable to destroy the dust responsible for the bulk of the extinction in ULIGs, because the X ray/UV flux ∼d−2, so dust grains at ≫10pc from the GRB are unaffected (Waxman & Draine 2000).
High energy extinction
The X ray radiation transmitted through high atomic column densities is modified significantly by both absorption and Compton scattering. To study the effects we consider a homogeneous spherical cloud of cold material surrounding a central source of X ray photons. We use the Monte Carlo code constructed by Wilman & Fabian (1999), which computes the transmission through a sphere with a radius set by the column density NH. Both photoelectric absorption by neutral material (of solar composition) and Compton down scattering are modelled, the latter being described by the Klein–Nishina cross section, with elastic scattering enhancing the photoelectric absorption probability (see Madau et al. 1993). The downscattering of X ray photons by cold electrons modifies the transmitted spectrum above an energy  . The results of some Monte Carlo calculations are shown in Fig. 5, where an incident power law spectrum with photon index 2.5 is seen in transmission through clouds of different column density NH. Only
  per cent of the power incident in the range
  directly escapes from a medium with
  the range of optical depths
  corresponds to
  . This percentage progressively increases in the γ ray region as a result of the Klein–Nishina reduction of the Compton cross section at high energies.
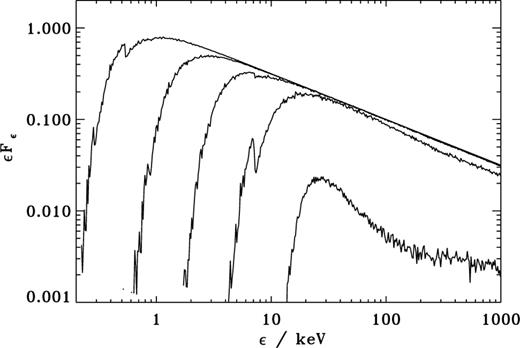
The flux that would be received by the observer (in arbitrary units) for a power law background source with photon index 2.5 (GRB 980519; Nicastro et al. 1999) through increasing column density (from left to right)  , 1022, 1023, 1024 and 1025cm−2. The effects of both Compton downscattering and photoelectric absorption have been included. Solar metallicity is assumed.
Observational constraints
Optical emission
About three quarters of the star formation in the Universe appears to be heavily obscured (see Section 2). If the SCUBA galaxies are high redshift counterparts of the ULIGs, and are powered mainly by star formation, then one would expect three quarters of GRBs to have no optical afterglows.
The optical observations of GRB afterglows are marginally consistent with this picture. Optical afterglows have been detected for about one third of the well and rapidly localized GRBs. Most of these bursts, however, were observed with different telescopes, at various times and in different filters. Among the 31 X ray afterglows detected by the WFC of BeppoSAX, excluding GRB 980425 and X ray transients,  per cent had no optical counterparts. Lazzati, Covino & Ghisellini (2001) demonstrate that this is due neither to adverse observing conditions nor delays in performing the observations. Some limitations are necessarily inherent in their approach and selection of data. Nevertheless, recent studies using different burst samples give similar results: Reichart & Yost (2001) find that
  of all bursts (95 per cent of all ‘failed’ optical afterglows preceding GRB 000630) have no optical counterpart down to
  while Djorgovski et al. (2001) show that the maximum fraction of optical afterglows hidden by dust is of the order of
  .
.
Lazzati et al. (2001) also find that X ray transients with no optical counterparts are not affected by unusually large Galactic absorbing columns. They conclude that a minimum absorption of 2mag in the R band is required for more than half of the bursts.3 This is much less that the line of sight extinction expected in ULIGs (Fig. 4), but more than would be expected for a GRB embedded in the Orion Nebula.
The non detection of afterglows at optical/infrared wavelengths would provide interesting insight into the location of obscured star formation. If the number of bursts with no optical afterglows is much less than three quarters, this could mean that these GRBs did not occur in heavily optically thick molecular cores like those observed in ULIGs such as Arp 220 (see Section 6 for further discussion).
X ray and γ ray emission
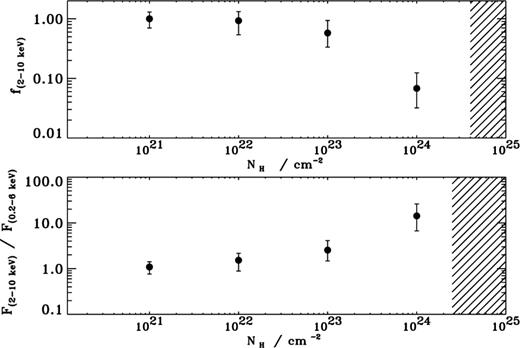
X ray afterglows were observed in almost all the bursts detected by the WFC of BeppoSAX (Lazzati et al. 2001). Even for extreme submm galaxies like Arp 220, the obscuring column densities are not high enough (Fig. 4) to completely extinguish the hard X ray fluxes, and so Fsubmm equal to three quarters is consistent with these observations as well.
These results imply that even if GRBs are located in the most absorbed regions of SCUBA galaxies, then the corresponding absorption is not enough to hide their X ray afterglows. At these sorts of column densities, however, we expect the ratio between the BeppoSAX LECS  and MECS
  for bursts with non detected optical afterglows to be affected (Fig. 6), with the soft X rays being considerably more attenuated than the hard ones.
Effects of absorption at X ray wavelengths. The upper panel shows the fraction of intrinsic flux expected in the BeppoSAX High Energy Channel  for a source with a power law spectrum of photon index 2.5 seen through obscuring material of column density NH. The lower panel shows the expected ratio of the emergent flux in the BeppoSAX Low Energy Channel
  to the flux in the High Energy Channel
  as a function of NH. Solar metallicity is assumed. The shaded area corresponds to complete attenuation.
Column densities of the order of 1023.5cm−2 or higher are required for noticeable effects on the X ray spectrum; this corresponds to the average line of sight extinction to the core of Arp 220. The transmitted spectra in the  energy range would be almost completely extinguished; measurements in this energy interval are therefore particularly important to probe the global column density of the parent galaxy.
Interestingly, the X ray and γ ray properties of X ray transients with no optical counterpart are not systematically different from those with an optical detection, indicating that they are indeed intrinsically optically faint (Fynbo et al. 2001; Lazzati et al. 2001). Based on the BATSE Hardness Ratio (hereafter HR, defined as the ratio of the fluence at  and the fluence at
  derived by Fynbo et al. (2001) for the GRB with non detected afterglows, we estimate that the line of sight column densities for these bursts are characteristically below 1023.5cm−2, but greater than 1022cm−2. These results assume that the sources are located at
  and have a power law spectrum. The column densities derived here are much greater than those typically found in star forming clouds, but generally less than would be expected for a GRB deeply embedded in the core of Arp 220. This analysis agrees with the idea that the absence of optical detections is most likely the result of circumburst extinction. The density of the burst medium probably spans many orders of magnitude from densities as low as the ones found in typical star forming clouds to densities as high as the ones found in the core of Arp 220.
Very high energy emission
If the column density of the parent galaxy is greater than 1025cm−2 in any significant fraction of the SCUBA sources, then we expect the GRB spectra to peak at very high energies (Fig. 6).
GRBs are typically identified by sharp increases in the count rates in the  band. Although some of these bursts have been observed up to very high energies (e.g., Atkins et al. 2000), concerns have been voiced that a whole class of very hard bursts may have been missed because of the use of the X ray band for identifying GRBs (e.g. Piran & Narayan 1996). If the current detection strategy discriminates against bursts with harder than average spectra, then there may exist GRBs that emit strongly at energies greater than 1MeV, but whose emission near 100keV falls below the detection threshold. The data show very small numbers of hard bursts, e.g. only five bursts out of the 136 in the Cohen, Piran & Narayan (1998) sample are harder than 1MeV. Nevertheless, this does not mean that there are fewer GRBs above 1MeV, because harder bursts have fewer photons and thus the decrease of BATSE sensitivity above 300keV makes their detection very difficult (Cohen et al. 1998). The existence of a large population of unobserved hard gamma ray bursts is still an open question. Harris & Share (1998) used data from the Solar Maximum Mission Gamma Ray Spectrometer to show that there is a deficiency of GRBs with hardness above 3MeV, relative to those peaking at ∼0.5MeV, but these data are consistent with a population of hardness that extends up to 2MeV. If SCUBA galaxies with column densities greater than 1025cm−2 exist in large numbers, then a large population of unobserved hard gamma ray bursts may exist. These bursts can be used to detect a putative population of highly obscured galaxies.
Caveats
A number of caveats apply to our analysis.
Massive stars and GRB formation
In the previous sections we have assumed that the underlying physics which turns a massive star into a GRB is the same for stars forming in both the UV and submm modes. This may be incorrect for various reasons.
Quantitative insight into the formation of GRBs is hindered by the lack of detailed core collapse calculations. However, the insightful work of MacFadyen & Woosley (1999) suggests that GRBs can occur in stars with a range of radii. The radii depend on the evolutionary state of the massive progenitor, its binarity, rotation, and more importantly metallicity (MacFadyen & Woosley 1999; Heger, Langer & Woosley 2000). A picture in which stars produced in the submm mode are more metal rich than those in the UV mode would lead to an overestimate of Fsubmm via GRBs, because low metallicity raises the mass threshold for the removal of the hydrogen envelope by stellar winds, thus increasing the mass of the heaviest helium core and favouring black hole formation (Maeder 1991; MacFadyen & Woosley 1999; Maeder & Meynet 2000). In the local Universe, UV bright star forming galaxies tend to have very low metallicities (e.g. I Zw 18; Hunter & Thronson 1995) relative to submm bright ULIGs (Sanders & Mirabel 1996). The same may be true at high redshift, with stars in submm bright galaxies probably forming at higher densities than the stars in UV bright galaxies, which may also affect the evolutionary state of the progenitors to GRBs. One expects various outcomes ranging from GRBs with large energies and durations, to asymmetric, energetic supernovae with weak GRBs. Observations of the medium surrounding a GRB would distinguish naturally between different stellar explosions (Chevalier & Li 1999; Ramirez Ruiz et al. 2001).
Extinction in the UV mode
In the previous sections we have assumed that the sources of UV star formation are not highly obscured and therefore that the afterglows of GRBs in this mode are not likely to be attenuated. However, there may be patches of dust which could attenuate optical but not X ray afterglows, if their column densities are between 1021 and 1023cm−2. Such patches would need to have greater column densities than lines of sight through the Orion Nebula (Lazzati et al. 2001), but less than those through Arp 220. This implies that GRBs in UV bright galaxies could also be attenuated by dust, biasing our estimate of Fsubmm too high.
If all GRBs ultimately turn out to have optical afterglows, and Fsubmm is intrinsically low, then this concern is no longer valid. We will then also learn that there is not a large amount of local extinction in UV bright galaxies. Such a possibility is suggested by the approximate concordance between the shape of the UV Madau plot at  and the GRB rate derived using the luminosity–variability relation (Ramirez Ruiz et al. 2001).
AGN fraction
It is worth examining the assertion that the submm bright sources are powered by star formation rather than dust enshrouded AGNs. The arguments in favour of star formation as the dominant power source are:
- (i)
The radio luminosities of the SCUBA sources (Smail et al. 2000) are not large and are consistent with having been produced by supernova remnants.
- (ii)
Radiative transfer modelling (Rowan Robinson 2000 and references therein) suggests that most of the far infrared radiation emerging longward of 50μm in the rest frame, at which the bulk of the energy from the SCUBA sources emerges, originates from star formation as opposed to an AGN. However, the uncertain and probably complex geometry of the SCUBA galaxies could complicate this interpretation.
- (iii)
Most luminous SCUBA sources are not luminous X ray sources and so are consistent with being starburst powered. This deduction is, however, not conclusive. Hard X ray observations can uncover the presence of a dominant AGN power source in even highly obscured sources, and hence provide a simple estimate of the AGN fraction in the submm mode (Bautz et al. 2000; Fabian et al. 2000). Unfortunately, even for high redshift sources Chandra provides a relatively poor hard X ray response, and so these X ray studies have so far only confirmed the presence of modestly obscured AGN in two galaxies already confirmed to contain AGN from optical spectroscopy.
The primary argument against star formation as the dominant power source is that any stars produced in the SCUBA galaxies need to disappear by the present epoch, as only a negligible fraction (about 1 per cent; Trentham 2001) of the stars in the local Universe are found at the high densities observed in ULIGs and thought to exist in the SCUBA galaxies  . AGNs then become an attractive alternative because super massive black holes exist in just the right number to have been produced in the SCUBA galaxies, given the energy output from these galaxies: see both table 2 and the accompanying discussion in Trentham & Blain (2001).
Stellar IMF
The precise form of the IMF in starburst galaxies is very much an open question. Some indirect observations that guide us to believe that the IMF in the local ULIGs could be high mass biased (e.g. Goldader et al. 1997). If the analogy between these objects and high redshift submm galaxies is valid, then the IMF could also be biased in the high redshift galaxies, leading to an overestimate of Fsubmm in Section 2.
Another important issue is the relative shapes of the very high mass end of the IMF in submm and UV bright galaxies, as very high mass stars are thought to produce GRBs. Any difference of this type could strongly affect a comparison of Fsubmm with the fraction of GRBs without afterglows. A strong difference of this type, however, is unlikely in the nearby Universe, as the radio–far infrared correlation (Condon, Frayer & Broderick 1991) holds over a large range of galaxy luminosity and the very high mass stars are the ones responsible for generating the far infrared radiation. First indications (Frayer et al. 1998, 1999; Ivison et al. 1998, 2000) are that the few high redshift SCUBA sources that have been studied in detail lie close to the low redshift radio–far infrared correlation.
Alternative causes of non detection of optical afterglows
We have assumed that dust obscuration is the most likely reason for the non detection of optical transients. However, there are other possible explanations:
- (i)
Bursts with and without afterglows are intrinsically different – bursts of a given γ ray luminosity could be either optically bright or faint (Fynbo et al. 2001; Lazzati et al. 2001).
- (ii)
The absence of detectable optical flux accompanying strong X ray emission in the
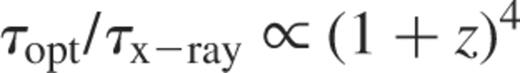 BeppoSAX energy band may simply be due to the strong redshift dependence of dust obscuration at optical wavelengths in comparison to the X rays, i.e.
 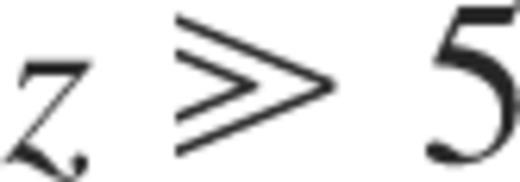 (Taylor et al. 1998).
 - (iii)
A large fraction of GRBs occur at
 and so are optically invisible as a result of Lyman α absorption by intervening systems (Fynbo et al. 2001; Lazzati et al. 2001). However, using the sample of BATSE bursts without optical afterglows for which high resolution light curves are available, we can estimate the redshifts using the variability–luminosity relation derived by Fenimore & Ramirez Ruiz (2001) for long duration GRBs; all are less than five.
Summary and future prospects
In summary, we expect about three quarters of the star formation in the Universe to have occurred in submm bright as opposed to UV bright galaxies. High redshift submm galaxies (the SCUBA galaxies) are thought to have properties similar to local ULIGs, based on the concordance between their luminosities and spectral energy distributions. If this is the case, we expect that GRBs in submm bright galaxies should typically have their optical afterglows absorbed by internal dust extinction, but only very few should have had their 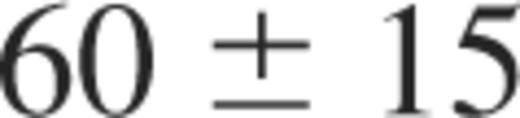 X ray afterglows completely extinguished.
The value of three quarters that we quote is marginally consistent with observations of GRBs: 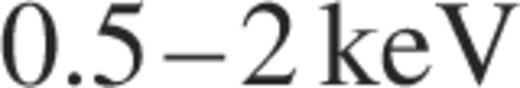 per cent of GRBs have no detected optical afterglow, although almost all have an X ray afterglow.
A more definitive statement could be made with detailed observations of soft X ray afterglows (e.g. HETE 2 and Swift). This is because we expect X ray afterglows to be extinguished in the  , but not at harder X ray bands (Fig. 5). If X ray afterglows of a large number of GRBs disappear, then this would provide strong evidence that much of the star formation activity in the Universe happened in a heavily obscured submm mode.
The detection of afterglows at soft X ray wavelengths would then provide interesting insight into the location of cosmic star formation. This could mean that our value of three quarters is too high, perhaps because ƒAGN is significant, or one of the other caveats discussed in Section 6 is important. Alternatively, it might mean that star formation in submm bright galaxies does not occur in very compact regions, and so the analogy with local ULIGs is incorrect – the luminosity and spectral energy distribution concordance would then be just a coincidence. This would also resolve a problem discussed in Section 6.3 – if stars form in submm bright galaxies away from very compact regions, then most of the stars in the local Universe could form in this way, and not just the 1 per cent with high densities in elliptical galaxy cores. Looking for high density molecular tracers like CS and HCN in high redshift submm bright galaxies would be one way to test the connection hypothesis (Trentham 2001). However, such measurements would be difficult.
If GRB afterglow and submm source positions can be correlated, then this would provide a direct way to probe the nature of high mass star formation (Mirabel, Sanders & Le Floch 2001). At present, we expect about 20 per cent of GRB host galaxies to exceed the 2 mJy 850 μm detection threshold of the SCUBA camera at the JCMT if the GRB rate follows the cosmic star formation rate (Fig. 7). An important caveat is that most detected X ray afterglows had error boxes of a few square arcmin, a region large enough to contain from tens up to a few hundred galaxies. Therefore it is very difficult to identify the host galaxy unambigously without detections of optical, infrared, radio or Chandra X ray afterglows.
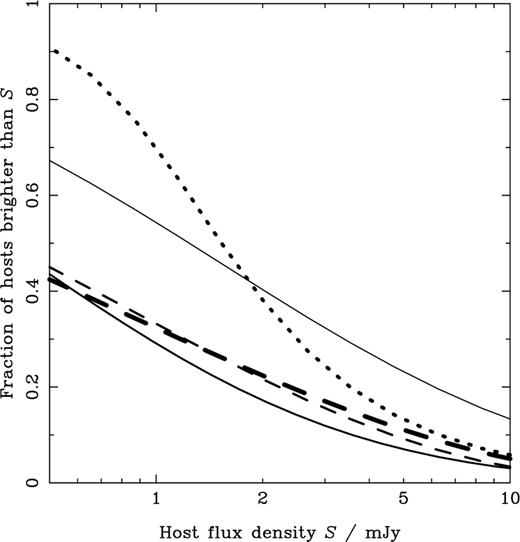
The predicted fraction of submm luminous host galaxies of GRBs that exceed a certain threshold in 850 μm flux density based on five different models of the star formation history, that fit the results of far infrared and submm observations. The thin solid and dashed lines show the results of Blain et al. (1999b, c) respectively. The thick solid and dashed lines show the equivalent updated results described in Blain (2001). The dotted line shows the result of Barger, Cowie & Sanders (1999). The Blain (2001) results are likely to be most reliable, and indicate that of order of 20 per cent of GRB host galaxies might be expected to exceed the 2 mJy 850 μm detection threshold of the SCUBA camera at the JCMT, which can be achieved in several hours of integration in photometry mode. The future ALMA interferometer array will be able to make such detections, and to produce sub arcsecond resolution images of the hosts in a few seconds of integration.
Studies of the galaxy hosts of the GRBs detected with the next generation of γ ray observatories (e.g. HETE 2 and Swift) with submm and infrared telescopes (e.g. SIRTF, NGST, ALMA and FIRST Herschel), would reveal whether or not most of the high mass star formation activity in the Universe is heavily obscured.
Acknowledgments
We thank D. Lazzati, M. Rees, A. Merloni, E. Rossi, I. Smail, N. Tanvir and A. Emmanouil for useful comments and suggestions. We are particularly grateful to R. Wilman for useful insight regarding the Monte Carlo calculations. We thank I. Smail, R. Ivison and M. Pettini for providing the images. We thank J. Greiner for maintaining the GRB web archive. ERR acknowledges support from CONACYT, SEP and the ORS foundation. AWB thanks the Raymond & Beverly Sackler Foundation for support.
References
Luminosities corresponding to 850 μm flux densities of 1mJy or greater.
The formation of a black hole with a debris torus around it is a crucial ingredient of both these scenarios. The binding energy of the orbiting debris and the spin energy of the black hole are the two main energy reservoirs available, with the total extractable energy being up to 1054erg (Rees 1999).
To convert dust absorption values from a wavelength to a different one, Lazzati et al. (2001) use the analytic approximation for the dust extinction curve given in Cardelli, Clayton & Mathis (1989), assuming that the bursts are at 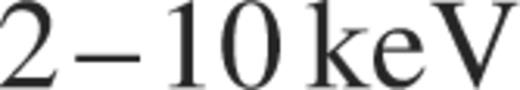 , close to the average value of the detected afterglows.
