
Abstract
We report on a comprehensive method for analyzing landslide stability and the mitigation effect of countermeasures in this paper. The proposed method is a combination of theoretical method and numerical method. To address the uncertainties of the soil strength parameters, the rational values of these parameters are comprehensively determined by the back-analysis result of the reliability method and the result by the quantitative method, as well as the in-situ geological test. To evaluate the slope stability, the limit analysis using the 2D upper bound method and the FEM simulation using strength reduction method are performed, respectively. In order to illustrate the presented method, the so-called Lanmuxi landslide in China is selected as a case study. Results demonstrated that the stress and strain majorly concentrated at the toe and crown of the slope. According to the analysis results, countermeasures consisting of anchor lattice beams, landslide piles, and cracks filling, are suggested to reduce the failure risk of the landslide. Effect assessment based on the FEM analysis verifies the feasibility and effectiveness of the recommended countermeasures.
Introduction
Landslides are a common geological phenomenon in mountainous regions worldwide, posing a severe risk to local infrastructures. During the years from 2004 to 2010, 2620 fatal landslides in total were recorded, causing 32,322 fatalities1. To protect residents and infrastructures against landslides, a rational design of countermeasures is necessary. The commonly used countermeasures include supporting measures and drainage measures2. Current studies in landslide hazard mitigation mainly focus on the overall design principles, structure optimization, and the mitigation effect evaluation. However, it is widely accepted that an effective countermeasure against landslide depends on the deep understanding of landslide mechanisms and rational analysis of landslide stability, which remain a scientific challenge.
Up-to-date studies on landslides can be briefly summarized in several categories, e.g., landslide mechanisms3,4,5, failure behaviour simulation6,7,8,9, sensitivity analysis10,11,12, as well as countermeasure design and optimization13,14. These studies have underlaid a solid theoretical foundation for landslide mitigation work.
The studies on the landslide mechanisms provide a fundamental understanding of the landslide process. Previous studies15,16,17 have long proposed various failure models of landslides. These remarkable studies also substantiated the key factors dominating the landslide process, e.g., topography, material strength3,18, as well as some other triggering factors, e.g., rainfall precipitation and earthquakes19,20. These studies explore important features of landslide process and benefit the practical work.
Most studies regarding landslide mechanisms are commonly empirically or semi-empirically based. However, a physical and quantitative analysis of the landslide process is required, because slope stability, as well as magnitude and possible runout extension are the key parameters to the countermeasure design. In this context, some attempts have been made to evaluate slope stability. In order to reproduce the landslides process, it is essential to determine the key parameters of landslides, cohesion strength c, and internal friction angle φ. The two parameters are mainly based on the in-situ test, engineering experience analogy, and back analysis21 at present. Being an efficient solution to determine the key parameters, the back-analysis method can be briefly summarized into two categories, the deterministic method22,23 and reliability method24,25,26,27,28. Previous studies22 also support that the back-analysis provides reliable results approximating the expected shear strength parameters.
In order to estimate the potential risk of slope failure, the potential magnitude and runout extension should be estimated. It is a major issue and a complex task for landslide mitigation work. Numerical simulation provides an alternative solution for this purpose. Several models have been developed and applied to practical work. They use the discontinuous deformation analysis (DDA) method29,30,31, the finite element method (FEM)32,33, the discrete element method (DEM)34,35, the smoothed particle hydrodynamics method (SPH)7,9, to analyse the stability and simulate the failure process of the landslide. Some other studies also incorporate hydraulically based models to simulate landslide behaviour, such as DDA-SPH coupled method36 and shallow water assumption-based model37. However, difficulties remain in the measurement of related parameters in these numerical models. Owing to the significant individual differences from case to case, as well as the temporal and spatial variation, some important parameters are difficult to determine, requiring trial-and-error adjusting during simulation38. In this sense, a comprehensive analysis of landslide stability and failure process simulation remains a major topic.
In this paper, we report on a comprehensive method for analysing landslide stability and its failure process. Two essential issues are discussed, i.e., comprehensive estimation of soil strength parameters using the back-analysis results using the reliability method, and the evaluation of the slope stability using the limit analysis and the FEM simulation. The so-called Lanmuxi landslide in China is selected as a case study to illustrate the presented method.
Methods
Back analysis of key parameters
In this paper, we first use reliability theory to back analyse the shearing strength parameters. Back analysis is an effective method for determining landslide parameters. For landslide mitigation work, the safety factor Fs is commonly used as an indicator for the stability. The slope is likely to fail when Fs ≤ 1, while is under a limit state when Fs = 1. In the reliability method, the function equation is incorporated to represent the limit state of the slope. The function is as below,
where X1, X2, X3, …, Xn denotes random variables regarding to slope stability. In our study, only two parameters, the cohesion c and friction angle φ are considered and assumed as random variables. Slope stability can be quantitated by the value of Z. Z < 0 denotes that the slope is at risk of failure, while Z = 0 represents that the slope stays in the limit state. When Z > 0, the slope keeps stable. Another key parameter in reliability theory is the slope reliability index β, which refers to the probability of a slope that completes the pre-determined function under the specified condition and time. Based on previous studies39, the reliability index β can be expressed as:
where μi denotes the averaged value, and σi represents the standard deviation of the variable. The failure model is established based on the limit state (Z = 0) in the back-analysis of parameters using the reliability method. The final back-analysis result is determined according to the minimum reliability index β 40, which means, the key parameters Xi are iteratively solved until a minimum β is obtained.
The spreadsheet-based method41,42 is used to solve the key parameters Xi. The reliability index β is expressed as the forms of Hasofer-Lind’s reliability index43,
where X denotes random variables, μ is the averaged value of the random variables, Cx is the covariance matrix of variables, F is the failure domain. Equations (1,3) can be iteratively solved according to the optimization algorithm. Compared with the traditional deterministic back analysis method, reliability method generates better results because the effect of the uncertainties in the landslide parameters can be considered.
Stability analysis based on the 2D upper bound (UB) theory
Presently, the majority of slope stability analyses evaluate a safety factor using a 2D representation of the slope, while 3D analyses of slope stability are much less reported44,45. It can be explained in part by the fact that a 3D model is likely to introduce a much larger number of degrees-of-freedom, which demands significantly more computational time and effort than the 2D model46. Meanwhile, in the 3D model, the failure surface does not only cross weak soil layers, but also strong ones with uncertainties, consequently increases the calculated factor of safety, e.g., 14% to 18% increasement by Reyes and Parra47 and 13.9% by Xie48, compared with the minimum factor of safety in the 2D model. In a word, the 2D analysis could lead to more conservative results than the 3D analysis in slope stability problems.
A primary concern in the practice of landslide mitigation is safety. For this consideration, we use the 2D upper bound (UB) limit analysis (LA) method to evaluate a conservative slope stability in this paper. The UB method is an energy-based method, using the principle of virtual work49,50. According to the virtual work equations, the internal work of the slope should be equal to its external work (i.e., Dint = Wext) in the limit state. A kinematically admissible velocity field51 is presented for calculating the virtual work. The velocity formula can be described as follows,
where vi and vi−1 are the virtual velocities of a slice on the sliding surface. [v]i−1,i represents the relative velocity that defined as the vector difference from vi to vi−1. It should be noticed that vi, vi−1 and [v]i−1,i satisfy the closure relations. φi and φi−1 are the internal friction angles of the neighboured slice, respectively. [φ]i−1,i denotes the relative internal friction angle in the vertical direction of slices. αi and αi−1 are the inclined angles. Therefore, the UB solution of the safety factor can be calculated by the following equation:
where φf = arctan(tanφ/Fs). li is the sliding surface length of the slice i. Pw and U represent the external pressure arisen by pore water. Pw can be calculated by \({P}_{w}=\frac{1}{2}{\rho }_{w}{Z}_{w}\), where Pw denotes the density of water and the Zw represents the depth of pore water. U is obtained by constructing the equilibrium equation with Wi and αi, at vertical direction. Wi is the gravity of the slice i. [h]i−1,i is the length of the interface between the slice i and the slice i-1. Equations (4–6) can be further explained by Fig. 1.
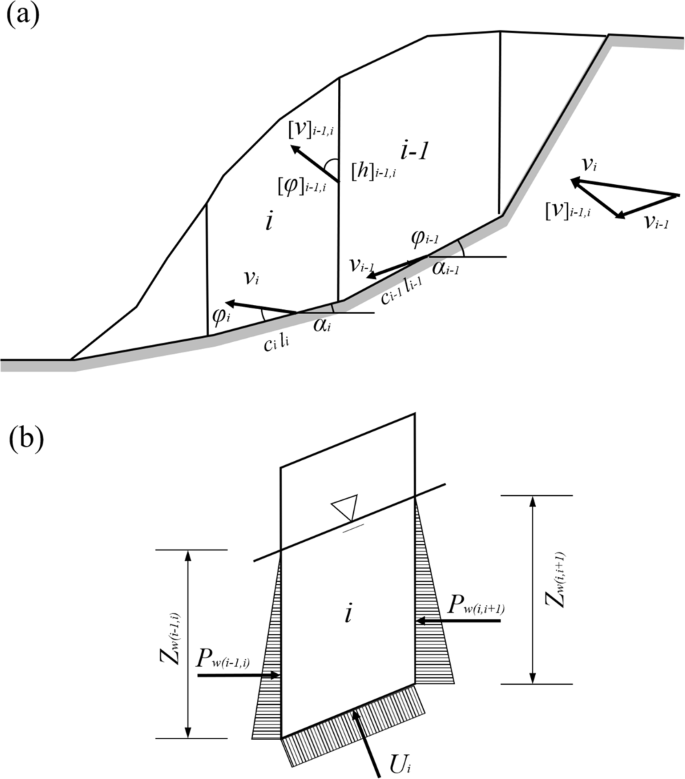
The 2D stability analysis based on the UB theory. (a) Virtual velocity field of slope divided into vertical slices; (b) Pore water pressure on the sliding layer.
Stability analysis using the FEM strength reduction method
Compared with the traditional LA method, the finite element method (FEM) performs better with the advantage of considering much complex boundary conditions, as well as the non-homogeneity of the soil and rock mass. Another advantage of the FEM method is that the stress and deformation field can be also obtained. The FEM strength reduction method has been proposed and applied in the analysis of slope stability52,53. It regarded the safety factor FS as the reduction degree of shear strength of the soil material when the slope reaches the limit state. The safety factor FS can be redefined as FS = c/cf or FS = tanφ/tanφf, where c and φ are the initially-input shear strength parameters, while cf and φf are the output shear strength parameters in the limit state after reduction, respectively.
The definition of the safety factor mentioned above is consistent with the definition introduced by Bishop54, that the safety factor FS is expressed as bellow,
where, τf represents the shear strength of the slope and can be calculated by the Mohr-Coulomb model with the cohesion and internal friction angle. τ denotes the actual shear stress of slope. Equation (7) can be transformed as follow,
Equation (8) means that the slope will reach the limit state with the c′ = c/Fs and tanφ′ = tanφ/Fs, which is the same with the definition mentioned above. Therefore, in our study, the reduction equations of shear strength are expressed as bellow, deducing with the assumption of the constant external load,
where R denotes the reduction coefficient with an initiate value of R = 1.0. In each iteration step, R increases with the stress and deformation analysis based on FEM implemented. The Mohr-Coulomb model is introduced to describe the constitutive relationship of the landslide mass. Commonly, the vertical boundary of the model is fixed in the horizontal direction, while the bottom boundary is constrained in both horizontal and vertical directions. The iteration of simulation breaks until the slope reaches the limit state. The value of the variable R under the limit state is regarded as the safety factor Fs for the selected landslide profile.
Results
Background of the case study
The so-called Lanmuxi landslide is located in the northwest of Xikou village, Fenghuang town, Hunan province, China (as shown in Fig. 2a). Evidence of previous landslide had been previously observed on July 2014. Owing to the impact of continuous heavy rainfall, the slope deformed, causing cracks in the crown and middle part of the slope body. Subsequently, on September 2014, two secondary landslides were triggered due to a heavy rainstorm, resulting in new cracks occurred in the crown region of the slope, with a maximum width up towards to 0.50 m. The total length of the landslide area is approximately 100.00 m. The maximum width and average thickness of the landslide reach 206.00 m and 4.40 m, respectively. The area of this landslide is estimated 1.37 × 10⁴ m2, with a total mass volume of 6.08 × 10⁴ m3. The slope body and the sliding layer mainly composed of silty clay, while the substrate consists of argillaceous siltstone. Geological investigation shows that there are only tiny amounts of pore water in the stratum and no groundwater is observed.

Overview of the Lanmuxi landslide. (a) Location of the landslide. (b) Map of the Lanmuxi landslide (using Grapher® 10, https://www.goldensoftware.com/products/grapher). (c) Photographic view (Photograph was taken by Z. Han).
The in-situ investigation after the secondary landslide event illustrates that the slope is still unstable, threatening 134 residents and 272 local buildings, with a total potential economic loss of 1.8 million dollars. The overview of the Lanmuxi landslide is shown in Fig. 2b,c.
Back analysis of the shearing strength parameters
In order to describe the state of the landslide under diverse condition reasonably, two different conditions are considered. In Condition 1, the mass of the slope is dry, while in Condition 2, it is supposed to be saturated under the impact of heavy rainfall. The saturated soil mass of the slope increases self-weight and consequently reduces shearing strength, leading to a greater risk for landslide failure.
According to the laboratory test on the three groups of soil material samples that obtained in-situ, the mean values of the parameters in this case are listed in Table 1. In the back analysis using the UB theory and the reliability method, the standard deviations are required. The laboratory test shows that the standard deviations of the shear strength parameters in the sliding layer are ± 2.98 kPa and ± 1.04° in the Condition 1, while ± 3.02 kPa and ± 1.96° in the Condition 2. The back analysis based on the deterministic method and reliability method are conducted, respectively. Results are shown in Table 2.
Laboratory test and back analysis are comprehensively considered to obtain the parameter of the sliding layer. We use the laboratory test results in Table 1 and the back-analysis results in Table 2 to attain the averaged values of the parameters in Table 3, which are suggested as the best-fitting parameters for stability analysis and FEM simulation.
Stability analysis
As mentioned in the above section, it has been widely accepted that the 2D analysis could lead to more conservative results than the 3D analysis in slope stability problems. For the safety consideration, we evaluate a conservative slope stability using a 2D model. To simplify the actual 3D slope into a 2D model, the length along the plane direction, i.e., C1-C1′ and D1-D1′ in Fig. 2b is hereafter referred to as the two typical slope profiles. Most of the local buildings and infrastructures are distributed at the landslide toes along the directions of the selected profiles. The slopes along the both profiles are presumed to be infinitely wide in the 2D model, negating the 3D effects caused by the infinite width of the sliding mass.
Owing to the significant reduction of the safety factor when soil mass is saturated, we mainly focus on the stability analysis under Condition 2. Two analysis methods, the UB method and the FEM strength reduction method, are conducted, respectively. The results in Table 4 illustrate that the landslide along Profile 2 is unstable (Fs < 1).
Stress and deformation analysis using the FEM method
In order to perform stress and deformation analysis using the FEM method, the both profiles are meshed into triangle blocks (Fig. 3). Profile 1 is meshed into 1494 blocks with 2515 nodes, while Profile 2 is separated into 1209 blocks with 2029 nodes. In each iteration step of the FEM simulation, stress and deformation are calculated and landslide strength is gradually reduced. Iteration breaks until the slope section comes to the limit state.

Finite element mesh. (a) Profile 1 (C1-C1′). (b) Profile 2 (D1-D1′).
Figure 4 and 5 illustrate the stress and deformation distribution. Figure 4a–d demonstrate the distribution of shear stress, effective stress, strain, and shear strain of Profile 1. While the plastic strain, the deformation along both horizontal and vertical directions under the limit state are shown in Fig. 4e–g. In contrast, Fig. 5 only shows the limit state of Profile 2, because the slope along this profile is unstable when soil mass is saturated, limiting the FEM simulation converged. As such, we only use the Eq. (9) to calculate the plastic strain and deformations of this profile in the limit state. Different from the strength reduction method which increases the reduction coefficient R as illustrated in Eq. (9), in order to obtain a converged FEM simulation results, we use a decreased R in each iteration step in the analysis of Profile 2. The shear strength consequently increases in each step until the unstable slope along Profile 2 reaches a limit state. Figure 4 indicates that the stress and deformation of Profile 1 majorly concentrate at the toe, while Fig. 5 reveals that the stress and strain of Profile 2 in the limit state majorly concentrate at the crown.

The FEM analysis results of Profile 1. (a) Shear stress. (b) Effective stress. (c) Strain. (d) Shear strain. (e) Plastic strain (the limit state). (f) Deformation in x direction (the limit state). (g) Deformation in z direction (the limit state).

The FEM analysis results of Profile 2. (a) Plastic strain (the limit state) (b). Deformation in x direction (the limit state) (c). Deformation in z direction (the limit state).
Discussion
Suggestion of countermeasures
The comprehensive results of stability analysis demonstrate that the slope along Profile 1 (C1-C1′) approximates the limit state, while Profile 2 (D1-D1′) is unstable. Therefore, in order to protect local buildings at the downslope area, countermeasures are required. As shown in Figs 4 and 5, the FEM analysis indicates the weak parts of the slope along both profiles. The stress and strain majorly concentrate on the toe and main body along the Profile 1, as well as the landslide crown along the Profile 2. These weak parts are supposed to subject obvious surface deformation that up towards to 142 mm as shown in Fig. 5c. In this context, we suggest structural strengthening at these weak parts, using anchor lattice beams at the landslide body, anti-slide piles at the landslide toe, as well as intercepting drains and cracks filling at the landslide crown. The length of the anchorage section is 4 m, and the anchoring force exerted by each anchor is 500 kN. The overall configuration of the landslide countermeasures is shown in Figs 6 and 7.

The plane layout of landslide mitigation measures (the figure was generated by Grapher 11, version 11.7.825, https://www.goldensoftware.com/products/grapher).

The profile layout of landslide mitigation measures. (a) Profile 1. (b) Profile 2.
To evaluate the effect of the countermeasures, an effect assessment is conducted in this paper by using the 2D UB method and the FEM strength reduction method. The analysis results are shown in Fig. 8 and Table 5. Figure 8 reveals an obvious control of the slope deformation after settling the structural strengthening. The maximum positive deformation in x direction of Profile 1 (C1-C1′) is reduced from 166.8 mm to 41.6 mm, while 162 mm to 95.2 mm of Profile 2 (D1-D1′). Table 5 shows that the safety factors of Profile 1 and 2 have been increased 43.6% and 43.8% respectively after the slope reinforcement. These results have demonstrated the feasibility and effectiveness of the recommended countermeasures.

The FEM analysis results of slope deformation in x-direction (after the slope reinforcement). (a) Profile 1. (b) Profile 2.
Limitations
For the simplification of calculation, the reliability method introduced in this study is performed with the assumption that the shear strength parameters are independent to each other. Therefore, the negative correlation between these parameters as revealed in previous studies55,56, and the impact of spatial correlation of shear strength remains unknown and were not considered in this study. The above limitation should be considered in future works.
Another limitation is with respect to the FEM simulation. Presently, effects of tension cracks are not considered in our analysis. However, previous study57 applied the kinematic approach of limit analysis to assess the stability of uniform cohesive friction slopes with cracks, indicating that failure mechanisms departing from the crack tip can lead to a significant overestimation of the stability of the slope. For this reason, the slope profile 1 in the case study may be instable in view of many observed tension cracks in the crown. Improvement on this issue is ongoing.
The third limitation in this paper relates to the 2D simplification of the actual complex 3D slope. The composition of the slope is usually heterogeneous and, in combination with the complicated soil layers, it is commonly difficult to select appropriate profiles to analyse its stability. In the 2D limit analysis of slope stability, the slope is presumed to be infinitely wide along the out-of-plane direction, negating the 3D effects caused by the infinite width of sliding mass. In consequence, the 2D slope stability analysis may be over-conservative and insufficient. In this sense, a large and realistic 3D model should be built and analysed in order to overcome such apparent instability found in the 2D analysis.
Conclusion
In this paper, we use a comprehensive analysis method to evaluate the stability of the Lanmuxi landslide and discuss the related countermeasures. The presented method has advantages in considering the uncertainties of the soil shear strength parameters, and generating more conservative results compared to the deterministic method.
The rational values of the sliding layer parameters are comprehensively determined by using the mean value of the back-analysis result of the reliability method, as well as the results by the deterministic method and the in-situ test. Following the determination of parameters, the 2D UB method of limit analysis and the FEM strength reduction method are performed for stability evaluation. The safety factors Fs along two typical profiles of the slope are calculated, indicating that the slopes along both profiles are unstable. The FEM-based analysis furthermore demonstrates the weak parts of the slope where stress and strain concentrate.
Structural countermeasures, using anchor lattice beams, landslide piles, and cracks filling, are suggested based on the comprehensive analysis results. Subsequently, an effect assessment based on UB method and FEM simulation is implemented. Results show notable decreasing of the deformation and about 40% increasing of the safety factors, which demonstrates the feasibility and effectiveness of the recommended countermeasures.
References
Petley, D. Global patterns of loss of life from landslides. Geology. 40(10), 927–930 (2012).
Ma, N., Ma, H. M. & Feng, W. Q. Interaction between countermeasure works and landsliding mass: a case study. The 10th Asian Regional Conference of IAEG. 1–6 (2015).
Leroueil, S. Natural slopes and cuts: movement and failure mechanisms. Geotechique. 51(3), 197–243 (2001).
Take, W. A., Bolton, M. D., Wong, P. C. P. & Yeung, F. J. Evaluation of landslide triggering mechanisms in model fill slopes. Landslides. 1(3), 173–184 (2004).
Wang, F. W., Sassa, K. & Wang, G. Mechanism of a long-runout landslide triggered by the august 1998 heavy rainfall in Fukushima prefecture, Japan. Engineering Geology. 63(1), 169–185 (2002).
Wu, J. H. Seismic landslide simulations in discontinuous deformation analysis. Computers & Geotechnics. 37(5), 594–601 (2010).
Pastor, M., Haddad, B., Sorbino, G., Cuomo, S. & Drempetic, V. A depth‐integrated, coupled SPH model for flow‐like landslides and related phenomena. International Journal for Numerical & Analytical Methods in Geomechanics. 33(2), 143–172 (2010).
Yuan, R. M., Tang, C. L., Hu, J. C. & Xu, X. W. Mechanism of the donghekou landslide triggered by the 2008 wenchuan earthquake revealed by discrete element modeling. Natural Hazards & Earth System Sciences. 14(5), 3895 (2014).
Han, Z. et al. Numerical simulation of debris-flow behavior based on the SPH method incorporating the Herschel-Bulkley-Papanastasiou rheology model. Engineering Geology. 255, 26–36 (2019).
Ashis, K. S., Ravi, P. G. & Irene, S. An approach for GIS-based statistical landslide susceptibility zonation—with a case study in the Himalayas. Landslides. 2(1), 61–69 (2005).
Catani, F., Lagomarsino, D., Segoni, S. & Tofani, V. Landslide susceptibility estimation by random forests technique: sensitivity and scaling issues. Natural Hazards & Earth System Sciences. 13(11), 2815–2831 (2013).
Han, Z. et al. An integrated method for rapid estimation of the valley incision by debris flows. Engineering Geology. 232(8), 34–45 (2018).
Zaruba, Q. & Mencl, V. Landslides and their control. Engineering Geology. 7(3), 281–282 (1982).
Wei, Z., Li, S., Wang, J. G. & Ling, W. A dynamic comprehensive method for landslide control. Engineering Geology. 84(1), 1–11 (2006).
Terzaghi, K. Mechanism of landslides. Application of Geology to Engineering Practice. 83–123 (1950).
Wieczorek, G.F. Chapter 4-landslide triggering mechanisms. Landslides: investigation and mitigation. (1996).
Huang, R. Q. Large-scale lan 357 dslide and their sliding mechanisms in China since the 20th century. Chinese Journal of Rock Mechanics and Engineering. 26(3),433–454 (in Chinese) (2007).
Zhou, S. H., Chen, G. Q. & Fang, L. G. Distribution pattern of landslides triggered by the 2014 Ludian earthquake of China: implications for regional threshold topography and the seismogenic fault identification. ISPRS International Journal of Geo-information. 5(4), 46 (2016).
Iverson, R. M. Landslide triggering by rain infiltration. Water Resources Research. 36(7), 1897–1910 (2000).
Malamud, B. D., Turcotte, D. L., Guzzetti, F. & Reichenbach, P. Landslide inventories and their statistical properties. Earth Surface Processes and Landforms. 29(6), 687–711 (2004).
Sonmez, H., Ulusay, R. & Gokeceoglu, C. A practical procedure for the back analysis of slope failures in closely jointed rock masses. Int J Rock Mech Mining Sci. 35(2), 219–233 (1998).
Tang, W. H., Stark, T. D. & Angulo, M. Reliability in back analysis of slope failures. Soils Found. 39(5), 73–80 (1999).
Wang, L., Hwang, J. H., Luo, Z., Jiang, C. H. & Xiao, J. Probabilistic back analysis of slope failure—a case study in Taiwan. Comput Geotech. 51, 12–23 (2013).
Low, B. K. & Tang, W. H. Efficient reliability evaluation using spreadsheet. J Eng Mech. 123(7), 749–752 (1997).
Low, B. K. & Tang, W. H. Reliability analysis using object-oriented constrained optimization. Struct Saf. 26(1), 69–89 (2004).
Low, B. K. FORM, SORM, and spatial modeling in geotechnical engineering. Struct Saf. 49, 56–64 (2014).
Zhang, J., Tang, W. H. & Zhang, L. M. Efficient probabilistic back-analysis of slope stability model parameters. J Geotech Geoenviron. 136(1), 99–109 (2009).
Zhang, L. L., Zhang, J., Zhang, L. M. & Tang, W. H. Back analysis of slope failure with Markov chain Monte Carlo simulation. Comput Geotech. 37(7), 905–912 (2010).
Yin, K. L., Jiang, Q. H. & Wang, Y. Numerical simulation 387 on the movement process of Xintan landslide by DDA method. Chinese Journal of Rock Mechanics and Engineering. 21(7), 959–962 (in Chinese) (2002).
Zhang, Y. et al. DDA validation of the mobility of earthquake-induced landslides. Engineering Geology. 194, 1069–1075 (2015).
Wu, J. H. & Chen, C. H. Application of DDA to simulate characteristics of the Tsaoling landslide. Computers and Geotechnics. 38(5), 741–750 (2011).
Chen, H. & Lee, C. F. A dynamic model for rainfall-induced landslides on natural slopes. Geomorphology. 51(4), 269–288 (2003).
Crosta, G. B., Chen, H. & Lee, C. F. Replay of the 1987 Val Pola Landslide, Italian Alps. Geomorphology. 60(1), 127–146 (2004).
Boon, C. W., Houlsby, G. T. & Utili, S. New insights into the 1963 Vajont slide using 2D and 3D distinct-element method analyses. Geotechnique. 64(10), 800–816 (2014).
Li, X. P., He, S. M., Luo, Y. & Wu, Y. Simulation of the sliding process of Donghekou landslide triggered by the Wenchuan earthquake using a distinct element method. Environmental Earth Sciences. 65(4), 1049–1054 (2012).
Wang, W., Chen, G., Zhang, Y., Zheng, L. & Zhang, H. Dynamic simulation of landslide dam behavior considering kinematic characteristics using a coupled DDA-SPH method. Engineering Analysis with Boundary Elements. 80, 172–183 (2017).
Han, Z. et al. Numerical Simulation of Debris-flow Behavior Incorporating a Dynamic Method for Estimating the Entrainment. Engineering Geology. 190, 52–64 (2015).
Han, Z. et al. Numerical simulation for run-out extent of debris flows using an improved cellular automaton model. Bulletin of Engineering Geology & the Environment. 76(3), 961–974 (2017).
Verma, A. K., Srividya, A. & Karanki, D. R. Reliability and safety engineering. Springer, London. (2010).
Sun, L. C., Wang, H. X. & Zhou, N. Q. Application of reliability theory to back analysis of rocky slope wedge failure. Chin J Rock. Mech Eng. 31(A01), 2660–2667 (2012).
Low, B. K. Reliability analysis of rock slopes involving correlated nonnormals. Int J Rock Mech Mining Sci. 44(6), 922–933 (2007).
Zhao, L. H., Zuo, S., Lin, Y. L. & Zhang, Y. B. Reliability back analysis of shear strength parameters of landslide with three-dimensional upper bound limit analysis theory. Landslides. 13(4), 711–724 (2016).
Lü, Q. & Low, B. K. Probabilistic analysis of underground rock excavations using response surface method and SORM. Comput Geotech. 38(8), 1008–1021 (2011).
Hicks, M. A., Nuttall, J. D. & Chen, J. Influence of heterogeneity on 3D slope reliability and failure consequence. Computers and Geotechnics. 61, 198–208 (2014).
Xiao, T., Li, D. Q., Cao, Z. J. & Zhang, L. M. CPT-based probabilistic characterization of three-dimensional spatial variability using MLE. Journal of Geotechnical and Geoenvironmental Engineering. 144(5), 04018023 (2018).
Liu, Y. et al. Probabilistic stability analyses of undrained slopes by 3D random fields and finite element methods. Geoscience Frontiers. 9, 1657–1664 (2018).
Reyes, A. & Parra, D. 3D slope stability analysis by the using limit equilibrium method analysis of a mine waste dump. In: Proceedings Tailings and Mine Waste 2014, Keystone, Colorado, USA, October 5–8 (2014).
Xie, M. W., Wang, Z. F., Liu, X. Y. & Xu, B. Three-dimensional critical slip surface locating and slope stability assessment for lava lobe of Unzen volcano. Journal of Rock Mechanics and Geotechnical Engineering. 3(1), 82–89 (2011).
Chen, W. F. Limit analysis and soil plasticity. Elsevier Scientific Pub. Co. (1975).
Chen, W. F. Limit analysis in soil mechanics. Elsevier Scientific Pub. Co. (1990).
Michalowski, R. L. Slope stability analysis: a kinematical approach. Geotechnique. 45(2), 283–293 (1995).
Zienkiewicz, O. C., Humpheson, C. & Lewis, R. W. Associated and non-associated visco-plasticity in soil mechanics. Geotechnique. 25(4), 671–689 (1975).
Duncan, J. M. State of the art: limit equilibrium and finite element analysis of slopes. discussion and closure. Journal of Geotechnical Engineering. 123(9), 577–596 (1996).
Bishop, A. W. The use of the slip circle in the stability analysis of slopes. Geotechnique. 5(1), 7–17 (1955).
Cherubini, C. Reliability evaluation of shallow foundation bearing capacity on c′, φ′ soils. Can Geotech J. 37(1), 264–269 (2000).
Wolff, T. F. Analysis and design of embankment dam slope: a probabilistic approach. University Microfilms. (1985).
Utili, S. Investigation by limit analysis on the stability of slopes with cracks. Geotechnique. 63(2), 140–154 (2013).
Acknowledgements
This study was financially supported by the National Key R&D Program of China (Grant No. 2018YFC1505401, Z. Han); the National Natural Science Foundation of China (Grant No. 41702310, Z. Han); the Natural Science Foundation of Hunan (Grant No. 2018JJ3644, Z. Han); the Innovation-Driven Project of Central South University (Grant No. 2019CX011); and the Fundamental Research Funds for the Central Universities of Central South University. These financial supports are gratefully acknowledged.
Author information
Authors and Affiliations
Contributions
Z.H., Y.G.L. and B.S. designed the study. Y.F.M. and W.D.W. performed the in-situ investigation. G.Q.C. simulates the performance of the suggested countermeasures. Z.H. and B.S. wrote the manuscript. All authors discussed the results and commented on the manuscript.
Corresponding author
Ethics declarations
Competing Interests
The authors declare no competing interests.
Additional information
Publisher’s note: Springer Nature remains neutral with regard to jurisdictional claims in published maps and institutional affiliations.
Rights and permissions
Open Access This article is licensed under a Creative Commons Attribution 4.0 International License, which permits use, sharing, adaptation, distribution and reproduction in any medium or format, as long as you give appropriate credit to the original author(s) and the source, provide a link to the Creative Commons license, and indicate if changes were made. The images or other third party material in this article are included in the article’s Creative Commons license, unless indicated otherwise in a credit line to the material. If material is not included in the article’s Creative Commons license and your intended use is not permitted by statutory regulation or exceeds the permitted use, you will need to obtain permission directly from the copyright holder. To view a copy of this license, visit http://creativecommons.org/licenses/by/4.0/.
About this article

Cite this article
Han, Z., Su, B., Li, Y. et al. Comprehensive analysis of landslide stability and related countermeasures: a case study of the Lanmuxi landslide in China. Sci Rep 9, 12407 (2019). https://doi.org/10.1038/s41598-019-48934-3
Received:
Accepted:
Published:
DOI: https://doi.org/10.1038/s41598-019-48934-3
This article is cited by
Comments
By submitting a comment you agree to abide by our Terms and Community Guidelines. If you find something abusive or that does not comply with our terms or guidelines please flag it as inappropriate.
