
Abstract
Living bacteria therapies have been proposed as an alternative approach to treating a broad array of cancers. In this study, we developed a genetically encoded microbial encapsulation system with tunable and dynamic expression of surface capsular polysaccharides that enhances systemic delivery. Based on a small RNA screen of capsular biosynthesis pathways, we constructed inducible synthetic gene circuits that regulate bacterial encapsulation in Escherichia coli Nissle 1917. These bacteria are capable of temporarily evading immune attack, whereas subsequent loss of encapsulation results in effective clearance in vivo. This dynamic delivery strategy enabled a ten-fold increase in maximum tolerated dose of bacteria and improved anti-tumor efficacy in murine models of cancer. Furthermore, in situ encapsulation increased the fraction of microbial translocation among mouse tumors, leading to efficacy in distal tumors. The programmable encapsulation system promises to enhance the therapeutic utility of living engineered bacteria for cancer.
Main
The microbiome plays many functional roles in human health and subsequently has led to converging interests in the use of live bacteria to treat disease1,2. Because microbes can be engineered as intelligent living medicines that sense and respond to environments, they can colonize niches in the gastrointestinal tract3,4, mouth5, skin6, lung7 and tumors8,9 and locally deliver therapeutics. However, host toxicity from live bacteria has been shown to limit tolerated dose and efficacy, in some cases leading to termination of clinical trials10,11,12,13. Moreover, unlike conventional drug carriers, the unique abilities of bacteria to continuously proliferate, translocate and deliver therapeutic payloads in cancerous tissue necessitates robust and temporal control of bacterial pharmacokinetics in vivo.
One approach to circumvent immunogenicity and toxicity of living bacterial therapy is the generation of genetic knockouts of immunogenic bacterial surface antigens, such as lipopolysaccharide (LPS). But this strategy can result in permanent strain attenuation and reduced colonization, as seen in clinical trials of bacteria cancer therapy11,14,15. Surface modulation has been widely used in cloaking drug delivery vehicles16, and, therefore, an alternative strategy is the synthetic coating of microbial surfaces with molecules, such as alginate17,18, chitosan17, polydopamine19, lipids20,21,22 and nanoparticles23. These one-time, static modifications of bacteria do not allow in situ modulation and can lead to uncontrolled growth, off-target tissue toxicity or compromised cellular function, resulting in reduced efficacy. Thus, enhancing bacterial delivery without compromising safety is a central challenge for clinical translation of live microbial therapies in cancer.
Here we present a tunable microbial surface engineering strategy using synthetic gene circuits to dynamically control bacterial interactions with their surrounding environment. We focused on bacterial surface capsular polysaccharide (CAP), a natural extracellular biopolymer that coats the extracellular membrane and protects microbes from a variety of environmental conditions. In the human body, CAP promotes bacterial survival and colonization by shielding microbes from various immune factors, such as complement opsonins and phagocytes24. Inspired by its natural ability to protect bacteria, we applied a synthetic biology approach to genetically engineer CAP biosynthesis for enhanced microbial delivery in vivo. Specifically, we constructed a programmable CAP expression system that regulates the bacterial surface with an external inducer, thereby modulating bacterial interaction with antimicrobials, bacteriophage, acidity and host immunity. This design allows precise control over bacterial immunogenicity and survivability in vivo, enabling increased dosing and in situ trafficking to maximize therapeutic efficacy and safety (Fig. 1).
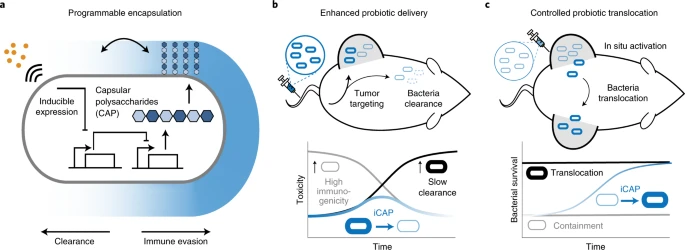
a, We engineered the biosynthetic pathway of bacterial CAP for tunable and dynamic surface modulation of the probiotic E. coli Nissle 1917 with synthetic gene circuits. This approach enables increased CAP levels upon induction to control immune evasion and clearance. b, The programmable CAP system enhances systemic delivery of bacteria by transiently expressing CAP. Non-CAP bacteria (thin gray cells) elicit toxicity by exposing the immunogenic bacterial surface, and permanently CAP-expressing bacteria (thick black cells) lead to overgrowth. The iCAP (blue cells) system enables transient encapsulation of bacteria, thus reducing initial inflammation while effectively clearing bacteria over time. c, The CAP system controls bacterial translocation among tumors. The iCAP system allows in situ activation of CAP in one tumor, which results in inducible bacteria translocation to distal, uncolonized tumors.
Small RNA knockdown screen identifies regulators of CAP synthesis
Because various bacteria have been used for therapeutic applications, we compared immunogenicity and viability of several E. coli and Salmonella typhimurium strains. Here, E. coli Nissle 1917 (EcN), a probiotic strain with favorable clinical profiles25, demonstrated high viability in human whole blood. When injected into mice, EcN induced the least immunogenic response in the blood (Supplementary Fig. 1). Because the K5-type CAP of EcN has been shown to alter interaction with host immune systems26,27,28,29, we chose to genetically modify its biosynthetic pathway30,31. K5-type CAP produced from EcN, also known as heparosan, is composed of a polymer chain of alternating β-D-glucuronic acid (GlcA) and N‐acetyl‐α‐D‐glucosamine (GlcNAc), attached to 3-deoxy-D-manno-oct-2-ulosonic acid (Kdo) linker (Fig. 2a). Glycotransferases of kfiABCD genes polymerize alternating GlcA and GlcNAc subunits. kpsCSFU genes encode proteins responsible for synthesis of the poly-Kdo linker on the terminal lipid, and kpsEDMT genes encode for transporters of CAP to the cellular surface. Although individual functions of the CAP genes have been investigated, engineering tunable and dynamic control of this system remains unexplored.

a, Schematic of K5 CAP biosynthesis in EcN. CAP is composed of an alternating polymer chain of GlcA and GlcNAc connected to a poly-Kdo linker. Subsequently, CAP is transported from the inner bacteria membrane to the outer membrane. b, Quantification of microbial growth parameters of EcN KD strains in nutrient-rich media (LB), blood or phage-containing media. Growth rate denotes maximum specific growth rate (h−1) obtained by fitting growth curve to measured OD600 over time. Blood viability is defined as bacterial CFU ml−1 after 6-hour incubation in human blood. Phage sensitivity is calculated by area under the curve of bacterial turbidity over 6 hours of incubation with LB media containing ΦK1-5. c, Phage sensitivity of EcN and EcN ΔkfiC. Plaque-forming assay demonstrates complete absence of infection and lysis in EcN ΔkfiC. The representative images show difference between serially diluted PFU of bacteria with and without CAP. Error bars represent s.e.m. over three independent samples. d, TEM images showing CAP encapsulation of the cellular outer surface. kfiC KO results in the absence of CAP nanostructure on the cell surface of EcN ΔkfiC. White arrows indicate cell surface. WT, wild-type.
We sought to identify key CAP genes capable of altering response to antibacterial factors encountered during therapeutic delivery. To do so, we generated a library of knockdown (KD) strains using synthetic small RNAs (sRNAs) that reduce expression of kfi and kps genes via complementary binding to mRNAs32. To initially assess the effect of downregulating each gene, we screened the growth of KD strains in (1) nutrient-rich media, (2) human whole blood and (3) CAP-targeting phage. Growth in nutrient-rich media showed little variation in maximum specific growth rates (µm) from the wild-type EcN strain (expressing CAP) (Fig. 2b), suggesting that the downregulation of the targeted genes in the CAP biosynthetic pathway does not greatly affect the fitness of EcN in the absence of environmental threats. However, we observed substantially reduced viability of KD strains compared to EcN after incubation in whole blood for 0.5 hours (Supplementary Fig. 2). After a 6-hour incubation in whole blood, KD strains in CAP synthesis (kfi genes and kpsFU) exhibited lower viability than KD strains in CAP transport (kpsEDMT) (Fig. 2b). To assess whether each gene KD causes a complete or partial loss of CAP in KD strains, we used lytic bacteriophage ΦK1-5 that specifically binds to heparosan of EcN27,29. Bacteria that express residual levels of heparosan CAP are susceptible to this phage, but complete loss of CAP confers immunity. We quantified phage sensitivity of each strain by measuring area under the curve of the phage-inoculated growth curve33 and observed that sRNA KD of most CAP genes did not alter phage sensitivity compared to control EcN (Fig. 2b), suggesting that some level of CAP is still present in KD strains. To abrogate the effect of residual CAP gene expression, we next constructed a library of knockout (KO) strains by deleting CAP synthesis genes (kfiABCD) from the EcN genome using the lambda red recombineering system. All kfi KO strains resulted in complete phage immunity (Supplementary Fig. 2), supporting loss of CAP expression. Notably, KO strains demonstrated increased blood sensitivity, indicating that CAP levels can be genetically tuned to alter sensitivities to antibacterial factors.
On the basis of the above results, we chose to further characterize kfiC, a well-studied gene that encodes a glycotransferase of GlcNAc. KfiC plays a central role in the production of heparosan by forming a membrane-associated complex with KfiA and KfiB, and the loss of this essential glycotransferase results in abolished CAP production29,34,35. Our results showed that (1) downregulation of kfiC via sRNA KD sensitized bacteria in blood, supporting its key role in regulating bacterial protection, and that (2) deletion of kfiC resulted in the highest enhancement in blood sensitivity, indicating that the level of protection can be altered by controlling gene expression. To confirm loss of CAP from the bacterial surface, we characterized surface properties of EcN ΔkfiC strain. Phage plaque formation assay confirmed complete immunity against ΦK1-5 (Fig. 2c). We also purified and detected bacterial polysaccharides using sodium dodecyl sulfate–polyacrylamide gel electrophoresis (SDS–PAGE), followed by CAP staining with alcian blue. Compared to EcN that produced strong staining with alcian blue at ~180 kDa, EcN ΔkfiC produced no visible band (Supplementary Fig. 3). We next characterized the morphological changes in bacterial surface using transmission electron microscopy (TEM) with ruthenium red staining. CAP was visible as an ~80-nm-thick layer of polysaccharides coating outside of the cellular membrane. In contrast, EcN ΔkfiC had diminished size of the polysaccharide layer at ~40 nm (Fig. 2d and Supplementary Fig. 3). We then investigated the capability of CAP to protect cells from a wide range of antimicrobial factors. In addition to the modified sensitivity to human whole blood and bacteriophages, EcN ΔkfiC demonstrated a significant reduction in cellular protection against panels of antibiotics (spectinomycin, ampicillin, gentamicin, kanamycin and streptomycin) and extreme acids (pH 2.5, LB media adjusted with hydrochloric acid) compared to EcN (Supplementary Fig. 4). Finally, we evaluated the general applicability of the approach in other CAP systems. We deleted homologous genes in different E. coli strains expressing K1 and K5 CAP (neuC and kfiC, respectively) and showed alteration in environmental sensitivity (Supplementary Fig. 5). Together, these results demonstrate that loss of CAP modifies cellular surface structure and protection against antimicrobial factors.
Construction of tunable and reversible CAP
We next constructed a programmable CAP system that can sense and respond to induction stimuli and modulate cell surface properties. We cloned kfiC under the control of the lac promoter, which can be activated with the small molecule inducer isopropyl-b-D-thiogalactopyranoside (IPTG) (Fig. 3a). We built a small library of plasmids with various copy numbers of kfiC and tested combinations with lacI expressed from the EcN genome or a plasmid to optimize for tight regulation of CAP production. EcN ΔkfiC transformed with the low (sc101 origin) copy number plasmid exhibited complete immunity against ΦK1-5 (Supplementary Fig. 6), indicating tight repression at the basal level. Induction with IPTG rescued the phage sensitivity, confirming inducible modulation of CAP on cellular surface.

a, Inducible gene circuit diagram whereby the kfiC gene was cloned under the control of a lac promoter to allow inducible CAP expression via the small molecule IPTG. b, SDS–PAGE gel stained with alcian blue showed elevating levels of CAP production corresponding to the IPTG concentration (top). The densitometric analysis of CAP bands demonstrated that CAP production reaches maximum at approximately 1 µM IPTG (bottom). c, SDS–PAGE gels and densitometric analysis show CAP kinetics upon induction (left) and decay (right). For b and c, source data are provided as a Source Data file. d, Ruthenium-red-stained TEM images showing change in CAP in titrating IPTG concentration. Histograms reveal shift in cellular outer layer thickness as IPTG concentration increases. Insets show representative images of bacteria and zoomed outer surface structure. Dotted lines indicate inner and outer (white) perimeters of CAP. Scale bars, 40 nm (left) or 200 nm (right) in each inset. Five cells from each group were analyzed to generate the histograms. All error bars represent s.e.m. over two independent samples. OP, outer polysaccharide.
We examined the tunability of this inducible CAP (iCAP) system by characterizing multiple induction conditions. SDS–PAGE showed increase in CAP production from EcN carrying the iCAP system (EcN iCAP) when incubated with elevating levels of IPTG (Fig. 3b). Co-incubation with ΦK1-5 also showed decreasing viability of EcN iCAP with elevating levels of IPTG (Supplementary Fig. 6). We next used TEM to investigate the effect of the iCAP system on cell surface morphology (Fig. 3d). Increasing levels of IPTG shifted the mean bacterial membrane thickness from 44 nm to 81 nm, confirming the tunable capability of the system. Intermediate iCAP activation at 100 nM revealed a bimodal distribution of the membrane thickness, suggesting that kfiC regulates the production level, but not the length, of the polysaccharide polymers. This result agreed with SDS–PAGE data that showed no difference in migration of the CAP band depending on IPTG concentration (Fig. 3b).
We subsequently evaluated the dynamics of production and recovery of the iCAP system using a similar approach. Upon addition of IPTG, elevated CAP production was observed over time on SDS–PAGE, reaching near-maximum levels by 6 hours (Fig. 3c). Similarly, removal of IPTG resulted in gradual decrease in CAP until complete repression by 6 hours. We also tested iCAP dynamics via co-incubation with ΦK1-5. Although uninduced EcN iCAP grew, induction with IPTG at the start of co-incubation resulted in a rapid lysis event at 3.5 hours (Supplementary Fig. 6), demonstrating delayed CAP production with similar kinetics observed in SDS–PAGE. Collectively, these data highlight the programmable capability of CAP modulation on the bacterial surface.
Programmable protection from host immunity
To build toward use of the iCAP system for cancer applications in vivo, we first tested the ability to control bacterial viability in human whole blood containing functional host bactericidal factors in vitro. Upon IPTG induction, we observed increased EcN iCAP survival compared to uninduced control (Fig. 4a,b). Increasing IPTG levels improved bacterial survival over a range of at least ~105-fold, highlighting the tunable capability of the system. Because iCAP deactivation was observed after removing the inducer, we tracked bacterial survival over time after transiently activating EcN iCAP at varying IPTG concentrations. We were able to modulate the rate of bacterial clearance from blood by titrating levels of IPTG (Fig. 4c). Wild-type EcN persisted for more than 6 hours, whereas EcN ΔkfiC quickly decreased to the levels under the limit of detection (LOD, ~102 colony-forming units (CFU) per milliliter) within the first 0.5 hours. A protective role of CAP in mouse whole blood was also observed (Supplementary Fig. 7).

a, Bacteria were encapsulated using the iCAP system and exposed to human whole blood to test CAP-mediated protection. Elevating levels of CAP activation with IPTG enabled a corresponding increase in bacterial survival in human whole blood. Bacteria were pre-induced with IPTG before blood exposure. b, Representative images of bacteria spotted on LB agar plate after 1-hour incubation in human whole blood (right). c, Survival kinetics using varying levels of IPTG induction before incubation with human whole blood. 102, 103 or 104 nM IPTG were added to the bacteria overnight culture to pre-induce the iCAP system. d, Induced or un-induced iCAP bacteria were co-cultured with BMDMs to test CAP-mediated protection from phagocytosis. e, BMDMs were lysed after incubating with bacteria for 30 minutes to enumerate phagocytosed bacteria (**P = 0.007, two-sided unpaired t-test). f, Representative fluorescence microscopy images showing bacteria (GFP, top) in phagocytes (bright-field overlayed with GFP, bottom). Scale bars, 10 µm. g, Human THP-1 cells were co-incubated with EcN, EcN ∆kfiC or EcN iCAP (pre-induced with 10 µM IPTG) to test for immunogenicity. h–j, Cytokine levels in the culture media were measured using Luminex multiplex assay including TNFα (**P = 0.001 and ***P = 0.0002, respectively, at 24 hours after incubation), IL1β (*P = 0.017 at 4 hours after incubation) and IL6 (*P = 0.029 at 4 hours after incubation). All error bars represent s.e.m. over three independent samples, and statistical analyses were performed using one-way ANOVA with Tukey’s multiple comparison test. LOD at 2 × 10² CFU ml−1 (b and c) and 1 × 10² CFU ml−1 (e).
To investigate the effect of the programmable CAP system on bacterial interaction with individual immune factors within whole blood, we assessed how CAP alterations modulated macrophage-mediated phagocytosis and complement-mediated killing. To study phagocytosis, we incubated EcN with murine bone-marrow-derived macrophages (BMDMs) (Fig. 4d). iCAP activation before co-incubation with macrophages resulted in reduction in uptake of bacteria within macrophages compared to basal control (Supplementary Fig. 8), demonstrating controllable protection from cellular immune recognition. Bacterial colony counting of macrophage lysates and fluorescence microscopy imaging confirmed ~10-fold less phagocytosis with bacteria induced with IPTG compared to uninduced control (Fig. 4e,f). To assess the inflammatory response by phagocytes, we co-cultured EcN with THP-1 human monocytic cells and measured levels of various cytokines produced in response to microbial detection (Fig. 4g). Absence of CAP increased levels of many inflammatory cytokines (Fig. 4h–j and Supplementary Fig. 9), indicating the ability of CAP to mask microbial recognition from the immune system. Activated EcN iCAP was able to decrease inflammatory responses to similar levels as EcN. To study protection against circulating host antimicrobials, such as the complement system, we exposed EcN to human plasma. Presence of CAP improved bacterial survival by at least ~105-fold (Supplementary Fig. 10), demonstrating that CAP protects bacteria from soluble host bactericidal factors. Together, these findings suggest the potential utility of the programmable CAP system to modulate a multitude of host–microbe interactions in vivo.
Transient CAP improves engineered probiotic therapy in vivo
Intravenous (i.v.) delivery of bacteria allows access to various disease sites in the body; however, systemic delivery of bacteria remains challenging because (1) rapid clearance by the host immune system requires increased dosing, whereas (2) failure in bacteria clearance can lead to bacteremia and sepsis. Because the iCAP system allowed temporal control over bacterial protection and immunogenicity, we sought to improve bacterial delivery by initially protecting bacteria during the delivery stage via CAP production and subsequently allowing CAP decay to clear them and ensure safety. To study the protective role of CAP in vivo, we first characterized probiotic bioavailability and host health in mouse models. Upon i.v. administration of EcN ΔkfiC, viable bacteria in blood circulation quickly dropped below the LOD (200 CFU ml−1). In contrast, EcN remained detectable during the first 4 hours (Supplementary Fig. 11), demonstrating the protective function of CAP in vivo. To examine the host response to encapsulated (that is, wild-type) versus unencapsulated (that is, ΔkfiC) EcN, we measured levels of serum cytokines (Fig. 5a). We detected lower levels of acute inflammatory cytokines from mice injected with EcN compared to EcN ΔkfiC (Fig. 5b–f and Supplementary Fig. 11), similarly to the decreased response observed in our in vitro assay. To test the effect of initial encapsulation by EcN iCAP, we administered the strain pre-induced with 10 µM IPTG and compared serum cytokine levels. EcN iCAP generally induced less inflammatory response than EcN ΔkfiC, supporting successful encapsulation in vivo. We noted that EcN iCAP appeared to elicit intermediate production of a subset of cytokines (such as interleukin 6 (IL6) and granulocyte colony-stimulating factor (G-CSF)) in between EcN and EcN ΔkfiC, and the contribution of the transient encapsulation system to this response warrants future investigation. To study long-term inflammation, we tracked white blood cell count over time. In contrast to the acute cytokine responses, we detected low neutrophil counts initially that increased over 1 week after injection with the bacteria (Supplementary Fig. 11). EcN administration resulted in a higher level of neutrophil counts compared to EcN iCAP, suggesting that the persistence of CAP-expressing EcN poses a risk of systemic inflammation and toxicity. Thus, although CAP can improve bioavailability and lower initial immunogenicity, static protection might lead to bacterial persistence and inflammatory response, posing toxicity risks.

a, Host response was evaluated after bacterial administration in mice. EcN iCAP was pre-induced with 10 µM IPTG and allowed to gradually attenuate CAP over time. b–f, Serum cytokine levels after 5 × 10⁶ CFU bacterial administration. IL1β (b, *P = 0.039 at 4 hours p.i.), IL6 (c, **P = 0.0037 at 4 hours p.i.), IL10 (d, **P = 0.0089 and *P = 0.014, respectively, at 24 hours p.i.), G-CSF (e, ****P < 0.0001 and **P < 0.01, respectively, at 24 hours p.i.) and GM-CSF (f, *P = 0.019 at 4 hours p.i.) were measured. g, Toxicity was evaluated by bacterial administration with elevating doses. h, Change in animal body weight after i.v. bacterial administration at 5 × 10⁶ CFU (**P = 0.004; n = 10, 5 and 5 mice for EcN iCAP, EcN and EcN ΔkfiC groups, respectively). i, Survival curve (>15% body weight reduction; n ≥ 5 mice per group) after bacterial administration at 1~7 × 10⁷ CFU. j, Dose–toxicity curve with MTD = 4.4 × 10⁷ CFU, 5.8 × 10⁶ CFU and 9.6 × 10⁶ CFU for EcN iCAP, EcN and EcN ΔkfiC, respectively. MTD was calculated based on TD50 (>10% body weight drops p.i.; non-linear regression with least squares fit; n ≥ 5 per group). k, Mice bearing tumors were intravenously injected with EcN MTD, EcN ΔkfiC MTD and EcN iCAP MTD (pre-induced with 10 µM IPTG) or EcN iCAP low (pre-induced with 10 µM IPTG) at 5 × 10⁶, 1 × 10⁷, 5 × 10⁷ or 5 × 10⁶ CFU, respectively. Bacteria were engineered to produce TT. l, Bacterial growth trajectories in subcutaneous CT26 tumors measured by bacterial luminescence (****P < 0.0001; n = 14, 13, 9 and 13 tumors for EcN MTD, EcN ΔkfiC MTD, EcN iCAP MTD and EcN iCAP low groups, respectively). Luminescence values are normalized to basal luminescence of individual strains. m, n, Therapeutic efficacy measured by relative tumor size over time in a syngeneic CT26 model (m; ****P < 0.0001, ***P = 0.0008, **P = 0.003; n = 14, 13, 9, 13 and 11 tumors for EcN MTD, EcN ΔkfiC MTD, EcN iCAP MTD, EcN iCAP low and PBS groups, respectively) and in a genetically engineered spontaneous breast cancer MMTV-PyMT mouse model (n; *P = 0.0197; n = 15, 15 and 9 tumors for EcN MTD, EcN iCAP MTD and PBS groups, respectively). MMTV-PyMT tumors were measured by calipering three orthotopic regions in mammary glands (upper left, upper right and bottom). Mice in PBS groups reached study endpoint 10 days p.i. Statistical analyses were performed using one-way ANOVA (b–f) and two-way ANOVA (h, i–n) with Tukey’s multiple comparison test. Bacteria were engineered to produce TT (l–n). All error bars represent s.e.m. over three independent samples unless otherwise noted. All ‘n’ denotes number of biological replicates. a.u., arbitrary units; GM-CSF, granulocyte–macrophage colony-stimulating factor; p.i., post injection.
We hypothesized that transient activation of the iCAP system could enhance bacterial delivery properties, such as maximum tolerated dose (MTD), host toxicity and biodistribution. Inducing CAP expression before injection would increase bioavailability and mask cytokine induction, and loss of CAP in the absence of the inducer in vivo would allow for effective clearance of bacteria and minimize long-term immune responses. To test this strategy, we first pre-induced EcN iCAP with 10 µM IPTG, intravenously administered escalating doses of the bacteria and then assessed host health and determined MTD36,37(Fig. 5g). At 5 × 10⁶ CFU, EcN iCAP caused a smaller decrease in body weight compared to EcN and EcN ΔkfiC with static cellular surface (that is, with or without CAP, respectively) (Fig. 5h). Notably, EcN iCAP reduced toxicity compared to EcN and EcN ∆kfiC at higher doses: EcN and EcN ΔkfiC caused severe endpoint toxicity (death or >15% loss of weight) to mice treated with doses above 1 × 10⁷ CFU within 2 days, whereas no mice showed severe toxicity after injection of pre-induced EcN iCAP at the same doses (Fig. 5i). Based on these data, we computed a dose–toxicity curve and demonstrated that transiently induced EcN iCAP results in ~10-fold-higher MTD compared to EcN and EcN ΔkfiC (Fig. 5j). To further study safety, we simulated a severe toxicity scenario by inducing sepsis by intraperitoneal injection of bacteria38. At both high and low doses (107 and 106 CFU, respectively), we consistently observed improved safety for EcN iCAP compared to EcN and EcN ΔkfiC (Supplementary Fig. 12). Finally, to study bacteria biodistribution, we administered all groups of bacteria at a matched dose of 5 × 10⁶ CFU via i.v. injection. Approximately 10-fold less EcN and EcN iCAP were found in peripheral organs (liver and spleen) compared to EcN ΔkfiC (Supplementary Fig. 13), indicating that initial induction of EcN iCAP was sufficient to provide protection from the mononuclear phagocyte system.
Because systemic bacterial delivery has been extensively used for cancer therapy, we next tested whether the programmable CAP system can improve anti-tumor efficacy by permitting higher doses (Fig. 5k). To engineer bacteria to deliver anti-tumor payloads, we cloned a gene encoding theta toxin (TT), a pore-forming toxin that was previously shown to be effective as a bacterial cancer therapy39, in a high-copy-number plasmid (pUC) with a stabilization mechanism for in vivo applications (Axe/Txe system40). In a syngeneic CT26 colorectal cancer model, we intravenously administered engineered EcN at the corresponding MTD of each strain (EcN, EcN ΔkfiC and EcN iCAP at 5 × 10⁶, 1 × 10⁷ and 5 × 10⁷ CFU, respectively), along with a low dose of EcN iCAP at 5 × 10⁶ CFU to match the MTD of EcN. Over the following days, bacterial accumulation in tumors was observed by luminescence. Here, EcN iCAP MTD showed significantly higher signals in tumors compared to all other groups (Fig. 5l). After bacterial administration, we observed that mice treated with EcN MTD, EcN ΔkfiC MTD and low-dose EcN iCAP exhibited modest tumor growth suppression compared to the untreated group over 14 days. By contrast, single administration of EcN iCAP MTD resulted in significant tumor growth suppression by ~400% compared to the untreated group (Fig. 5m). Although increased MTD enabled by transient activation of the iCAP system improved therapeutic efficacy, the body weight of animals in MTD groups remained similar (Supplementary Fig. 14). We next compared the efficacy of TT-producing EcN and EcN iCAP at MTD in a genetically engineered spontaneous breast cancer model (MMTV-PyMT). EcN iCAP MTD resulted in improved tumor growth suppression by ~100% compared to EcN MTD over 14 days (Fig. 5n). Consistently, we observed higher bacterial luminescence signal in tumor from EcN iCAP compared to EcN, whereas body weight remained similar between the two treatment groups (Supplementary Fig. 15). To further explore the role of CAP on bacterial delivery to tumors in vivo, we built a mathematical bacterial pharmacokinetics model. Our simulations suggested that transient protection of bacteria using the iCAP system could improve tumor specificity by minimizing persistence in peripheral organs (that is, blood and liver), supporting our experimental observations (Supplementary Fig. 16). As a result, this approach allows for elevated bacterial doses, which leads to increased tumor accumulation upon injection. Lastly, we tested whether EcN iCAP had lost CAP in tumors. We injected EcN, EcN ΔkfiC and EcN iCAP (pre-induced with IPTG) at a dose of 5 × 10⁶ CFU via i.v. injection, isolated intratumoral bacteria after 2 days and grew the bacteria in LB media containing ΦK1-5. EcN iCAP grew in the presence of ΦK1-5, indicating the loss of CAP in the tumor (Supplementary Fig. 17). Taken together, the iCAP system enables increased tolerable bacterial doses and improved therapeutic efficacy.
In situ CAP activation translocates EcN to distal tumors
Intratumoral (i.t.) bacteria injection has been used as a route of delivery in clinical settings owing to higher therapeutic efficacy, dose titration capability and improved safety profiles compared to systemic injection41,42,43,44,45. One unique capability of i.t. delivery is the translocation of bacteria from injected tumors to distal tumors45, potentiating an alternate route of safe bacterial delivery to inaccessible tumors. However, continuous translocation coupled with long-term survival of bacteria can pose a substantial safety concern; thus, in situ activation of translocation could allow for more optimal use of this phenomena. To model this hypothesis, we simulated i.t. delivery and showed that in situ induction of EcN iCAP within the tumor increases bacterial bioavailability in circulation and facilitates bacterial translocation to distal tumors (Fig. 6a and Supplementary Fig. 16). We then tested this strategy via i.t. injection of uninduced EcN iCAP (that is, without CAP) into a single tumor of mice harboring dual hind flank CT26 tumors (Fig. 6b). To activate the iCAP system in situ, mice were fed with water containing IPTG. After 3 days, we observed a marked increase in bacterial translocation to distal tumors compared to uninduced bacteria (Fig. 6c and Supplementary Fig. 18). Biodistribution data showed tumor translocation, and mice exhibited minor reductions in body weight (Supplementary Fig. 18). Tracing colonization kinetics using bioluminescent EcN confirmed the appearance of bacteria in distal tumor 1 day after IPTG administration (Supplementary Fig. 19). We next explored whether this bacterial trafficking approach can be generalized in multiple clinically relevant animal models. We tested orthotopic breast cancer (mammary fat pad 4T1) and MMTV-PyMT mouse models. Consistently, we observed increased bacterial translocation to distal tumors via in situ activation of iCAP in both tumor models (Fig. 6d–f and Supplementary Figs. 19, 20 and 21). Notably, i.t. injection of EcN iCAP into a single tumor in the MMTV-PyMT model resulted in microbial translocation to multiple distal tumors throughout the body after IPTG induction.

a, Schematic of iCAP-mediated bacterial translocation. EcN iCAP is injected into one tumor. iCAP activation enables bacteria translocation to distal tumors. b, Mice harboring multiple tumors are injected with EcN iCAP into a single tumor (treated tumor). Mice are fed 10 mM IPTG water to activate iCAP in situ. To quantify bacterial biodistribution, mice were imaged daily for bacterial bioluminescence, and organs were harvested and bacterial colonies were counted after 3 days. c–e, Inducible translocation of EcN iCAP to distal tumors in CT26 syngeneic (c), 4T1 orthotopic (d) and MMTV-PyMT genetically engineered (e) mouse tumor models. Representative IVIS images showing bacterial translocation in vivo. White arrows indicate location of bacterial injection. Black arrows indicate location of bacterial translocation. Translocation is quantified by fraction of bacteria found in distal tumor compared to treated tumor. Bacteria number is measured by performing biodistribution for CFU g−1 enumeration for CT26 (*P = 0.032; n = 4 and 5 tumors for −IPTG and +IPTG groups, respectively), 4T1 (*P = 0.029; n = 4 tumors for both −IPTG and +IPTG groups) and MMTV-PyMT (**P = 0.003; n = 14 and 11 tumors for −IPTG and +IPTG groups, respectively) models. All error bars represent median, and statistical analyses were performed using a two-sided Mann–Whitney test. f, Representative images of ex vivo organ images taken with IVIS showing bacterial tumor translocation in 4T1 orthotopic mouse model. g, Schematics of engineered EcN capable of inducible translocation and therapeutic expression. Translocation and therapeutic production are externally controlled by IPTG and AHL, respectively. h–i, Therapeutic efficacy in treated and distal CT26 tumors measured by relative tumor growth over time. All bacteria were engineered to produce TT. Bacteria were injected into a single treated tumor. Three days p.i., AHL was administered. Mice were fed with (h) or without (i) IPTG water, and tumor size was measured (NS P = 0.83 and **P = 0.004, respectively; two-way ANOVA, n = 6 and 5 for treated and distal tumors, respectively). All error bars represent s.e.m. All ‘n’ denotes number of biological replicates. NS, not significant; p.i., post injection.
We next delivered therapeutics to tumors using engineered EcN expressing the anti-tumor TT payload. TT was cloned under the luxI promoter that is responsive to an inducer molecule acylated homoserine lactone (AHL) orthogonal to IPTG (Fig. 6g). After i.t. injection of therapeutic EcN into a single tumor in the CT26 dual-flank mouse model, translocation to uninjected tumors was controlled by feeding mice with or without IPTG water. Another group of mice was given i.t. injection of EcN iCAP without TT as non-therapeutic control. iCAP-mediated bacterial translocation was confirmed by bacterial bioluminescence (Supplementary Fig. 22). Subsequently, AHL was administered subcutaneously to induce TT expression, and tumor growth was monitored. Although PBS treatment allowed tumor growth of ~400%, a reduction in the growth of tumors was observed when they were directly injected with therapeutic EcN regardless of bacterial translocation. By contrast, therapeutic efficacy in distal (uninjected) tumors was observed only when the mice were fed with IPTG water followed by TT induction via subcutaneous injection of AHL (Fig. 6h,i and Supplementary Fig. 23), demonstrating successful therapeutic delivery to distal tumors using the iCAP-mediated bacterial translocation approach. Body weight recovered to baseline within a few days after administration for all conditions (Supplementary Fig. 24). Together, we provide a demonstration of controllably translocating therapeutic bacteria and using this strategy to treat distal tumors in vivo.
Conclusion
We have demonstrated a synthetic biology approach for dynamic and tunable modulation of the bacterial surface in the context of in vivo therapeutic delivery. Taking advantage of the natural evolution of the CAP system to interface with a multitude of environments, we showed engineered bacterial interactions with host immunity, bacteriophage, antimicrobials and acidity. Although we have explored the modulation of CAP density via kfiC in this study, our sRNA screen showed that several genes differentially sensitized bacteria to immune factors in blood. Thus, additional genes identified in this study may also be used to control varied sensitivities or to independently alter bacterial sensitivity to various environmental factors. For example, kfiB and kfiC genes have been reported to differentially modulate bacterial interactions with epithelial cells29. We have also shown that this approach can be applied to other strains of E. coli. Because there exist over 80 distinct E. coli CAP systems24,31 and many more in other species, we envision CAP engineering to possess vast opportunities to controllably modulate microbial surface properties for therapeutic delivery.
Despite recent preclinical progress with bacterial therapies, dose-limiting toxicity has been a long-standing challenge, slowing efforts for clinical translation. Early works by William Coley in the 19th century observed tumor regression upon injections of a live bacterial cocktail46, but this approach was largely unsafe due to potential risks of infections and inflammatory side effects. More recently, several clinical trials using genetically attenuated bacterial strains observed dose-limiting toxicities. For example, systemic administration of attenuated S. typhimurium strain (VNP20009) at or higher than tolerable dose led to tumor colonization in less than 20% of patients and resulted in no objective regression in a phase 1 clinical trial11. Although the recent focus of synthetic biology has been the engineering of various therapeutic payloads to increase efficacy, strategies to improve bacterial delivery have been limited. We used an on-demand CAP system to temporarily protect probiotic EcN from immune clearance and demonstrated a ~10-fold increase in the systemically injectable tolerated dose in vivo. As a result, transient expression of CAP was able to safely enhance bacterial delivery and suppress rapidly growing syngeneic colorectal and breast tumors with a single i.v. administration. Given that humans are 250-fold more sensitive to endotoxins than mice47, we expect our results to have implications in the clinical translation of bacterial therapies. Further investigation on the safety of this approach for human patients is needed. For example, comprehensive analysis on inflammatory responses at escalating doses can provide insights toward establishing an MTD and account for differences from in vitro human and in vivo mouse results. We also noted that EcN iCAP appeared to result in slightly more weight loss initially compared to EcN at their respective MTD, and further investigation with a larger sample size is warranted. Leveraging the programmable nature of the genetic CAP system, we envision the use of biosensors to autonomously sense physiological condition in the future. Because the CAP system is orthogonal to other bacterial surface structures, such as LPS, phospholipids and flagellum48, synergistic combinations of these systems could further improve the programmability and immunogenicity of bacterial therapy. More broadly, tools for controlling bacterial growth, such as bacterial lysis, auxotrophy and antibiotics, can be combined with the CAP system to enhance safety49,50,51,52,53,54.
We further devised the CAP system to facilitate translocation of bacteria to distal tumors, demonstrating a delivery strategy with advantageous safety profiles. Comparing across different tumor types, we noted leakier translocation of bacteria in 4T1 and MMTV-PyMT models, suggesting that tumor type, location or vascularization might play a role in bacterial escape from the tumor microenvironment. Regardless, in situ activation of the iCAP system opens the possibility of using programmable translocation of therapeutic bacteria to inaccessible disease sites, including metastatic tumors. Transient in situ activation could allow for colonization of newly formed tumors with reduced accessibility. In addition, the ability to transiently increase circulating bacteria from colonized tumor might allow safe sampling of bacteria without the need for an invasive tumor biopsy, while preventing excessive leakage of bacteria that could cause bacteremia and systemic infection. More broadly, we envision that in situ control over bacterial CAP may be used to provide further safeguards during bacterial therapy, such as sensitization of bacteria with antibiotics and phage therapy53,54,55.
In addition to clear applications within bacteria cancer therapy, the utility of the programmable CAP system can be extended to other clinical settings. For example, we showed that CAP provides protection from acids that could potentially protect orally delivered probiotics during transit through the gastric environment and facilitate intestinal colonization56. Beyond delivery, altering surface immunogenicity may also be used therapeutically to modulate the host immune landscape in the tumors and gut57,58. The platform described here could also be used as a model system to study the role of CAP and other surface structures on pathogen colonization in the host environment59,60. Aside from model systems and clinical applications, the CAP system may provide a general platform for a programmable interface with various environments. As microbial deployment in various applications continues to advance, robust control over microbial interaction with complex surroundings will ensure safe and effective implementation of engineered microbes.
Methods
Bacterial strains and culturing
The host strain used in this study was EcN, which naturally expresses K5 CAP containing a genomically integrated erythromycin resistance luxCDABE cassette for bacterial bioluminescence tracking in vivo. For all strains used in this study, see Supplementary Table 1. All bacteria were grown with appropriate antibiotics selection (100 μg ml−1 of ampicillin, 50 μg ml−1 of kanamycin, 25 μg ml−1 of chloramphenicol and 50 µg ml−1 of erythromycin) in LB media (Sigma-Aldrich) at 225 r.p.m. or on LB agar plates containing 1.5% agar at 37 °C.
Construction of plasmids and gene circuits
To construct a KD library, plasmids with sRNA targeting each gene of the CAP biosynthetic pathway were prepared using Gibson Assembly. The sRNA sequences were designed to be complementary and bind to the 24-nucleotide sequence of the target gene coding sequence spanning the ribosome binding site and the start codon32,61. A plasmid template was prepared by polymerase chain reaction (PCR) amplifying backbone (pTH05) using primers (pTH05_for and pTH05_rev), and the single-stranded DNA for sRNA against genes in CAP biosynthesis was inserted (kfiA, kfiB, kfiD, kpsC, kpsS, kpsF, kpsU, kpsE, kpsD, kpsT and kpsM) and transformed into Mach1 competent cells (Invitrogen). CAP gene circuits and the therapeutic plasmids were constructed in a similar manner. Genes of interest were obtained by synthesizing oligos or gBlock from IDT or PCR amplification (kfiC gene was obtained via colony PCR from EcN). Subsequently, plasmids were constructed using Gibson Assembly or using standard restriction digest and ligation cloning and transformed into Mach1 competent cells (Invitrogen).
Construction of KO strains
EcN was transformed to carry lambda red helper plasmid (pKD46)62. Transformants were grown in 50 ml of LB at 30 °C with chloramphenicol to an optical density at 600 nm (OD600) of 0.4 and made electrocompetent by washing three times with ice-cold MilliQ water and concentrating 150-fold in 15% glycerol. Chloramphenicol resistance cassette was prepared by PCR with primers flanked by sequence within each target gene, followed by gel purification and resuspension in MilliQ water. Electroporation was performed using 50 µl of competent cells and 10–100 ng of DNA. Shocked cells were added to 1 ml of SOC, incubated at 30 °C for 1 hour with 20 µl of arabinose and incubated at 37 °C for 1 hour. Cells were then plated on LB plates with chloramphenicol and incubated in 37 °C overnight. Colonies were picked the next day to obtain KO strains, including ΔkfiC strain (EcN ΔkfiC).
Characterization of CAP strains sensitivity to phages, antibiotics and acids
To perform plaque-forming assays, bacteria were plated onto LB agar plates to make a lawn and allowed to dry under fire. Then, 10 µl of serial diluted ΦK1-5 phage (I. Molineux, University of Texas, Austin) was spotted onto the plates and allowed to dry. Plates were incubated at 37 °C overnight and inspected the next day for PFU counting. Similar phage plaque-forming assays were performed for K1 and K5 type E. coli strains.
To assess bacterial growth in liquid culture, overnight cultures of EcN, EcN ΔkfiC or EcN iCAP strains were calibrated into OD600 of 1.0, and 100 µl of each was transferred into a 96-well plate (Corning). Next, 1 µl of 108 PFU ΦK1-5 phage or antibiotics of indicated concentrations was added to each well. The samples were incubated at 37 °C with shaking in a Tecan plate reader, and the OD600 was measured every 20 minutes. For bacterial growth in low pH condition, LB media was adjusted to pH 2.5 using hydrochloric acid, and bacteria were incubated at 37 °C for 1 hour, followed by serial dilution and plating on an LB agar plate for CFU enumeration.
Characterization of CAP using SDS–PAGE
CAP was purified via the chloroform–phenol extraction as previously described63,64. In brief, 3 ml of overnight bacteria cultures were harvested the next day and further subcultured in 50 ml of LB broth in the presence or absence of 0.1 M IPTG for indicated lengths of time. Bacteria concentrations were adjusted to the same level across samples via OD600 before centrifugation at 3,000g. Pellets were collected and resuspended in 150 µl of water. An equal amount of hot phenol (65 °C) was added, and the mixtures were vortexed vigorously. The mixtures were then incubated at 65 °C for 20 minutes, followed by chloroform extraction (400 µl) and centrifugation. The CAP was detected by alcian blue staining as previously reported64,65,66. In brief, after SDS–PAGE electrophoresis (4–20% gradient), the gel was fixed in fixing solution (25% ethanol, 10% acetic acid in water) for 15 minutes while shaking at room temperature. The gel was then incubated in alcian blue solution (0.125% alcian blue in 25% ethanol, 10% acetic acid in water) at room temperature for 2 hours while shaking before de-stained overnight in fixing solution. CAP was visualized as alcian blue stained bands on the resulting gel.
Visualization of CAP using TEM
Bacteria were grown overnight in LB media with appropriate antibiotics before being processed for imaging. For EcN iCAP, a 1:100 dilution in LB with antibiotics was made the following day and grown in 37 °C shaker until OD600 = 0.1–0.4 (mid-log phase), and varying concentrations of IPTG were added for further incubation for 6 hours before being processed. The cultures were spun down at 300g for 10 minutes and embedded in 2% agarose. Each agarose gel fragment was cut into a cube with 2-mm edge and placed in a 1.5-ml centrifuge tube. The samples embedded in agarose were fixed and stained via protocols previously reported67. In brief, the samples were fixed with 2% paraformaldehyde and 2.5% glutaraldehyde in osmotically adjusted buffer (0.1 M sodium cacodylate, 0.9 M sucrose, 10 mM CaCl2, 10 mM MgCl2) with 0.075% ruthenium red and 75 mM lysine acetate for 20 minutes on ice. The samples were washed with osmotically adjusted buffer containing 0.075% ruthenium red twice and further fixed with 1% osmium tetroxide in osmotically adjusted buffer containing 0.075% ruthenium red for 1 hour on ice. The samples were washed three times in water with 5-minute incubation between each wash and dehydrated in increasing concentrations of ethanol (50%, 70% and 100%) on ice for 15 minutes per step. The samples were washed one more time in 100% ethanol and embedded in increasing concentrations of Spurr’s resin (33% and 66%) diluted in ethanol for 30 minutes per step and overnight in 100% Spurr’s resin. The samples were moved to fresh Spurr’s resin the next day and polymerized at 65 °C overnight before being sectioned using a Sorvall MT-2B Ultramicrotome to ~70 nm. The sample sections were placed on TEM grids (Ted Pella, 01800F) and stained using UranyLess (EMS). The sample grids were imaged using FEI Talos 200 TEM.
TEM image processing and data analysis of polysaccharide layer
The image processing of TEM images was performed using ImageJ, and the data analysis was done using MATLAB. Due to low signal-to-noise ratio of the TEM images resulting from thinly sectioned bacteria samples stained using ruthenium red, Gaussian blur was used to reduce the noise and help determine the boundary of the polysaccharide layer. The polysaccharide layer was selected and transformed into a binary image using the threshold function. Some portion of the boundary of the polysaccharide layer was manually outlined when the thresholding function could not determine where the boundary was. The resulting binary image of the polysaccharide layer was used to identify the centroid and measure distribution of polysaccharide thickness with respect to the centroid. For each sample, five representative images were used to measure the polysaccharide thickness, and the measurements were aggregated to form histograms. The resulting histograms were fitted with Gaussian curves to extract mean and standard deviation of polysaccharide layer thickness.
In vitro whole blood bactericidal assays
EcN, EcN ΔkfiC or EcN iCAP bacterial cultures were grown overnight in LB broth with appropriate antibiotics and IPTG concentrations. The cultures were spun down at 3,000g for 5 minutes and resuspended in 1 ml of sterile PBS. They were further normalized to an OD600 of 1 with sterile PBS. Next, 150 µl of blood from the single donor human whole blood or murine (BALB/c) whole blood (Innovative Research) was aliquoted into three wells per strain in a 96-well plate. Then, 1.5 µl of bacteria was added to each well and incubated at 37 °C. At various time points, the plate was taken out, and a serial dilution of each sample was prepared in PBS. The dilutions were plated on LB agar plates with erythromycin. The agar plates were incubated at 37 °C overnight and inspected the next day for CFU counting.
Phagocytosis assays
The phagocytosis assays were performed via protocols as previously reported68,69. In brief, BMDMs were thawed on a 15-cm non-TC-treated Petri dish and cultured in RPMI with 10% FBS and MCSF for 4 days before the experiment. On the fourth day, BMDMs were collected, counted and diluted to 2 × 10⁵ cells per milliliter in RPMI with 10% FBS (without antibiotics). Afterwards, 1 ml of the new mixture was plated per well (2 × 10⁵ cells) in a 24-well TC-treated plate and cultured overnight. Media in the 24-well BMDM plate were removed the next day, and 1 ml of EcN iCAP constitutively expressing green fluorescent protein (GFP) with or without IPTG induction resuspended in RPMI with 10% FBS without antibiotics was added into each well at a multiplicity of infection of 100. The co-culture was incubated for 30 minutes at 37 °C, followed by rigorous washing with PBS at least three times. Next, 1 ml of RPMI with 10% FBS and gentamicin (30 µg ml−1) was added to each well, followed by live imaging under confocal microscopy. The BMDMs were then lysed with 0.5% Triton X in PBS, and lysates were collected and plated on LB agar with erythromycin, followed by overnight incubation at 37 °C. Colonies were counted the next day. ImageJ was used to count the number of macrophages, engulfed bacterial cells and macrophages containing engulfed bacterial cells from the confocal images. The phagocytic index was calculated according to the following formula: phagocytic index = (total number of engulfed bacterial cells / total number of counted macrophages) × (number of macrophages containing engulfed bacterial cells / total number of counted macrophages) × 100.
Multiplexed cytokine assay of in vitro co-culture
For in vitro cytokine measurement, we used THP-1 cells (American Type Culture Collection (ATCC) TIB-202) co-cultured with bacteria. THP-1 cells were maintained in RPMI-1640 supplemented with 10% FBS, 2 mM L-glutamine, 100 µg ml−1 of streptomycin, 100 µg ml−1 of penicillin and 0.1% mercaptoethanol at 37 °C and 5% CO2. Cells were passaged every 72 hours and maintained inside a tissue culture incubator at 37 °C and 5% CO2. For cell quantification and viability analysis, cells were stained using trypan blue stain. For co-culture, THP-1 cells were resuspended at a concentration of 1 × 10⁶ cells per milliliter in RPMI-1640 supplemented with 10% FBS and 0.1% gentamycin. Next, 300 µl of cell suspension was transferred into each well of a 24-well plate, and 3 µl of each bacterial strain was then added to cell culture wells. Subsequently, the culture medium was harvested and centrifuged at 200g for 5 minutes to isolate THP-1 without causing cell death. Supernatant was then centrifuged at 3,000g for 5 minutes to remove bacteria. The resulting supernatant was analyzed for cytokine response. Immunology multiplexed assay was performed using Milliplex Human Cytokine/Chemokine panel (HCYTMAG-60K-PX29, EMD Millipore) according to the manufacturer’s instructions at the Biomarkers Core Laboratory in the Irving Institute for Clinical and Translational Research.
Animal models
All animal experiments were approved by the Institutional Animal Care and Use Committee (Columbia University, protocols ACAAAN8002 and AC-AAAZ4470). For tumor-bearing animals, euthanasia was required when the tumor burden reached 2 cm in diameter or after recommendation by the veterinary staff. Mice were blindly randomized into various groups. Animal experiments were performed on 6–8-week-old female BALB/c mice (Taconic Biosciences) unless otherwise noted. Tumor models were established with bilateral subcutaneous hind flank injection of mouse colorectal carcinoma CT26 cells (ATCC CRL-2638) or mammary fat pad injection of 4T1 luciferase mammary carcinoma cells (Kang, Princeton University). All cells were cultured in RPMI-1640 media (Gibco) supplemented with 10% FBS (Gibco) and 1% penicillin–streptomycin (CellGro) and maintained inside a tissue culture incubator at 37 °C and 5% CO2. The concentration for implantation of the tumor cells was 5 × 10⁷ cells per milliliter in RPMI (no phenol red). Cells were injected at a volume of 100 μl per flank, with each implant consisting of 5 × 10⁶ cells. Female transgenic MMTV-PyMT mice (Jackson Laboratory, FVB/N background, 6 weeks old), which develop mammary tumors, were also used. Tumors were grown to an average of approximately 400 mm3 before experiments. Tumor volume was quantified using calipers to measure the length, width and height of each tumor (V = L × W × H × 0.5). Because the z dimension of PyMT tumor is highly variable, total volume was calculated as length × width2 × 0.5. Volumes were normalized to pre-injection values to calculate relative or percent tumor growth on a per-mouse basis.
Bacterial administration for in vivo experiments
Overnight cultures of EcN, EcN ΔkfiC and EcN iCAP were grown in LB medium with the appropriate antibiotics and inducers. A 1:100 dilution in LB with appropriate antibiotics and inducers was made the following day and grown in a 37 °C shaker until OD600 = 0.1–0.4 (mid-log phase). Cultures were centrifuged at 3,000g for 10 minutes and washed three times with cold sterile PBS. The bacteria were then normalized to a desired OD600. Unless otherwise noted, i.v. injections were given through the tail vein at the dose of 5 × 10⁶ cells per milliliter (OD600 of 0.5) in PBS with a total volume of 100 µl per mouse. Intratumoral injections of bacteria were performed at a concentration of 5 × 10⁶ cells per milliliter with a total volume of 40 µl per tumor. Intraperitoneal injections were injected at varying concentrations in PBS with a total volume of 100 µl per mouse. For induction of TT production, AHL subcutaneous injection was given to mice daily at 10 µM concentration with a total volume of 500 µl per mouse. For in situ activation of iCAP, water containing 10 mM IPTG was given to mice 1 day after bacterial administration.
Biodistribution and in vivo animal imaging
All bacterial strains used in this study had integrated luxCDABE cassette that could be visualized by IVIS spectrum imaging system (PerkinElmer) and were quantified by Living Image software. Images and body weight of mice were obtained every day starting the day of bacterial administration until the study endpoint. At the study endpoint, mice were euthanatized by carbon dioxide, and the tumors and organs (spleen, liver and lungs) were extracted and imaged. They were later weighed and homogenized using a gentleMACS tissue dissociator (C Tubes, Miltenyi Biotec). Homogenates were serially diluted with sterile PBS and plated on LB agar plates with erythromycin and incubated overnight at 37 °C. Colonies were counted the next day.
ELISA, cytokine multiplexed assay and blood cell count of in vivo animal model
For in vivo cytokine measurement, mice were injected intravenously with each bacterial strain. Subsequently, blood was collected from the submandibular vein and centrifuged at 2,000g for 10 minutes in a refrigerated centrifuge at 4 °C. The resulting supernatant was collected and stored at −80 °C until analysis for cytokine response. TNFα was measured using a Quantikine ELISA Kit (R&D Systems) according to the manufacturer’s protocol, and immunology multiplexed assay was performed using Milliplex Mouse Cytokine/Chemokine panel (MCYTOMAG-70K-PMX, EMD Millipore) according to the manufacturer’s instructions at the Biomarkers Core Laboratory in the Irving Institute for Clinical and Translational Research. Neutrophil counts were measured by performing complete blood count on mouse whole blood.
Characterization of phage sensitivity of intratumoral bacteria
Mice bearing bilateral subcutaneous CT26 tumors were intravenously administered with each bacterial strain. Intratumoral bacteria was isolated after 2 days from supernatants of the homogenized tumors in 5 ml of PBS (15% glycerol). Next, 1 µl of each supernatant was added to 100 µl of LB in a 96-well plate (Corning) in triplicate for control and phage groups. Then, 1 µl of 108 PFU ΦK1-5 phage or PBS was added to each well appropriately. The samples were incubated at 37 °C with shaking in a Tecan plate reader, and the OD600 was measured every 20 minutes.
Statistical analysis
Statistical tests were performed in either GraphPad Prism 7.0 and 8.0 (Student’s t-test and ANOVA) or Microsoft Excel. The details of the statistical tests are indicated in the respective figure legends. When data were approximately normally distributed, values were compared using Student’s t-test, one-way ANOVA for single variable or two-way ANOVA for two variables. Mice were randomized into different groups before experiments.
Reporting Summary
Further information on research design is available in the Nature Research Reporting Summary linked to this article.
Data availability
All data supporting the results are available in the main text or the supplementary materials. Additional data are available from the corresponding author upon reasonable request. E. coli Nissle 1917 genome sequences were obtained from the National Center of Biotechnology Information under accession code NZ_CP022686.1. Source data are provided with this paper.
Code availability
Computational model derivation is described in the Supplementary Note. The MATLAB code used in this study is available from the corresponding author upon reasonable request.
References
Ruder, W. C., Lu, T. & Collins, J. J. Synthetic biology moving into the clinic. Science 333, 1248–1252 (2011).
Lam, K. N., Alexander, M. & Turnbaugh, P. J. Precision medicine goes microscopic: engineering the microbiome to improve drug outcomes. Cell Host Microbe 26, 22–34 (2019).
Riglar, D. T. et al. Engineered bacteria can function in the mammalian gut long-term as live diagnostics of inflammation. Nat. Biotechnol. 35, 653–658 (2017).
Mao, N., Cubillos-Ruiz, A., Cameron, D. E. & Collins, J. J. Probiotic strains detect and suppress cholera in mice. Sci. Transl. Med. 10, eaao2586 (2018).
Cagetti, M. G. et al. The use of probiotic strains in caries prevention: a systematic review. Nutrients 5, 2530–2550 (2013).
Nakatsuji, T. et al. A commensal strain of Staphylococcus epidermidis protects against skin neoplasia. Sci. Adv. 4, eaao4502 (2018).
Dickson, R. P., Erb-Downward, J. R. & Huffnagle, G. B. The role of the bacterial microbiome in lung disease. Expert Rev. Respir. Med. 7, 245–257 (2013).
Forbes, N. S. Engineering the perfect (bacterial) cancer therapy. Nat. Rev. Cancer 10, 785–794 (2010).
Zhou, S., Gravekamp, C., Bermudes, D. & Liu, K. Tumour-targeting bacteria engineered to fight cancer. Nat. Rev. Cancer 18, 727–743 (2018).
Flickinger, J. C., Jr., Rodeck, U. & Snook, A. E. Listeria monocytogenes as a vector for cancer immunotherapy: current understanding and progress. Vaccines (Basel) 6, 48 (2018).
Toso, J. F. et al. Phase I study of the intravenous administration of attenuated Salmonella typhimurium to patients with metastatic melanoma. J. Clin. Oncol. 20, 142–152 (2002).
Sanders, M. E. et al. Safety assessment of probiotics for human use. Gut Microbes 1, 164–185 (2010).
Yelin, I. et al. Genomic and epidemiological evidence of bacterial transmission from probiotic capsule to blood in ICU patients. Nat. Med. 25, 1728–1732 (2019).
Low, K. B. et al. Lipid A mutant Salmonella with suppressed virulence and TNFɑ induction retain tumor-targeting in vivo. Nat. Biotechnol. 17, 37–41 (1999).
Wang, C. Z., Kazmierczak, R. A. & Eisenstark, A. Strains, mechanism, and perspective: Salmonella-based cancer therapy. Int. J. Microbiol. 2016, 5678702 (2016).
Mitchell, M. J. et al. Engineering precision nanoparticles for drug delivery. Nat. Rev. Drug Discov. 20, 101–124 (2021).
Anselmo, A. C., McHugh, K. J., Webster, J., Langer, R. & Jaklenec, A. Layer-by-layer encapsulation of probiotics for delivery to the microbiome. Adv. Mater. 28, 9486–9490 (2016).
Li, Z. H. et al. Biofilm-inspired encapsulation of probiotics for the treatment of complex infections. Adv. Mater. 30, e1803925 (2018).
Chen, W. et al. Bacteria-driven hypoxia targeting for combined biotherapy and photothermal therapy. ACS Nano 12, 5995–6005 (2018).
Cao, Z., Wang, X., Pang, Y., Cheng, S. & Liu, J. Biointerfacial self-assembly generates lipid membrane coated bacteria for enhanced oral delivery and treatment. Nat. Commun. 10, 5783 (2019).
Cao, Z., Cheng, S., Wang, X., Pang, Y. & Liu, J. Camouflaging bacteria by wrapping with cell membranes. Nat. Commun. 10, 3452 (2019).
Qiao, Y. et al. Engineered algae: a novel oxygen-generating system for effective treatment of hypoxic cancer. Sci. Adv. 6, eaba5996 (2020).
Hu, Q. L. et al. Engineering nanoparticle-coated bacteria as oral DNA vaccines for cancer immunotherapy. Nano Lett. 15, 2732–2739 (2015).
Cress, B. F. et al. Masquerading microbial pathogens: capsular polysaccharides mimic host-tissue molecules. FEMS Microbiol. Rev. 38, 660–697 (2014).
Sonnenborn, U. Escherichia coli strain Nissle 1917-from bench to bedside and back: history of a special Escherichia coli strain with probiotic properties. FEMS Microbiol. Lett. 363, fnw212 (2016).
Burns, S. M. & Hull, S. I. Comparison of loss of serum resistance by defined lipopolysaccharide mutants and an acapsular mutant of uropathogenic Escherichia coli O75:K5. Infect. Immun. 66, 4244–4253 (1998).
Hafez, M. et al. The K5 capsule of Escherichia coli strain Nissle 1917 is important in mediating interactions with intestinal epithelial cells and chemokine induction. Infect. Immun. 77, 2995–3003 (2009).
Hafez, M., Hayes, K., Goldrick, M., Grencis, R. K. & Roberts, I. S. The K5 capsule of Escherichia coli strain Nissle 1917 is important in stimulating expression of Toll-like receptor 5, CD14, MyD88, and TRIF together with the induction of interleukin-8 expression via the mitogen-activated protein kinase pathway in epithelial cells. Infect. Immun. 78, 2153–2162 (2010).
Nzakizwanayo, J. et al. Disruption of Escherichia coli Nissle 1917 K5 capsule biosynthesis, through loss of distinct kfi genes, modulates interaction with intestinal epithelial cells and impact on cell health. PLoS ONE 10, e0120430 (2015).
Wang, Z., Dordick, J. S. & Linhardt, R. J. Escherichia coli K5 heparosan fermentation and improvement by genetic engineering. Bioeng. Bugs 2, 63–67 (2011).
Whitfield, C. & Roberts, I. S. Structure, assembly and regulation of expression of capsules in Escherichia coli. Mol. Microbiol. 31, 1307–1319 (1999).
Na, D. et al. Metabolic engineering of Escherichia coli using synthetic small regulatory RNAs. Nat. Biotechnol. 31, 170–174 (2013).
Xie, Y., Wahab, L. & Gill, J. J. Development and validation of a microtiter plate-based assay for determination of bacteriophage host range and virulence. Viruses 10, 189 (2018).
Griffiths, G. et al. Characterization of the glycosyltransferase enzyme from the Escherichia coli K5 capsule gene cluster and identification and characterization of the glucuronyl active site. J. Biol. Chem. 273, 11752–11757 (1998).
Leroux, M. & Priem, B. Chaperone-assisted expression of KfiC glucuronyltransferase from Escherichia coli K5 leads to heparosan production in Escherichia coli BL21 in absence of the stabilisator KfiB. Appl. Microbiol. Biotechnol. 100, 10355–10361 (2016).
Le Tourneau, C., Lee, J. J. & Siu, L. L. Dose escalation methods in phase I cancer clinical trials. J. Natl Cancer Inst. 101, 708–720 (2009).
Aston, W. J. et al. A systematic investigation of the maximum tolerated dose of cytotoxic chemotherapy with and without supportive care in mice. BMC Cancer 17, 684 (2017).
Nemzek, J. A., Hugunin, K. M. & Opp, M. R. Modeling sepsis in the laboratory: merging sound science with animal well-being. Comp. Med. 58, 120–128 (2008).
Harimoto, T. et al. Rapid screening of engineered microbial therapies in a 3D multicellular model. Proc. Natl Acad. Sci. USA 116, 9002–9007 (2019).
Fedorec, A. J. H. et al. Two new plasmid post-segregational killing mechanisms for the implementation of synthetic gene networks in Escherichia coli. iScience 14, 323–334 (2019).
Roberts, N. J. et al. Intratumoral injection of Clostridium novyi-NT spores induces antitumor responses. Sci. Transl. Med. 6, 249ra111 (2014).
Nemunaitis, J. et al. Pilot trial of genetically modified, attenuated Salmonella expressing the E. coli cytosine deaminase gene in refractory cancer patients. Cancer Gene Ther. 10, 737–744 (2003).
Charbonneau, M. R., Isabella, V. M., Li, N. & Kurtz, C. B. Developing a new class of engineered live bacterial therapeutics to treat human diseases. Nat. Commun. 11, 1738 (2020).
Silverstein, M. J., DeKernion, J. & Morton, D. L. Malignant melanoma metastatic to the bladder. Regression following intratumor injection of BCG vaccine. JAMA 229, 688 (1974).
Kocijancic, D. et al. Local application of bacteria improves safety of Salmonella-mediated tumor therapy and retains advantages of systemic infection. Oncotarget 8, 49988–50001 (2017).
Kienle, G. S. Fever in cancer treatment: Coley’s therapy and epidemiologic observations. Glob. Adv. Health Med. 1, 92–100 (2012).
Copeland, S. et al. Acute inflammatory response to endotoxin in mice and humans. Clin. Diagn. Lab. Immunol. 12, 60–67 (2005).
Augustin, L. B. et al. Salmonella enterica Typhimurium engineered for nontoxic systemic colonization of autochthonous tumors. J. Drug Target 29, 294–299 (2021).
Chien, T. et al. Enhancing the tropism of bacteria via genetically programmed biosensors. Nat. Biomed. Eng. 6, 94–104 (2021).
Din, M. O. et al. Synchronized cycles of bacterial lysis for in vivo delivery. Nature 536, 81–85 (2016).
Zhao, M. et al. Tumor-targeting bacterial therapy with amino acid auxotrophs of GFP-expressing Salmonella typhimurium. Proc. Natl Acad. Sci. USA 102, 755–760 (2005).
Chan, C. T., Lee, J. W., Cameron, D. E., Bashor, C. J. & Collins, J. J. ‘Deadman’ and ‘Passcode’ microbial kill switches for bacterial containment. Nat. Chem. Biol. 12, 82–86 (2016).
Zheng, D. W. et al. Optically-controlled bacterial metabolite for cancer therapy. Nat. Commun. 9, 1680 (2018).
van Pijkeren, J. P. et al. A novel Listeria monocytogenes-based DNA delivery system for cancer gene therapy. Hum. Gene Ther. 21, 405–416 (2010).
Lemire, S., Yehl, K. M. & Lu, T. K. Phage-based applications in synthetic biology. Annu. Rev. Virol. 5, 453–476 (2018).
Tahoun, A. et al. Capsular polysaccharide inhibits adhesion of Bifidobacterium longum 105-A to enterocyte-like Caco-2 cells and phagocytosis by macrophages. Gut Pathog. 9, 27 (2017).
Duong, M. T., Qin, Y., You, S. H. & Min, J. J. Bacteria–cancer interactions: bacteria-based cancer therapy. Exp. Mol. Med. 51, 1–15 (2019).
Lebeer, S., Vanderleyden, J. & De Keersmaecker, S. C. Host interactions of probiotic bacterial surface molecules: comparison with commensals and pathogens. Nat. Rev. Microbiol. 8, 171–184 (2010).
Sorg, R. A., Gallay, C., Van Maele, L., Sirard, J. C. & Veening, J. W. Synthetic gene-regulatory networks in the opportunistic human pathogen Streptococcus pneumoniae. Proc. Natl Acad. Sci. USA 117, 27608–27619 (2020).
Siggins, M. K. et al. Extracellular bacterial lymphatic metastasis drives Streptococcus pyogenes systemic infection. Nat. Commun. 11, 4697 (2020).
Yoo, S. M., Na, D. & Lee, S. Y. Design and use of synthetic regulatory small RNAs to control gene expression in Escherichia coli. Nat. Protoc. 8, 1694–1707 (2013).
Datsenko, K. A. & Wanner, B. L. One-step inactivation of chromosomal genes in Escherichia coli K-12 using PCR products. Proc. Natl Acad. Sci. USA 97, 6640–6645 (2000).
Hsieh, P. F. et al. Lipopolysaccharide O1 antigen contributes to the virulence in Klebsiella pneumoniae causing pyogenic liver abscess. PLoS ONE 7, e33155 (2012).
Hsieh, P.-F., Lin, H.-H., Lin, T.-L., Chen, Y.-Y. & Wang, J.-T. Two T7-like bacteriophages, K5-2 and K5-4, each encodes two capsule depolymerases: isolation and functional characterization. Sci. Rep. 7, 4624 (2017).
Moller, H. J., Heinegard, D. & Poulsen, J. H. Combined alcian blue and silver staining of subnanogram quantities of proteoglycans and glycosaminoglycans in sodium dodecyl sulfate-polyacrylamide gels. Anal. Biochem. 209, 169–175 (1993).
Zamze, S. et al. Recognition of bacterial capsular polysaccharides and lipopolysaccharides by the macrophage mannose receptor. J. Biol. Chem. 277, 41613–41623 (2002).
Hammerschmidt, S. et al. Illustration of pneumococcal polysaccharide capsule during adherence and invasion of epithelial cells. Infect. Immun. 73, 4653–4667 (2005).
Sokolovska, A., Becker, C. E. & Stuart, L. M. Measurement of phagocytosis, phagosome acidification, and intracellular killing of Staphylococcus aureus. Curr. Protoc. Immunol. 99, 14.30.1–14.30.12 (2012).
Drevets, D. A., Canono, B. P. & Campbell, P. A. Measurement of bacterial ingestion and killing by macrophages. Curr. Protoc. Immunol. 109, 14.6.1–14.6.17 (2015).
Acknowledgements
We thank I. Molineux for providing ΦK1-5 phage and the K1 and K5 E. coli strains. We thank K. Uryu at EMSCOPIC for technical support. We appreciate the support from the Biomarkers Core Laboratory at the Irving Institute for Clinical and Translational Research, home to Columbia University’s Clinical and Translational Science Award Program hub. This work was supported by DoD LC160314 (T.D.), DoD BC160541 (T.D.), NIH R01CA249160 (T.D.), NIH U01CA247573 (T.D.), NIH F99CA253756 (T.H.) and the Honjo International Foundation Scholarship (T.H.).
Author information
Authors and Affiliations
Contributions
T.H., J.H., K.W.L. and T.D. conceived and designed the study. T.H., J.H., Y.-Y.C., J.I., J.Z., F.L., S.C. and C.N. performed in vitro characterization. T.H., J.H., Y.-Y.C., C.C., K.G., N.H. and K.P. performed in vivo experiments. T.H., J.H., N.H. and T.D. developed computational modeling. T.H., J.H., N.A., K.W.L. and T.D. wrote the manuscript.
Corresponding authors
Ethics declarations
Competing interests
T.H., J.H., K.W.L. and T.D. have filed a provisional patent application with the US Patent and Trademark Office related to this work (01001/009982). The remaining authors declare no competing interests.
Peer review
Peer review information
Nature Biotechnology thanks In Young Hwang and the other, anonymous, reviewer(s) for their contribution to the peer review of this work.
Additional information
Publisher’s note Springer Nature remains neutral with regard to jurisdictional claims in published maps and institutional affiliations.
Supplementary information
Supplementary Information
Supplementary Figs. 1–24, Tables 1–3, Note and Figure Source Data.
Supplementary Table 3
Relevant gene sequences used in this study.
Source data
Source Data Fig. 3
Unprocessed gels.
Rights and permissions
Open Access This article is licensed under a Creative Commons Attribution 4.0 International License, which permits use, sharing, adaptation, distribution and reproduction in any medium or format, as long as you give appropriate credit to the original author(s) and the source, provide a link to the Creative Commons license, and indicate if changes were made. The images or other third party material in this article are included in the article’s Creative Commons license, unless indicated otherwise in a credit line to the material. If material is not included in the article’s Creative Commons license and your intended use is not permitted by statutory regulation or exceeds the permitted use, you will need to obtain permission directly from the copyright holder. To view a copy of this license, visit http://creativecommons.org/licenses/by/4.0/.
About this article

Cite this article
Harimoto, T., Hahn, J., Chen, YY. et al. A programmable encapsulation system improves delivery of therapeutic bacteria in mice. Nat Biotechnol 40, 1259–1269 (2022). https://doi.org/10.1038/s41587-022-01244-y
Received:
Accepted:
Published:
Issue Date:
DOI: https://doi.org/10.1038/s41587-022-01244-y
This article is cited by
-
Spatially selective delivery of living magnetic microrobots through torque-focusing
Nature Communications (2024)
-
Bioinspired oral delivery devices
Nature Reviews Bioengineering (2023)
-
Bacterial therapies at the interface of synthetic biology and nanomedicine
Nature Reviews Bioengineering (2023)
-
Engineering the gut microbiome
Nature Reviews Bioengineering (2023)
-
Sub-1.4 cm3 capsule for detecting labile inflammatory biomarkers in situ
Nature (2023)
