
Abstract
In data-driven materials design where the target materials have limited data, the transfer machine learning from large known source materials, becomes a demanding strategy especially across different crystal structures. In this work, we proposed a deep transfer learning approach to predict thermodynamically stable perovskite oxides based on a large computational dataset of spinel oxides. The deep neural network (DNN) source domain model with “Center-Environment” (CE) features was first developed using the formation energy of 5329 spinel oxide structures and then was fine-tuned by learning a small dataset of 855 perovskite oxide structures, leading to a transfer learning model with good transferability in the target domain of perovskite oxides. Based on the transferred model, we further predicted the formation energy of potential 5329 perovskite structures with combination of 73 elements. Combining the criteria of formation energy and structure factors including tolerance factor (0.7 < t ≤ 1.1) and octahedron factor (0.45 < μ < 0.7), we predicted 1314 thermodynamically stable perovskite oxides, among which 144 oxides were reported to be synthesized experimentally, 10 oxides were predicted computationally by other literatures, 301 oxides were recorded in the Materials Project database, and 859 oxides have been first reported. Combing with the structure-informed features the transfer machine learning approach in this work takes the advantage of existing data to predict new structures at a lower cost, providing an effective acceleration strategy for the expensive high-throughput computational screening in materials design. The predicted stable novel perovskite oxides serve as a rich platform for exploring potential renewable energy and electronic materials applications.
Introduction
The experimental design and development of new materials has always been a great challenge due to long experimental iteration cycles, large resource consumption, and uncertainty of results. Predicting the stability of crystals is one of the central tasks in materials science1. Although high-throughput density functional theory (DFT) computational screening can be used to predict the stability of crystals and guide the experimental synthesis of new materials at the theoretical level, it requires a huge amount of expensive computation2,3,4,5. As the fourth paradigm of scientific research, machine learning6 (ML) methods stand out by conducting machine learning from large computational and/or experimental material data and learning the underlying complex relationships, providing a new tool to discover efficiently new materials with target performance7,8,9,10,11,12.
The extensive efforts have been devoted to establish a relationship between the materials structures and their target properties13,14,15. Schmidt et al. combined DFT and ML methods to screen out about 500 thermodynamically stable structures from 250,000 cubic perovskite systems16. Kim et al. predicted the possible synthesizability of 11763 ABB′O3 structures by using machine learning regression and classification algorithm, which was validated by DFT calculation17. Xie et al. established a crystal graph convolutional neural networks for accurate and interpretable prediction of material properties, and predicted the formation energy of 28,046 crystal structures with mean absolute error (MAE) of 0.039 eV/atom18. Nevertheless, it is more common that there are fewer data required to establish the machine learning model with sufficiently high prediction accuracy. To overcome this, transfer learning19,20,21,22,23,24 serves as a preferred methodology by taking advantage of available larger dataset in different but similar materials. The central idea of transfer learning is to train a source domain model with an existing large dataset, and then transfer it to the small target domain data via certain constraint rules with a good generalization ability on the target domain data25, thereby saving the time of generating new data for target materials. Transfer learning can be generally expressed as:26 Given the source domain \({\Delta}_{\rm{s}}\) and the learning task \({\bf{T}}_{\rm{s}}\), the target domain \({\Delta}_{\rm{t}}\) and the learning task \({{\mathbf{T}}}_{{\rm{t}}}\), the purpose of transfer learning is to obtain the knowledge in the source domain \({\Delta}_{\rm{s}}\) and the learning task \({{\mathbf{T}}}_{{\rm{s}}}\) to help improve the learning of the prediction function \({f}_{\rm{t}}(\,{\bullet}\,)\) in the target domain, where \({{\Delta}}_{{\rm{s}}} \ne{{\Delta}}_{{\rm{t}}}\) or \({{\mathbf{T}}}_{{\rm{s}}} \ne {{\mathbf{T}}}_{{\rm{t}}}\).
Yamada et al.27 developed a comprehensive pre-training model library called XenonPy.MDL, by inputting data sets of different material properties into neural networks or some other types of models. This library now contains more than 140000 models for the physical, chemical, electronic, thermodynamic, and mechanical properties of organic small molecules, polymers, and inorganic crystalline materials. For example, Jha et al. used the transfer learning method trained only with the composition of the materials to predict the formation energy of crystal structure, in which about 340000 structures in OQMD28 (The Open Quantum Materials Database) were used to train the source domain model, and then used the source domain model to predict the formation energy of 1643 experimental structures through transfer learning, and the prediction results was comparable to the MAE of DFT-computation25. Li et al. proposed a transfer learning based approach that achieved a high accurate machine learning model trained with elemental descriptors. Then, the screening model was applied to filter out new promising perovskite materials out of 21,316 hypothetical perovskite structures with a large portion of them confirmed by existing literatures29. Williams et al. have shown that transfer learning can be utilized to speed up the training of models on new properties by taking advantage of the implicit relationships between material properties30.
Previous ML studies mostly construct features using the constituent elements or the elementary physicochemical properties of chemical components while only a few of feature models incorporate the structure information. The structure-informed features are mainly graph-based features and Voronoi polyhedron features. Chen and Ong et al.31 developed AtomSets feature model that was encoded by MEGNet trained in a big dataset (130,000 data from OQMD28,32). The framework underlying the feature construction is graph theory that originally had only node and connectivity information without distances between nodes. The distance, angle, and dihedral angle information are incorporated later in more recent works33,34. These graph-based features treat all bonds or other structure characteristics uniformly without distinction, which would introduce redundant complexity and parameters that require a large dataset and deep learning approach. The graph-based features in transfer learning also suffer the problems of non-equivalent transfer of graph representation, complex architecture, implicit information transfer, and dependence of pretrained big-data models.
Jha and Agrawal et al.35 developed the IRNet transfer learning model based on Voronoi tessellations features. The Voronoi polyhedron representation describe well the effects of the first shell on the center atom but normally treat all center atoms uniformly and hardly consider the environment atoms beyond the first shell neighbors. In some simple cases, the “Center-Environment” (CE) feature models11,36,37,38 (more details described later) may capture similar structure characteristics since the center-environment interatomic distances of CE can be considered as the length of normal vectors of faces of Voronoi polyhedron.
The key difference between this transfer learning (TL) work and the TL works in literatures (e.g., AtomSets/MEGNet and Voronoi representations) lie in the feature construction model. In this work, we developed “Center-Environment” (CE) feature model that adopts core-shell physical concept to represent the local structural information. Firstly, CE defines the critical center atoms and their surrounding environment atoms. Then the elementary physicochemical features of elements or pure substances are projected onto the center-environment atom sets via linear combinations with the reciprocal distances as weights. Conceptually, CE representation is a type of attention-focused structure model that focuses on the critical sites and the environment atom effects. For example, A and B were defined as the center atoms and O are environment atoms in AB2O4 and ABO3, which capture the key features of metal-oxygen bonds (AO and BO) in oxides. Moreover, the center-environment bonds are distance dependent that incorporate the refined local structure characteristics. The AB correlation is second important and taken into account by multiple centers including both A and B. The OO bonds are less important or invariant in the structures thus ignored in the CE models. By the adoption of CE attention-focus mechanism, both the non-deep and deep machine learning models can be used with CE features that require simpler architectures with less parameters and achieve similar or even better prediction accuracy in both small and big datasets.
In the present study, we proposed a transfer learning approach across two different crystal structures using structure-informed feature models: learn from spinel oxides and predict the stability of perovskite oxides. As the crystal type with the second largest number of crystal structures in the experimental database, perovskite39,40 has been highly valued by researchers for its large structural types, substitutability of anion and cation, and rich physical and chemical properties. Perovskite oxide materials are widely used in solar cells41, solid oxide fuel cells42,43,44, metal-air batteries45, photoelectrochemical water-splitting46,47, oxygen evolution reaction (OER)48,49, oxygen reduction reaction (ORR)50,51, hydrogen evolution reaction (HER)52,53, electrocatalytic CO2 reduction (CO2RR)54, and many other fields. However, compared with the huge chemical space of perovskite oxides, the structures and energies studied by first-principles calculations are relatively limited that hinders the discovery of new perovskite materials.
Herein, we demonstrate a high-throughput strategy of predicting the stability of perovskite oxides via deep transfer learning method with “Center-Environment” (CE) feature models proposed recently11,36,37,38. The advantage of CE feature model is to contain both the composition and structure information as inputs to ML algorithms, a key to ensure the transferability across the different types of crystal structures. The existing massive spinel structure formation energy data was used to establish a source machine learning model and then transferred to a small target dataset of perovskite structures to predict new stable unknown perovskite oxides. Firstly, 73 elements in the periodic table were used to replace the cations in perovskite, and 5329 cubic perovskite structures were generated. Then, the deep artificial neural network (DNN)55 algorithm combining with the CE features was used to establish a transfer learning model (DNN-CE) from a large amount of formation energy data of spinel structures to predict the formation energy of the hypothetical perovskite oxides. The proposed strategy paves a new avenue for developing and designing new materials from existing materials datasets.
Results
Effect of center atoms in prediction performance
To examine the effects of selected center atoms in their prediction performance, four separate DNN-CE models with different center atoms were established. They consist of two single-center DNN-CE models centered on A and B cations, respectively (dubbed CE-A and CE-B), a double-center DNN-CE model with A and B cations as the center atoms (dubbed CE-AB), and a three-center DNN-CE model with A, B cations and O anions as the center atoms (dubbed CE-ABO). We split the datasets of source and target domains randomly into training and test datasets in the ratio of 9:1. Then the ML models were optimized on the training sets following a 10-fold cross-validation procedure. The averaged results over the 10 runs were used to evaluate the performance of both training and test datasets. Since the data were scrambled randomly in each run, the distributions of elements (A and B) in the split datasets can be approximately regarded as uniform. The prediction errors of the various models were close each other, indicating that the optimal model was representative statistically.
Figure 1 shows the results of comparison of different DNN-CE models with different center atoms in their prediction performance. In each DNN-CE model, four different machine learning models were employed to give their prediction on formation energies of spinel or perovskite oxides. Modelspinel and Modelperovskite represent the prediction results of spinel and perovskite structures trained with their own formation energy data in the machine learning model. ModelSP represents the prediction results of perovskite formation energy using the source domain model trained by spinel data (without changing any model parameters). ModelTL represents the predicted results of the transfer learning model (from spinel to perovskite). The error bars in Fig. 1 are the <MAE> of predicted Ef of holdout test datasets using the 10 ML models trained during the 10-fold cross-validations. The evaluation of different machine learning models will be discussed in the next section. Here we focus on the effects of different DNN-CE models. As shown in Fig. 1, the single-center DNN-CE models CE-A and CE-B have similar prediction performance except the case of source domain Modelspinel (red square dots). The prediction performance from single-center DNN-CE model is far worse than the two-center DNN-CE model CE-AB and the three-center DNN-CE model CE-ABO. The DNN-CE model in this study only considers the nearest neighbor environmental atoms. If only one center atom (A or B cation) is considered, the structural information of the other cations in the crystal structure will be completely lost resulting in poor prediction. The two-center DNN-CE model CE-AB and the three-center DNN-CE model CE-ABO have similar prediction performance. This is due to the fact that the two-center model already appropriately includes the structural information of spinel or perovskite oxides. The addition of oxygen as center atom surrounded by A or B cation only generates redundant information which may lead to overfitting of the DNN-CE model. To simplify our results, the following data will be given using two-center DNN-CE model CE-AB.

Performance (<MAE>) of prediction of various test datasets using the CE feature models with different center atom definitions.
As shown in Fig. 1, the MAE of CE-B model (Modelspinel) for spinel oxides is much smaller than that of CE-A model. The performance difference can attribute to that the number of B sites (octahedral centers) is twice that of the A sites (tetrahedral centers) in the AB2O4 spinel structure. Therefore, the CE-B model with B site centers capture more structure information than the CE-A model with A site centers, leading to the CE-B models with better accuracy than the CE-A models. For the ABO3 perovskite structures with the same number of A and B sites, the CE-A and CE-B models (Modelperovskite, ModelSP, and ModelTL) had similar MAE. Moreover, incorporating both A and B sites into the CE models significantly improved the accuracy while the introduction of the additional O sites had little benefits because O sites are invariant through the database. This again supports that the CE models are able to capture the structural characteristics with attention-focused mechanisms that contribute to the accuracy of ML prediction. These comparisons suggest that the CE feature models with attention-focused mechanisms representing the structural characteristics are critical to accurate ML modeling with less complexity. On the other hand, the feature models with uniform structural information without characteristics focus may have redundant complexity with little benefits to ML model accuracy.
Transfer learning
As mentioned above, there are in total four machine learning models used to predict formation energy. The first two (denoted as Modelspinel, Modelperovskite) used calculated spinel or perovskite dataset from scratch to train DNN-CE model for predicting their respective formation energy. Since the model parameters were initialized randomly, all the features were learned from the input training data. Figure 2 shows the results of 10-fold cross-validation on two datasets and evaluation of the model on an independent test set. The corresponding scatter plots of calculated (DFT) and predicted (machine learning) values are given in Fig. 2a, b. Modelspinel and Modelperovskite achieved the prediction accuracy of 0.98 and 0.95 respectively, the <MAE> from perovskite data set is 0.132 eV/atom, which is almost twice as that of 0.072 eV/atom from spinel data set. The great difference in <MAE> comes from the large difference in the size of the source domain and target domain data sets, which is in line with the finding that the size of the training data set has a significant impact on the performance of the deep learning model in the previous reports56,57.

a Spinel oxides (source domain Modelspinel), b perovskite oxides (target domain Modelperovskite), c direct prediction of perovskite oxides using the source domain model (ModelSP), and d transfer learning model (ModelTL). The results were averaged over 10 runs of the 10-fold cross-validation in the training process.
The DNN-CE model (ModelSP) was trained using the spinel oxide data in the source domain and used directly without changing any model parameters to predict the formation energies of the perovskite oxides in the target domain (Fig. 2c). The ModelSP had a large <MAE> of 0.514 eV/atom, indicating that the DNN-CE model learnt from one type of crystal structure is hard to be used directly to predict another material with a different crystal structure. The transfer learning model (ModelTL) was further developed by fine tuning the model parameters using the small dataset of the target domain. The adoption of the transfer learning improved the prediction accuracy greatly indicated by the drop of <MAE> from 0.514 (ModelSP) to 0.106 (ModelTL) eV/atom (Fig. 2c, d). Moreover, the transferred learning model (ModelTL) also exhibited lower <MAE> than the model (Modelperovskite) trained solely from the limited perovskite dataset in the target model (0.132 eV/atom). These results suggest that the DNN-CE model trained on a large dataset can be applied to a different crystal structure with the help of transfer learning approach. The transfer learning method can effectively solve the problems of the bad accuracy of ML models trained on a small dataset and the poor transferability of ML models trained on a large dataset.
We used the 10 models obtained from the 10-fold cross validation training process to predict the Ef of the test datasets and took the averaged MAE results as performance metric. These averaged MAE ( < MAE > ) were used for performance evaluation since averaged accuracy are statistically more representative to reflect the ML model quality than the single model with the accidentally best accuracy. When we apply the ML model to predict the Ef in screening process, we chose the single optimal model with the best performance to ensure accuracy as much as possible.
In order to prove the advantages of DNN-CE feature representation in material property prediction, we compared the DNN-CE with Voronoi feature models58 that also incorporates composition and structure information via Voronoi polyhedron representation of crystal structures. The Voronoi feature models (DNN-Voronoi) were constructed via Magpie59 using the various datasets (Table 1 and Supplementary Fig. 2). As summarized in Table 1, the DNN-CE feature models exhibited better performance than the Voronoi feature models in most studied cases. The <MAE> of DNN-CE source domain models was 0.072 eV/atom better than that of the DNN-Voronoi models (0.116 eV/atom). The transfer learning models using CE features had <MAE > = 0.106 eV/atom, better than the Voronoi models (0.166 eV/atom). The DNN-CE models trained on the small target dataset (Modelperovskite) had a <MAE> of 0.132 eV/atom, better than the DNN-Voronoi models (<MAE > = 0.176 eV/atom). The direct prediction of perovskite oxides using the source domain model (ModelSP) with CE features had a <MAE> of 0.514 eV/atom, slightly larger than that with Voronoi features ((<MAE > = 0.495 eV/atom). In addition to the performance comparison between the CE and Voronoi features, we believe that the reciprocal distances in the CE representation play similar roles as the length of normal vectors of Voronoi polyhedron faces. Compared with Voronoi polyhedron, the CE representation is a more flexible framework that can include predefined environment atoms beyond the nearest neighbors. The structure-based DNN-CE model also performs much better than composition-based ElemNet model. The differences of R2 between the different models are relatively small and not appropriate to be used as the performance metric. MAE is more sensitive to model quality and has physical significance themselves.
The distribution of the formation energies predicted by transfer learning was plotted in Fig. 3 as the functions of the constitution elements at the A and B sites of all the 5329 perovskite oxides sorted by atom numbers. We found that the similar formation energies aggregated locally to form cluster-like patterns rather than sparse spot-like distributions in Fig. 3. These aggregated clustered patterns intuitively show that the constitution elements with close atom numbers normally form perovskite oxides with similar stability. In addition, except for a few cases, most of the aggregated clusters exhibit diagonal symmetry, indicating that similar stability can be achieved if the substitution elements are swapped between A and B sites. Specifically, rare earth elements are major constitute components that can stabilize perovskite oxides.

Heat map of formation energies of 5329 ABO3 perovskite oxide structures predicted by the transferred learning model in this work, containing 73 constitution elements at the A and B sites, respectively, sorted by the atom number.
Prediction of stable perovskites
The Goldschmidt tolerance factor t of perovskite materials has been widely accepted as an important empirical criterion for estimating the stability of perovskite structures60. The tolerance factor is defined as:
where rA, rB, and rX are the coordination-dependent Shannon’s ionic radii of the A-site cation, the octahedrally coordinated B cation, and the anion, respectively.
When predicting the formability of cubic perovskites, especially perovskite oxides, the tolerance factor was found to be quite instructive. A large number of studies show that the tolerance factor t in the range of about 0.7 ~ 1.19 corresponds to cubic perovskite structure. As shown in Fig. 4, these aggregated cluster patterns indicate that the constitution elements with the close atom numbers normally form the perovskite oxides with similar formability.

Heat map of tolerance factor of 5329 perovskite oxide structures calculated in this work, containing 73 constitution elements at the A and B sites, sorted by the atom number.
However, the tolerance factor t cannot always guarantee the correct prediction of the formation of perovskite structure. Another parameter, relating to the octahedral unit BO6, was proposed to evaluate whether the perovskite can be formed or not39. It is defined as:
To predict the stable perovskite oxides, we carried out multi-stage hierarchical screenings based on both structure and energy criteria as follows.
-
(1)
The structure criteria were first adopted to screen the candidate materials. Previous computational reports showed that most of the cubic perovskite structures have the tolerance factor t between 0.7–1.19 as well as the octahedral factor μ between 0.45–0.7061. Using the scatter plot of both the tolerance factor t and the octahedron factor μ, we can evaluate the synthesizability suggested by the two structure descriptors39,62. The 5329 ABO3 perovskite oxide structures are projected on the t-μ structure descriptor space together with the ML formation energy (Fig. 5). The first tier of screening used the tolerance factor t within the range between 0.7–1.1 and selected 2800 (52.5%) out of 5329 structures within the light blue belt along the vertical direction. Then the second tier of screening used the octahedral factor μ within the range between 0.45–0.7 and selected 1475 (52.7%) out of 2800 structures within the light-yellow belt along the horizontal direction. The cross section where the t and μ belts overlap covers the 1475 perovskite structures that satisfy both t and μ structure criteria. In total, 27.7% of 5329 structures were selected to satisfy the t and μ structure criteria.
Fig. 5: Tolerance factor (t) vs. octahedral factor (μ) scatter plot of perovskite oxide structures, where the colormap corresponds to the transfer learning predicted formation energy of perovskite structure. 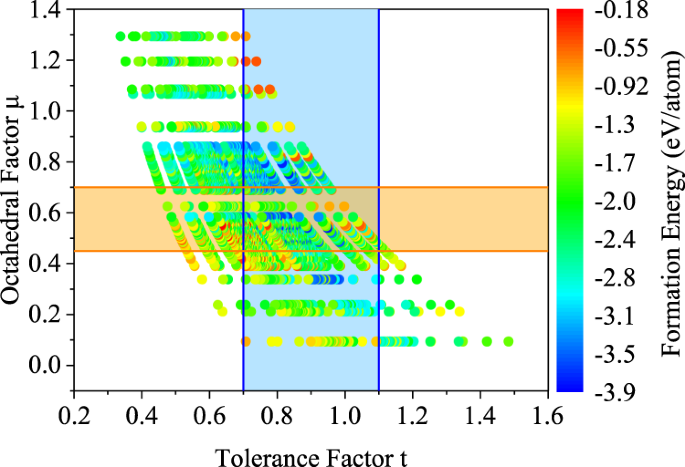
The light blue belt-shaped area in the vertical direction and the light-yellow belt-shaped area in the horizontal direction in the figure indicate that the tolerance factor between 0.7–1.1 and the octahedral factor between 0.45–0.7, respectively.
-
(2)
The energy criterion can reflect the chemical effects on the stability beyond the geometrical characteristics represented by the structure descriptors. The more negative formation energy (Ef) indicates relatively larger stability but there is no rigorous quantitative criterion that guarantees the successful experimental synthesis. The optimal transferred ML models predicted Ef of all 5329 structures lying between −3.88 and −0.19 eV/atom (Fig. 6a), among which 75% of Ef were distributed between −3 and −1 eV/atom. The numbers of ML predicted perovskite structures are six times larger than that of the small training dataset in the target domain while both datasets had similar normal probability distributions.
Fig. 6: Statistical distribution of the formation energy of perovskite structures predicted by machine learning and the screening process for stable perovskite structures. 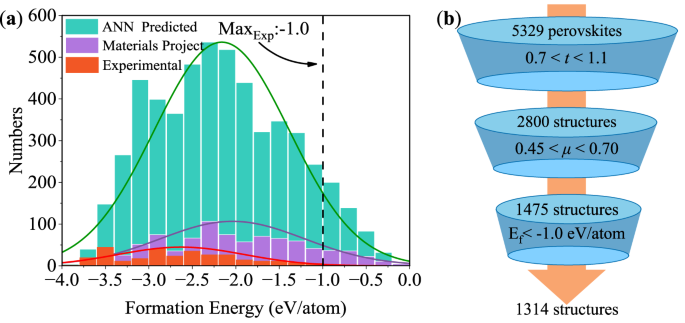
a Statistical histograms of formation energy (Ef) of perovskite oxide structures. The light green histogram represents the Ef of 5329 perovskite oxide structures predicted by the optimal transfer learning model (DNN-CE). The formation energy follows the normal distribution between −3.88 and −0.19 eV/atom. The purple histogram represents the DFT Ef of 855 perovskite oxides in the Materials Project database63. The orange histogram represents the DFT Ef of 315 perovskite oxides reported in the experimental literatures. b The screening pipeline of stable perovskite oxides based on the structure and energy criteria: The first tier of screening selected 2800 out of 5329 structures via tolerance factors t between 0.7–1.1. The second tier of screening selected 1476 out of 2800 structures via octahedral factors μ between 0.45–0.70. Finally, the third tier of screening selected 1314 out of 2800 structures via the formation energy (Ef < −1.0 eV/atom).


The statistical analysis shows that Ef of 315 known experimental structures lie between −3.75 and −0.59 eV/atom (Fig. 6a and Supplementary Table 2). 98.1% (309 out of 315) of known experimental perovskite oxides had Ef < −1.0 eV/atom, e.g, both NiMnO3 and BiCoO3 had Ef = −1.01 eV/atom (Supplementary Table 2). Therefore, we adopted Ef = −1.0 eV/atom as a screening criterion since this approximated upper limit covered the majority of known materials from the view of experimental synthesizability. The third tier of screening finally selected 1314 (89.1%) out of 1475 structures by Ef < −1.0 eV/atom (Fig. 6b). The screened 1314 perovskite oxides are listed in Supplementary Table 3. According to our best knowledge, among the proposed 1314 candidate structures, 144 oxides were synthesized experimentally before, 10 oxides were predicted by other computations, 301 oxides were found in the Materials Project database63, and 859 oxides have not been reported previously in the literatures.
The energy above hull (Ehull) is a more reliable criterion than Ef to evaluate the synthesizability because Ehull measures the relative energy compared with the relevant competing structures. The DFT calculations of Ehull are expensive and tedious since all relevant precursors or decomposed product materials in principle need to be calculated and compared. To validate the screening results, we took the Ehull from the OQMD database28,32 to confirm further the prediction by the ML formation energy in this work. It was found that 91.1% (1197 out of 1314) of candidate materials screened by the ML formation energy had Ehull < 0.92 eV/atom which is the second largest Ehull (NiTiO3) among the 315 known experimental structures in literature after excluding the abnormally largest Ehull = 1.39 eV/atom (NdCoO3). The positive Ehull criterion indicates that the materials can exist as metastable structures. Most of the proposed candidate materials had reasonably small Ehull relative to the reference of the known experimental structures. Therefore, the screening procedure based on the structure (t and μ) and energy (Ef) criteria in this work are efficient and reliable to predict the materials with potential large synthesizability.
Discussion
We demonstrated a high-throughput strategy to obtain stable perovskite structures by using deep transfer machine learning from the datasets of spinel structures assisted by the “Center-Environment” (CE) feature model. The intrinsically transferrable structural information between different crystal structures was captured successfully by the CE feature model. We used only 1/6 data set of perovskite oxides to fine-tune the parameters of the deep neural network transfer learning model that were pre-trained with a large number of existing data of spinel oxides. The prediction accuracy of the formation energy of perovskite structures by the transfer learning model DNN-CETL is <MAE > = 0.106 eV/atom, better than the <MAE> of 0.132 eV/atom by DNN-CEperoviskite without transfer learning, achieving good transferability and accuracy improvement.
Applying the transfer learning models, we predicted the formation energies of 5329 ABO3 perovskite structures containing 73 chemical elements at A and B cation sites. Using the criteria of predicted formation energy and structure factors tolerance factor (0.7 < t ≤ 1.1) and octahedron factor (0.45 < μ < 0.7), we predicted 1314 thermodynamically stable perovskite oxides - all structures with formation energies more negative than the averaged formation energies of the experimentally known structures, among which 144 oxides were indeed synthesized experimentally previously, 10 oxides were predicted by other computations, 301 oxides were found in the Materials Project database, and 859 oxides have never been reported previously in the public literatures and crystal structure databases. Using the structure-informed features the transfer machine learning approach in this work takes the advantage of accumulated existing data to predict new structures with different crystal symmetry at a lower cost, providing an effective acceleration strategy and improved accuracy over conventional machine learning and much more efficient than the expensive high-throughput first-principle computational screening. It is worth mentioning that a transfer learning approach across different crystal structures demonstrated in this study can be generalized to the prediction of other crystal structures, paving the way for efficient material design on the basis of prior knowledge. The predicted stable perovskite oxides are good candidates for further experimental synthesis and applications in renewable energies and advanced electronic devices.
Methods
The construction and verification of machine learning model for predicting the stability of perovskite by transfer learning includes four steps: (I) Generating spinel and perovskite structures to train the transfer learning model and calculating their formation energy by DFT methods; (II) Generating feature sets that describe the compositions and structures of spinel oxides and perovskite oxides using the CE feature model proposed in our previous work36. (III) Selecting the optimal algorithm from the set of candidate machine learning algorithms and training the machine learning model. (IV) Predicting the formation energy of new unlabeled perovskite outside the labeled target domain data set. The following sections will give a full description on each of the above steps required to build the transfer learning model in this work.
In addition, we used the python64 library Scikit-Learn65 for feature selection. The Keras66 library based on Tensorflow67 backend was used in all machine learning model training, evaluation, and prediction of new perovskite structures. The training datasets, project source code, and best model in this work have been uploaded into GitHub and can be downloaded freely.
Data set preparation
All the DFT calculations were conducted using the Vienna ab initio simulation package (ver. 5.4.4)68. The projector-augmented wave method69 was performed as the basis set with a cut-off energy of 520 eV and the Perdew-Burke-Ernzerhof (PBE) generalized gradient approximation (GGA) exchange-correlation functional70 was applied for all the structural optimizations. According to the k-point convergence test, the integrations in the Brillouin zone were performed using 7 × 7 × 7 k-points. All geometric structures including cell box were fully relaxed until the total energy change between two electronic self-consistent steps were less than 10−5 eV using the conjugate gradient method, then all the ion positions were allowed to relax until a force convergence of 0.02 eV/Å for each loop.
The general chemical formula of the normal spinel oxide is AB2O4 with the space group \(Fd\bar{3}m\). As shown in Fig. 7a, the A and B cations are located in the tetrahedral center and octahedral center surrounded by oxygen ions, respectively. In our previous work36, the extensive first-principles high-throughput calculations were performed on 5329 spinel structures generated by assigning 73 elements (Fig. 7c) on the A and B sites of cubic normal spinel oxide AB2O4 and the formation energies of 5172 convergent structures were obtained. These 5172 formation energies of spinel oxide structures were therefore used as the source domain data in the present work. The formation energy of a compound Ef is calculated according to the following equation:
where Espinel is the total energy of spinel oxide structure; EA and EB is the average total energy per atom in the unit cell of pure crystal of A and B site elements, respectively; \({E}_{{O}_{2}}\) is the total energy of oxygen molecule; nA, nB, and nO are the number of the A site atom, B site atom, and oxygen atoms in the spinel structure, respectively; N is the total number of atoms in the primitive cell of spinel oxides.

The crystal structures of a spinel oxide and b perovskite oxide studied in this work. A and B in a and b represent cationic sites. c The 73 colored elements in the periodic table were studied in this work, while those with a gray background were not considered.
As shown in Fig. 7b, the perovskite oxide structure with the chemical formula ABO3 can be described as A cations surrounded by 12 anions (usually oxygen) in cubo-octahedral coordination and B cations surrounded by six anions in octahedral coordination. Typically, the A site is occupied by alkali metals (Li, Na, etc.), alkaline earth metals (Ba, Sr, etc.) or rare earth metals (La, Pr, etc.) with a larger ion radius, and the B site is occupied by transition metal atoms (Mn, Co, Fe, Ni, etc.). Applying the construction methodology as described above, 5329 perovskite structures were generated by replacing the A and B cation sites in the perovskite oxide structure with the same 73 elements. 855 of them that have been included in the Materials Project63 crystal structure database with reported formation energies were used as the target domain data.
Feature engineering
The CE feature engineering combines the fundamental properties of the chemical element and pure substances, the composition and structural information of the crystal structure. For each constituent element, 56 elementary properties such as ion radius, atomic number, electronegativity (see Supplementary Table 1 of the supporting information) were selected. The CE feature model36 was then used to construct a machine learning training data set from the selected basic properties. Chemical descriptors containing crystal geometry information make a great contribution to the accuracy of machine learning prediction71. The general idea of CE model is to define a central atom and environmental atom for a given structure, and sum up the linearly weighted elementary feature properties of environmental atoms so as to encode the chemical composition and structure information into the machine learning input feature vectors. The weight normally adopts the reciprocal of the distance from each environmental atom to the central atom. The CE features are constructed as described in Eqs. (2)-(6) as follows36:
where D is a high-dimensional vector representing the training/testing set. Fi (i = 1–56) represents one of the elementary properties of 56 elements or pure substances, having a two-dimensional vector form with the property components of the central atom (C) and the environmental atom (E), respectively. T represents the target properties to be predicted. PC,i is the property i of the central atom; pj,i is the property i of the environment atom j with its weight ωj constructed by inversed rj, the distance from the center atom to the environment atom j where j is the index of the environment atom (j = 1-Nj).
During the CE feature construction, the atoms in the crystal structure are divided into two atomic sets: the central atoms and the surrounding environmental atoms. A and B cation inequivalent sites in the spinel/perovskite structure were chosen as the central atoms, and the environmental atoms include the atoms from the first nearest neighbors to the nth nearest neighbors from the central atom. In this study, only the first nearest neighbor was considered, which was already proven to be very robust to predict the target property in these systems36. According to the symmetry of the space group, A and B cations in spinel and perovskite oxide structures have inequivalent sites. Therefore, two central atoms and their corresponding environmental atoms (oxygen atoms in this study) were considered in the CE feature construction process. The feature engineering was performed on both source and target domain datasets. Mutual information72 method was used to select features with contributions to the target values. It turns out that all 56 elementary features had nonnegligible contributions thus all feature were kept in the construction of ML models for both source and target datasets through this work. The Python library Scikit-Learn was used for feature selection to remove redundant features with zero variance or zero mutual information72 with the predicted target.
Model selection and evaluation
Artificial neural network was selected as the transfer learning algorithm. In general, the neural network input layer receives input data and processes them in a nonlinear manner to generate the output. A neural network is composed of an input layer, at least one hidden layer and an output layer.
As shown in Fig. 8b, the Rectified Linear Units66,73 (ReLU) approximating the activation function of biological neurons was used as the activation function in this work.

a DNN-CE includes an input layer of descriptor (corresponding to all descriptors generated by CE feature model in this study), several hidden layers and an output layer (predicted formation energy). Each circle represents a neuron. Each circle represents a neuron. b A single neuron as the calculation unit of the neural network. The neuron receives the input signal through a weighted connection and performs a weighted summation on it, and performs a non-linear transformation of the calculation result through the activation function to produce an output value. c The general workflow of predicting the formation energy of perovskite oxides through the transfer learning method.
During training neural network for regression prediction, mean absolute error (MAE) and coefficient of determination (R2) were used to evaluate the training loss and prediction accuracy of machine learning model on independent test set, respectively. MAE represents the error between the DFT value and the predicted value by ML.
Formation energy prediction
According to the different strategies of transfer, transfer learning algorithms are classified into sample-based transfer learning, feature-based transfer learning, model-based transfer learning, and relationship-based transfer learning26. Since the prediction of formation energy is a regression task where the source domain data and target domain data share the same feature space, this study adopted the model-based transfer learning method. The transfer learning process in this study is shown in Fig. 2c. Firstly, 5172 formation energies from spinel oxide structures were trained as source domain data to obtain the source domain model. Secondly, 855 perovskite oxide formation energy data were used to fine-tune the parameters of the source domain model to obtain the transfer learning model. Lastly, the established transfer learning model was used to predict the formation energy of more unknown unlabeled perovskite structures. A small learning rate and regularization was to prevent over fitting of small datasets.
Data availability
Source domain data, target domain data, and predicted stable structure are available on the GitHub website https://github.com/liyihang1024/spinel_to_perovskite_TL/tree/main/raw_data.
Code availability
The python scripts for training DNN-CE models are available on the GitHub website https://github.com/liyihang1024/spinel_to_perovskite_TL.
References
Ye, W., Chen, C., Wang, Z., Chu, I.-H. & Ong, S. P. Deep neural networks for accurate predictions of crystal stability. Nat. Commun. 9, 1–6 (2018).
Kim, J., Kim, E. & Min, K. Synthesizable Double Perovskite Oxide Search via Machine Learning and High-Throughput Computational Screening. Adv. Theory Simul. 4, 2100263 (2021).
Frey, N. C. et al. High-throughput search for magnetic and topological order in transition metal oxides. Sci. Adv. 6, eabd1076 (2020).
Yang, K., Nazir, S., Behtash, M. & Cheng, J. High-Throughput Design of Two-Dimensional Electron Gas Systems Based on Polar/Nonpolar Perovskite Oxide Heterostructures. Sci. Rep. 6, 34667 (2016).
Kocevski, V., Pilania, G. & Uberuaga, B. P. High-throughput investigation of the formation of double spinels. J. Mater. Chem. A 8, 25756–25767 (2020).
Zhou, Z.-H. Machine Learning. (Springer Singapore, 2021). https://doi.org/10.1007/978-981-15-1967-3.
Wang, Z., Zhang, H. & Li, J. Accelerated discovery of stable spinels in energy systems via machine learning. Nano Energy 81, 105665 (2021).
Min, K. & Cho, E. Accelerated Discovery of Novel Inorganic Materials with Desired Properties Using Active Learning. J. Phys. Chem. C. 124, 14759–14767 (2020).
Priya, P. & Aluru, N. R. Accelerated design and discovery of perovskites with high conductivity for energy applications through machine learning. npj Comput. Mater. 7, 1–12 (2021).
Liu, H. et al. Screening stable and metastable ABO3 perovskites using machine learning and the materials project. Comput. Mater. Sci. 177, 109614 (2020).
Wang, X. et al. First-principles based machine learning study of oxygen evolution reactions of perovskite oxides using a surface center-environment feature model. Appl. Surf. Sci. 531, 147323 (2020).
Gu, G. H., Jang, J., Noh, J., Walsh, A. & Jung, Y. Perovskite synthesizability using graph neural networks. npj Comput. Mater. 8, 1–8 (2022).
Liu, Y. et al. Machine learning in materials genome initiative: A review. J. Mater. Sci. Technol. 57, 113–122 (2020).
Takigawa, I., Shimizu, K., Tsuda, K. & Takakusagi, S. Machine-learning prediction of the d-band center for metals and bimetals. RSC Adv. 6, 52587–52595 (2016).
Ghiringhelli, L. M., Vybiral, J., Levchenko, S. V., Draxl, C. & Scheffler, M. Big Data of Materials Science: Critical Role of the Descriptor. Phys. Rev. Lett. 114, 105503 (2015).
Schmidt, J. et al. Predicting the Thermodynamic Stability of Solids Combining Density Functional Theory and Machine Learning. Chem. Mater. 29, 5090–5103 (2017).
Kim, J., Kim, E. & Min, K. Synthesizable Double Perovskite Oxide Search via Machine Learning and High-Throughput Computational Screening. Adv. Theory Simul. 4, 2100263 (2021).
Xie, T. & Grossman, J. C. Crystal Graph Convolutional Neural Networks for an Accurate and Interpretable Prediction of Material Properties. Phys. Rev. Lett. 120, 145301 (2018).
Zhuang, F. Z., Luo, P., He, Q. & Shi, Z. Z. Survey on transfer learning research. J. Softw. 26, 26–39 (2015).
Pan, S. J. & Yang, Q. A Survey on Transfer Learning. IEEE Trans. Knowl. Data Eng. 22, 1345–1359 (2010).
Weiss, K., Khoshgoftaar, T. M. & Wang, D. A survey of transfer learning. J. Big Data 3, 9 (2016).
Shin, H.-C. et al. Deep Convolutional Neural Networks for Computer-Aided Detection: CNN Architectures, Dataset Characteristics and Transfer Learning. IEEE Trans. Med. Imaging 35, 1285–1298 (2016).
Cubuk, E. D., Sendek, A. D. & Reed, E. J. Screening billions of candidates for solid lithium-ion conductors: A transfer learning approach for small data. J. Chem. Phys. 150, 214701 (2019).
Wu, S. et al. Machine-learning-assisted discovery of polymers with high thermal conductivity using a molecular design algorithm. npj Comput. Mater. 5, 1–11 (2019).
Jha, D. et al. Enhancing materials property prediction by leveraging computational and experimental data using deep transfer learning. Nat. Commun. 10, 5316 (2019).
Yang, Q., Zhang, Y., Dai, W. & Pan, S. J. Transfer Learning. (Cambridge University Press, 2020). https://doi.org/10.1017/9781139061773.
Yamada, H. et al. Predicting Materials Properties with Little Data Using Shotgun Transfer Learning. ACS Cent. Sci. 5, 1717–1730 (2019).
Kirklin, S. et al. The Open Quantum Materials Database (OQMD): assessing the accuracy of DFT formation energies. npj Comput. Mater. 1, 1–15 (2015).
Li, X. et al. Computational Screening of New Perovskite Materials Using Transfer Learning and Deep Learning. Appl. Sci. 9, 5510 (2019).
Williams, L., Mukherjee, A., Dasgupta, A. & Rajan, K. Monitoring the role of site chemistry on the formation energy of perovskites via deep learning analysis of Hirshfeld surfaces. J. Mater. Chem. C. 9, 11153–11162 (2021).
Chen, C. & Ong, S. P. AtomSets as a hierarchical transfer learning framework for small and large materials datasets. npj Comput. Mater. 7, 1–9 (2021).
Saal, J. E., Kirklin, S., Aykol, M., Meredig, B. & Wolverton, C. Materials Design and Discovery with High-Throughput Density Functional Theory: The Open Quantum Materials Database (OQMD). JOM 65, 1501–1509 (2013).
Liu, Y. et al. Spherical Message Passing for 3D Graph Networks. arXiv preprint arXiv. 2102.05013 (2022).
Choudhary, K. & DeCost, B. Atomistic Line Graph Neural Network for improved materials property predictions. npj Comput. Mater. 7, 1–8 (2021).
Jha, D., Gupta, V., Liao, W., Choudhary, A. & Agrawal, A. Moving closer to experimental level materials property prediction using AI. Sci. Rep. 12, 11953 (2022).
Li, Y. et al. Center-Environment Feature Model for Machine Learning Study of Spinel Oxides Based on First-Principles Computations. J. Phys. Chem. C. 124, 28458–28468 (2020).
Guo, J. et al. Machine learning aided first-principles studies of structure stability of Co3 (Al, X) doped with transition metal elements. Comput. Mater. Sci. 200, 110787 (2021).
Chen, R. et al. Combined first-principles and machine learning study of the initial growth of carbon nanomaterials on metal surfaces. Appl. Surf. Sci. 586, 152762 (2022).
Li, C., Soh, K. C. K. & Wu, P. Formability of ABO3 perovskites. J. Alloy. Compd. 372, 40–48 (2004).
Tanaka, H. & Misono, M. Advances in designing perovskite catalysts. Curr. Opin. Solid State Mater. Sci. 5, 381–387 (2001).
Oku, T. Crystal structures of perovskite halide compounds used for solar cells. Rev. Adv. Mater. Sci. 59, 264–305 (2020).
Ishihara, T. (Ed). Perovskite Oxide for Solid Oxide Fuel Cells. (Springer US, 2009).
Jacobs, R., Mayeshiba, T., Booske, J. & Morgan, D. Material Discovery and Design Principles for Stable, High Activity Perovskite Cathodes for Solid Oxide Fuel Cells. Adv. Energy Mater. 8, 1702708 (2018).
Sun, C., Alonso, J. A. & Bian, J. Recent Advances in Perovskite-Type Oxides for Energy Conversion and Storage Applications. Adv. Energy Mater. 11, 2000459 (2021).
Suntivich, Jin et al. Design principles for oxygen-reduction activity on perovskite oxide catalysts for fuel cells and metal–air batteries. Nat. Chem. 3, 546–550 (2011).
Li, W. et al. Origin of Improved Photoelectrochemical Water Splitting in Mixed Perovskite Oxides. Adv. Energy Mater. 8, 1801972 (2018).
Wang, W., Xu, M., Xu, X., Zhou, W. & Shao, Z. Perovskite Oxide Based Electrodes for High-Performance Photoelectrochemical Water Splitting. Angew. Chem. Int. Ed. 59, 136–152 (2020).
Lu, Yao et al. Engineering Oxygen Vacancies into LaCoO3 Perovskite for Efficient Electrocatalytic Oxygen Evolution. ACS Sustain. Chem. Eng. 7, 2906–2910 (2019).
Da, Y., Zeng, L., Wang, C., Gong, C. & Cui, L. A simple approach to tailor OER activity of SrxCo0.8Fe0.2O3 perovskite catalysts. Electrochim. Acta 300, 85–92 (2019).
Risch, M. Perovskite electrocatalysts for the oxygen reduction reaction in alkaline media. Catalysts 7, 154 (2017).
Zhao, C. et al. Cooperative Catalysis toward Oxygen Reduction Reaction under Dual Coordination Environments on Intrinsic AMnO3-Type Perovskites via Regulating Stacking Configurations of Coordination Units. Adv. Mater. 32, 2006145 (2020).
Xu, X. et al. A Perovskite Electrocatalyst for Efficient Hydrogen Evolution Reaction. Adv. Mater. 28, 6442–6448 (2016).
Liu, Y. et al. Synergistic Interaction of Double/Simple Perovskite Heterostructure for Efficient Hydrogen Evolution Reaction at High Current Density. Small Methods 5, 2000701 (2021).
Hwang, J., Akkiraju, K., Corchado-García, J. & Shao-Horn, Y. A Perovskite Electronic Structure Descriptor for Electrochemical CO2 Reduction and the Competing H2 Evolution Reaction. J. Phys. Chem. C. 123, 24469–24476 (2019).
Yegnanarayana, B. Artificial neural networks. (PHI Learning Pvt. Ltd., 2009).
Ward, L. et al. Including crystal structure attributes in machine learning models of formation energies via Voronoi tessellations. Phys. Rev. B 96, 024104 (2017).
Jha, D. et al. ElemNet: Deep Learning the Chemistry of Materials From Only Elemental Composition. Sci. Rep. 8, 17593 (2018).
Blatov, V. A. Voronoi–dirichlet polyhedra in crystal chemistry: theory and applications. Crystallogr. Rev. 10, 249–318 (2004).
Ward, L., Agrawal, A., Choudhary, A. & Wolverton, C. A general-purpose machine learning framework for predicting properties of inorganic materials. npj Comput. Mater. 2, 1–7 (2016).
Goldschmidt, V. M. Die Gesetze der Krystallochemie. Naturwissenschaften 14, 477–485 (1926).
Zhang, L., He, M. & Shao, S. Machine learning for halide perovskite materials. Nano Energy 78, 105380 (2020).
Feng, L. M. et al. Formability of ABO3 cubic perovskites. J. Phys. Chem. Solids 69, 967–974 (2008).
Jain, A. et al. Commentary: The Materials Project: A materials genome approach to accelerating materials innovation. APL Mater. 1, 011002 (2013).
van Rossum, G. Python programming language. http://www.python.org/ (1990).
Pedregosa, F. et al. Scikit-learn: Machine Learning in Python. arXiv:1201.0490 [cs] (2018).
Chollet, F. Deep Learning with Python, 2nd edn, (Manning, 2021).
Abadi, M. et al. TensorFlow: A system for large-scale machine learning. arXiv:1605.08695 [cs] (2016).
Kresse, G. & Furthmüller, J. Efficient iterative schemes for ab initio total-energy calculations using a plane-wave basis set. Phys. Rev. B 54, 11169 (1996).
Blöchl, P. E. Projector augmented-wave method. Phys. Rev. B 50, 17953–17979 (1994).
Perdew, J. P., Burke, K. & Ernzerhof, M. Generalized Gradient Approximation Made Simple. Phys. Rev. Lett. 77, 3865–3868 (1996).
Balachandran, P. V. et al. Predictions of new ABO3 perovskite compounds by combining machine learning and density functional theory. Phys. Rev. Mater. 2, 043802 (2018).
Kraskov, A., Stögbauer, H. & Grassberger, P. Estimating mutual information. Phys. Rev. E 69, 066138 (2004).
Ketkar, N. Deep Learning with Python: A Hands-on Introduction. (Apress, 2017).
Acknowledgements
We thank the fruitful discussion with Dr. Runhai Ouyang at Shanghai University. This work was supported by the National Natural Science Foundation of China [Nos. 22177067] and Sino-German Mobility Program [No. M-0209], the Shanghai Rising-Star Program [No. 20QA1403400], and the Key Basic Research Program of Science and Technology Commission of Shanghai Municipality (20JC1415300). This work was also supported the Key Research Project of Zhejiang Laboratory (No. 2021PE0AC02), and Shanghai Technical Service Center for Advanced Ceramics Structure Design and Precision Manufacturing (No. 20DZ2294000). The authors acknowledge the Beijing Super Cloud Computing Center, Hefei Advanced Computing Center, and Shanghai University for providing HPC resources.
Author information
Authors and Affiliations
Contributions
Y.Li.: investigation, methodology, software, formal analysis, visualization, writing—original draft; R.Z.: methodology, software, formal analysis; Y.W.: formal analysis, writing—review and editing; L.F.: funding acquisition, project administration, resources, formal analysis, writing—review and editing; Y.Liu.: supervision, conceptualization, methodology, formal analysis, writing—review and editing.
Corresponding authors
Ethics declarations
Competing interests
The authors declare no competing interests.
Additional information
Publisher’s note Springer Nature remains neutral with regard to jurisdictional claims in published maps and institutional affiliations.
Supplementary information
Rights and permissions
Open Access This article is licensed under a Creative Commons Attribution 4.0 International License, which permits use, sharing, adaptation, distribution and reproduction in any medium or format, as long as you give appropriate credit to the original author(s) and the source, provide a link to the Creative Commons license, and indicate if changes were made. The images or other third party material in this article are included in the article’s Creative Commons license, unless indicated otherwise in a credit line to the material. If material is not included in the article’s Creative Commons license and your intended use is not permitted by statutory regulation or exceeds the permitted use, you will need to obtain permission directly from the copyright holder. To view a copy of this license, visit http://creativecommons.org/licenses/by/4.0/.
About this article

Cite this article
Li, Y., Zhu, R., Wang, Y. et al. Center-environment deep transfer machine learning across crystal structures: from spinel oxides to perovskite oxides. npj Comput Mater 9, 109 (2023). https://doi.org/10.1038/s41524-023-01068-7
Received:
Accepted:
Published:
DOI: https://doi.org/10.1038/s41524-023-01068-7
This article is cited by
-
Methods and applications of machine learning in computational design of optoelectronic semiconductors
Science China Materials (2024)
