


Poor eating habits during childhood are risk factors for obesity(Reference Ambrosini, Oddy and Huang1,Reference Lim, Vos and Flaxman2) , and these habits tend to persist into adulthood(Reference Mikkilä, Räsänen and Raitakari3,Reference Simmonds, Llewellyn and Owen4) . These associations highlighted the importance to promote healthy eating habits in young ages to improve nutrition-related outcomes(Reference Llewellyn, Simmonds and Owen5).
The food environment is an important determinant of children’s eating habits and an important driver of the overall increase in pre-obesity and obesity(Reference Penney, Almiron-Roig and Shearer6). In recent years, there has been a remarkable cultural change, which has been accompanied by a change in the food environment(Reference Linand and Guthrie7,Reference Harnack, Jeffery and Boutelle8) . In the past decades, food service operators have implemented policies of international expansion that have led to a change in eating location (EL)(Reference Hawkes9,Reference Ni Mhurchu, Aston and Jebb10) . Urbanisation and new lifestyles provide an increased time spent in the workplace(Reference Ni Mhurchu, Aston and Jebb10) and less time for cooking(Reference Jabs and Devine11), which result in a change in the EL with an increase of the eating out(Reference Guthrie, Lin and Frazao12–Reference Vandevijvere, Lachat and Kolsteren14). In the literature, eating out is related to the increase in energy consumption(Reference Lachat, Nago and Verstraeten15,Reference Orfanos, Naska and Rodrigues16) , higher economic expenditure(Reference Adams, Goffe and Brown17) and consumption of low nutrient energy-dense foods(Reference Ziauddeen, Page and Penney18) and also with increased consumption of fat(Reference Orfanos, Naska and Rodrigues16). In children, the eating out is related to lower dietary adequacy(Reference Moreira, Severo and Oliveira19), while the consumption of food at home is related with better nutritional status, better eating habits and, less consistently, with better weight status(Reference Dallacker, Hertwig and Mata20).
Socio-economic status shows a relationship with the dietary pattern and can influence the acquisition of more or less healthy eating habits during childhood and adolescence(Reference Gasser, Mensah and Kerr21,Reference Camara, de Lauzon-Guillain and Heude22) . The impact of the socio-economic status on diet quality and weight status has also changed over the past century(Reference Patetta, Pedraza and Popkin23). Diet quality has increased across all income levels; however, this increase shows to be greater in high-income groups, which demonstrate some socio-economic disparities(Reference Patetta, Pedraza and Popkin23). Regarding weight status, using data from four British population-based birth cohorts recruited between 1946 and 2001, the effect of parental socio-economic inequalities on children’s weight was reversed over time(Reference Bann, Johnson and Li24). In the earlier-born cohort, belonging to a low socio-economic position was associated with a lower weight, but nowadays it is associated with an increased weight(Reference Bann, Johnson and Li24).
The evidence seems to be clear that different EL influences the dietary quality and that belonging to different socio-economic environments (SEE) lead to disparities in diet quality. Less understood is the possible impact of the SEE in the association between the EL and diet quality. Food can be acquired and consumed in different places, and it is known that the socio-economic position can promote differences in both food environment and, possibly, in diet quality. Therefore, this study aimed to assess the influence of the SEE in the EL and their relationship with diet quality, among Portuguese children and adolescents, using a national dietary survey sample.
Methods
Study design and participants
This study has included participants from the most recent National Food, Nutrition, and Physical Activity of the Portuguese Population (IAN-AF 2015/2016)(Reference Lopes, Torres and Oliveira25,Reference Lopes, Torres and Oliveira26) enrolled between October 2015 and September 2016. Participants in the survey were a representative sample of the Portuguese general population aged between 3 months and 84 years. They were selected by multistage sampling from the National Health Registry, in each of the seven Portuguese geographical regions (NUTS II) and weight according to sex and age groups. Individuals were excluded if one of the following criteria was met (i) living in collective residences or institutions; (ii) living in Portugal for less than 1 year (not applicable to infants); (iii) non-Portuguese speakers; (iv) diminished physical and/or cognitive abilities that hamper participation (e.g. blind, deaf, with diagnosed dementias) and (v) deceased. Participants were contacted by telephone to check their willingness to participate. If the participant refuses to participate in the study, a short refusal questionnaire was applied, if accept they had the option to select the location of examination, at home or in the Primary Health Care Unit. A total of 597 children (3–9 years) and 556 adolescents (10–17 years) were evaluated in the IAN-AF 2015/2016, and 987 with complete data were included in the present study. Of the total participants, 166 were excluded given the absence of data on SEE (n 142), physical activity (n 22) weight and/or height (n 5). Three participants had missing data in more than one of the variables described earlier.
Data collection
Data were collected using two interviews conducted by trained researchers with a background in nutrition or dietetics. The interviews were 8–15 d apart and were conducted for 12 months, distributed over the 4 seasons, and including all days of the week, using computer-assisted personal interviewing. This procedure guarantees the incorporation of seasonal effects and day-to-day variation in food intake. The data collection was assisted by a developed electronic platform (You eAT&Move)(Reference Lopes, Torres and Oliveira25,Reference Goios, Severo and Lloyd27) . Using this platform, the interviewers collected socio-demographic, anthropometric measurements, detailed food consumption data by a 24-h recall (or food diaries), physical activity and other health-related data. For children younger than 10 years of age, the dietary intake was obtained by two non-consecutive 1-d food diaries (8–15 d apart), followed by a face to face interview, with the help of parents or another main caregiver to better description and quantification of foods and beverages(Reference Lopes, Torres and Oliveira26). In adolescents, 10–17 years, a two non-consecutive 24-h recalls were used to assess the dietary intake: for adolescents aged 10–14 years were administered with the presence of one parent or another main caregiver. For the remaining adolescents, the 24-h recalls could be administered with the participant alone. The days of reporting were randomly selected, but the participants could change the days of the report according to their availability. The used methodology allows a detailed description of the food consumption and the recorder of the meal time and EL for each eating occasion(Reference Lopes, Torres and Oliveira25).
Regarding physical activity, parents (or adolescents) reported if their child (or themselves) had a regular practice of physical exercise (reported as non-practitioners v. practitioners), excluding school activities.
The children’s sex and age (calculated using the first interview date and birth date) were accessed in the first contact with the participant. Anthropometrics data and socio-economic data were collected during the first interview, and only the dietary data were collected in the two interviews separated by 8–15 d.
Anthropometrics
The measures of body weight and height were performed in children and adolescents by trained researchers according to standard procedures(Reference Stewart and Marfell-Jones28). All the measurements were performed with participants with light clothing and barefoot. The weight was measured to the nearest tenth of a kilogram using a digital scale (SECA® 831, Hamburg, Germany). Height was measured, using a wall stadiometer (SECA® 213, Hamburg, Germany), with the participant in a stand position.
The BMI, calculated as weight over the squared height, for children and adolescents was classified according to the WHO standards, and age and sex-specific BMI z-scores were used(29).
Socio-economic data
The socio-economic information includes questions about the parental level of education and employment status (employed v. unemployed/others). Education was defined as ‘low’ (no formal education to 6 years of education), ‘middle’ (7–12 years of education plus post-secondary education) and ‘high’ (>12 years). Participants were also asked about the number of household members. Geographical regions were defined according to the Portuguese National Institute of Statistics’ classification of urban areas, and participants’ parish of residence was classified in three categories: ‘Predominantly urban areas’, ‘Medium urban areas’ and ‘Predominantly rural areas’.
Based on this information, a socio-economic classification, for each participant, was previously developed, using latent class analysis(Reference Vilela, Muresan and Correia30), to describe the SEE of the child or adolescent. The index was composed by six indicators: parents’ education (two separate variables), parents’ occupation (two separate variables), household composition and region type. The index classified children and adolescent by three different categories: ‘low’, ‘middle’ and ‘high’. For the current analysis, these categories were grouped as low socio-economic environment (LSE) and middle/high SEE, in order to have more sampling power and do to similarity of the different groups.
Diet quality
The diet quality was assessed as a higher adherence to a healthy eating pattern previously developed for children and adolescents(Reference Vilela, Muresan and Correia30). Briefly, nine food groups were defined and included in the index based on the WHO dietary recommendations(31) and previously validated against nutrient status(Reference da Costa, Durão and Lopes32). Higher scores in the index were positively correlated with protein and fibre intake and negatively with total energy, total fat and saturated fat intake. ‘Fruit and vegetables’, ‘Cereals and potatoes’, ‘Dairy’, ‘White meat, fish and eggs’, ‘Red meat and processed meat’, ‘Salty Snacks, ‘Sugar-sweetened beverages’, ‘Sugar and honey’ and ‘Sweets’. The frequency of consumption of each food groups was scored between 1 and 4 points according to the respective quartiles of frequency (online Supplementary Table 1), except for the groups ‘salty snacks’ and ‘sugar and honey’. This two groups presented a higher prevalence of non-consumers and was scored between 1 and 2 points according to have any consumption or no consumption. For food groups considered healthier (fruit and vegetables, cereals and potatoes, diary and white meat and fish and eggs), a lower consumption was scored less, and a higher frequency of consumption was scored more. The remaining food groups with less healthy foods (salty snacks and sweets, red meat and processed meat, sugar-sweetened beverages and sugar and honey and sweets) were assigned inversely scores, that is, the lowest consumption quartile was assigned the highest score. The scores assigned were summed up, and higher scores represent a higher adherence to a healthier eating pattern.
Eating location
The ‘EL’ was considered as the place where the meal was consumed, not necessarily where was prepared, according to the report of participants, and a compose variable that summarises the pattern of EL for most meals was developed. Taking into consideration previous research(Reference Moreira, Severo and Oliveira19), we hypothesised the development of a variable including four different groups of EL. One of the groups was considered as ‘home’, for participants in whom the food consumption occurs at least at home in 80 % of the meals. Other groups were defined considering if the food consumption at home was <80 % of all meals and the highest prevalence of consumption of meals in a specific location. In this way, three other different groups were defined, namely ‘Restaurants/other places out of home’, ‘Other homes’ and ‘School’. The definition of the four types of groups of EL is present in Supplementary Table 2.
Ethical issues
The survey was approved by the National Commission for Data Protection, and ethical approval was obtained from the Ethical Committee of the Institute of Public Health of the University of Porto, and the Ethical Commissions of each of the Regional Administration of health. The general rules of conduct set out in the Helsinki Declaration of the World Medical Association (Helsinki, 1964) and the national legislation in force has been complied with, and the necessary personal information collected has been kept confidential. In children/adolescents under 18 years of age, this was signed by their parents/legal guardians. The adolescents (10–17 years old) also signed the informed consent together with their legal representative.
Statistical analysis
All the estimates were weighted for the population distribution, according to the complex sampling design, considering stratification by the seven NUTS II and cluster effect for the selected Primary Health Care Unit. Comparison of frequency or mean (standard deviation) across different SEE was performed using the χ 2 test and the Student’s t test, respectively. The adherence to the diet quality in the different EL was also compared between the SEE using the Student’s t test. Linear regression models were used to evaluate how EL influences the diet quality score, obtaining regression coefficients and respective 95 % confidence intervals [β, 95 %CI]. Interaction effects of the SEE and participants’ age were tested in the association between meal location and diet quality by including an interaction term in the final models. The final model was adjusted for age, physical activity, sex and z-score BMI of the children/adolescents.
All the statistical analysis was performed by the IBM Statistical Package for Social Sciences 25.0 software (SPSS®, Inc., 2017). The significance level considered was 5 % for all analysis.
Results
Table 1 presents the characterisation of the sample, which includes 987 Portuguese children and adolescents (51 % girls) with a mean age of 10 years (sd = 4·2) and an average z-score of BMI of 0·55 (sd = 1·10). Concerning the physical activity, 40 % reported no regular practice of physical exercise, and the average score for the diet quality index was 20·4 (sd = 3·4). Comparing the two different groups of SEE, the participants that were classified into the LSE have a mean age of 10·9 years (sd = 4·0), while the group that belonging participants classified into the middle/higher SEE have 9·5 years (sd = 4·2) as mean age (P = 0·018). More than half of the participants from a LSE was sedentary, while only 35·2 % of the children/adolescent belonging to the middle/high SEE was no regular practice of physical exercise (P < 0·001).
Table 1. Characteristics of the Portuguese children and adolescents stratified by the different socioeconomic environments
(Numbers and percentages)
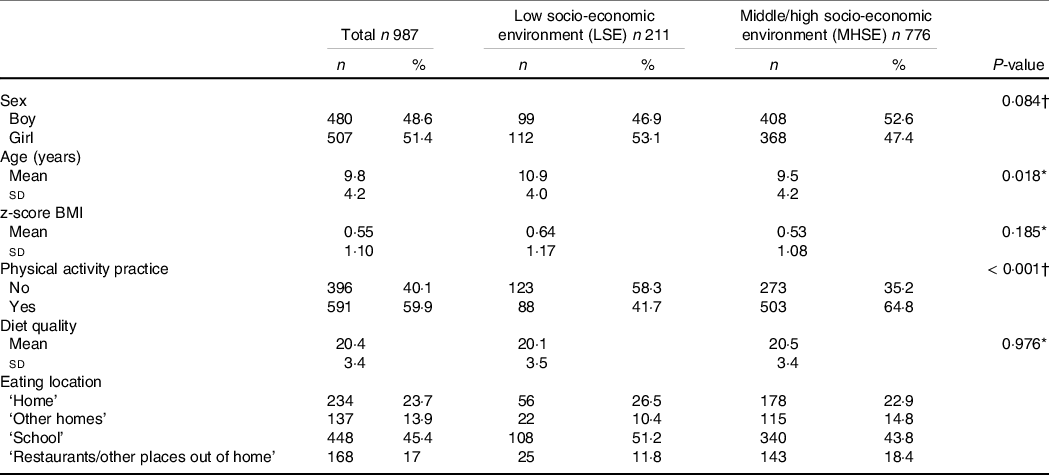
P-values 0·185 and <0.001 are statistically significant.
* Student’s t test.
† χ 2 test.
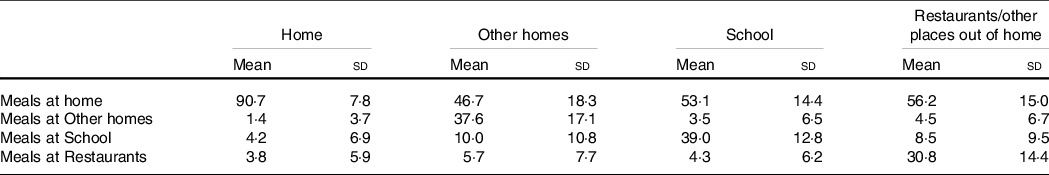
The ‘School’ group was the most reported place with 45·4 %, followed by the group classified as ‘Home’ with 23·7 %. The group ‘Restaurants/other places out of home’ and ‘Other Homes’ were the least frequently reported with 17·0 and 13·9 %, respectively (Table 2). Participants that were classified in the ‘Home’ group have a mean percentage of 90·7 % of meals made at home, and the remaining 9·3 % has distributed by meals made at other homes, school, restaurants and other places. The Group ‘Other Homes’ was characterised by 46·7 % of meals made at home, followed by 37·6 % of meals at other homes and 10·0 % and 5·7 % in school and restaurants, respectively. In the ‘School’ group, slightly more than half of the meals were done at home, 39·0 % was done at school, 3·5 % at other homes, and the remaining 5·7 % at restaurants. Finally, in the ‘Restaurants/other places out of home’ group, more than half of the meals was realised at home, 30·8 % at restaurants and 4·5 % and 8·5 % was done at other homes and school, respectively. A significant interaction was found (P < 0·01) for the SEE in the association between the meal location and the diet quality. Therefore, the results were stratified by the LSE and middle/high SEE.
Table 2. Distribution by eating location groups and mean percentage of meals consumed at each location by children and adolescents, weighted for the Portuguese population distribution
(Mean values and standard deviations)
The description of dietary quality across the different EL, stratified by SEE, is presented in Table 3. In the total sample, the children and adolescents classified in ‘Restaurants/other places out of home’ (P < 0·001) and in ‘Other homes’ (P = 0·015) had a significantly lower mean of adherence to a healthy eating pattern, compared with ‘Home’ group. The same results were observed in the low socio-economic group for ‘Restaurants/other places out of home’ (P = 0·001) and ‘Other homes (P = 0·002), respectively. Particularly, in the middle/high SEE, compared with the ‘Home’ group, only the ‘Restaurants/other places out of home’ group had a lower diet quality (P = 0·004).
Table 3. Mean and standard deviation of diet quality by the different eating location, stratified by the socio-economic environment
(Mean values and standard deviations)
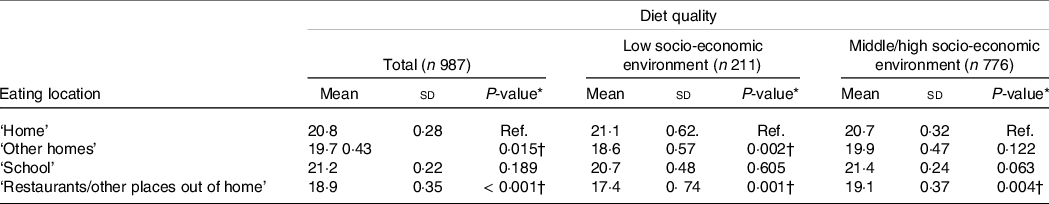
Ref.: reference.
* Student´s t test.
† Denote statistical significance.
After adjustment for age, physical activity, sex and z-score of BMI (Table 4, adjusted model), and considering the participants classified in LSE, children and adolescents belonging to the groups ‘Other Homes’ (β = −2·07; 95 % CI: −3·70, −0·44) and ‘Restaurants/other places out of home’ (β = −3·31; 95 % CI: −5·08, −1·54) had lower scores in the diet quality, when compared with the ‘Home’ group. Considering the middle/higher SEE, eating at ‘Restaurants/other places out of home’ had a negative impact in the diet quality, compared with the ‘Home’ group (Table 4, β = −1·56; 95 % CI: −2·65, −0·48). Only in the middle/higher SEE, children and adolescents having the higher number of meals at school, after home, had higher scores in the diet quality (Table 4, β = 0·90; 95 % CI: 0·16, 1·64), compared with those belonging to the ‘Home’ group.
Table 4. Multivariate associations between eating location and the diet quality, stratified by the different socio-economic environmental
(Coefficients and 95 % confidence intervals)
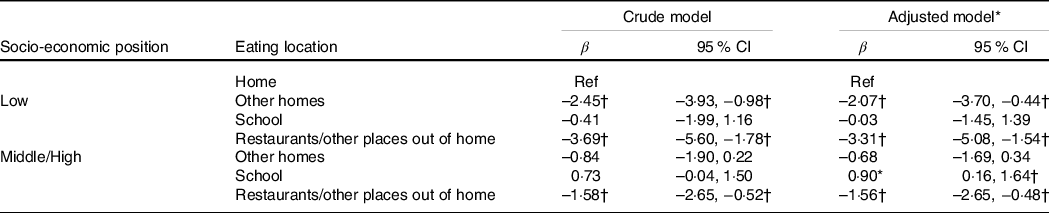
Ref., reference.
* Adjusted for age, physical activity, sex and z-score of BMI.
† Denotes statistical significance.
Discussion
The results of the present study show that children and adolescents’ overall diet quality depend on the EL. This association is, however, affected by the SEE. Portuguese younger population belonging to a LSE and consuming more meals outside the home might be at higher risk of unhealthy eating. On the other hand, in the highest positions of socio-economic classification, the overall diet quality of children and adolescents who consumed more meals at school was higher, when compared with meals at home, which was not found in those with a lower socio-economic position.
The overall diet quality was similar between socio-economic positions; however, there were significant differences when compared with the four groups of EL established in the present study. These results are in line with previous evidence. In children and adolescents from a cross-sectional study representative of UK population, better food choices were positively associated with the consumption at home or school, and the school food environment has also shown a protective effect for a food choice more related to healthy foods(Reference Ziauddeen, Page and Penney18). Negative associations between the consumption of food away from home and the overall diet quality were also found in a cross-sectional study among British adolescents(Reference Taher, Evans and Evans33) and preschool children from the prospective population-based birth cohort Generation XXI(Reference Moreira, Severo and Oliveira19). In a previous systematic review, the authors described that there is a possible age gradient in total energy consumption away from home, having its peak in childhood and young adulthood(Reference Lachat, Nago and Verstraeten15). It was also described a possible interference of the socio-economic position that shows that improvements in the socio-economic status were associated with a greater contribution of energy value from eating out of home(Reference Lachat, Nago and Verstraeten15). These results can be interpreted as contradictory to ours, but there were methodological differences that could explain these differences, since we evaluated the diet quality, instead of the energy contribution.
An important result was that the impact of promoting consumption at schools could have in the acquisition of healthier eating habits. At least in Portugal, schools seem to promote a better quality of diet among children and adolescents from a middle or high SEE. In a study conducted among Irish school-aged children, the authors have concluded that school socio-economic status was a strong determinant of being overweight in that population(Reference Bel-Serrat, Heinen and Mehegan34). Moreover, in that country, the children that were attending a disadvantaged school were at higher risk of being overweight comparing with peers that were in schools classified as non-disadvantaged schools(Reference Bel-Serrat, Heinen and Mehegan34). Another important question is the school mealtime that contributes to overall diet quality, depending on the location of consumption and preparation(Reference Evans, Mandl and Christian35). Results from a nationally representative sample of Canadian children and adolescents show that food obtained from off-campus locations have worse nutrition quality compared with food from home-prepared lunches(Reference Tugault-Lafleur, Black and Barr36). The school neighbourhood is also an important factor for diet quality of children and adolescent since the presence of fast-food restaurants near the school has a possible relation with poor eating habits and obesity(Reference Matsuzaki, Sanchez and Acosta37,Reference Virtanen, Kivimäki and Ervasti38) . The schools that are in most disadvantage environment seem to have more fast-food restaurants nearby(Reference Thornton, Lamb and Ball39). The nutrient profile of food available in school and the school’s neighbourhood could help to explain the observed protective effect of eating at school in diet quality between middle or high SEE but not in the LSE. Another plausible explanation of these results, the protective effect of eating at school in children and adolescents belonging to a middle or high SEE might be the influence that parent’s education exerts in the adherence of better eating habits. In Portugal, it is common that parents prepared food for their children to take to school; Portuguese children and adolescents with more educated parents tend to eat more fruits and vegetables and white meat, fish and eggs which leads to a higher score in the Heathy Eating Index(Reference Vilela, Muresan and Correia30). If the meals are made and prepared at school environment and surround, the price of food could also have an influence. Less healthy food tends to cost less than healthier alternatives, which could explain some disparities in food access(Reference Darmon and Drewnowski40). As previous study using representative data from Portugal, shown that the adherence to a Mediterranean Diet, a known healthy eating pattern, measured by an index(Reference Trichopoulou, Costacou and Bamia41), led to an increase of the dietary cost, supporting that the cost could limit the access to a healthier food in Portugal(Reference Alves, Lopes and Rodrigues42). Although more studies are needed, and specifically in Portugal, for better conclusions.
The consumption of meals away from home can be done in different forms and in many different places. Eating out can occur in a self-service restaurant, in a traditional restaurant, grill bar or fast-food outlet. This creates a challenge from a nutritional point of view because the food served can vary in terms of portion sizes, energy density, consumer information and availability of healthy choices. Exposure to places of eating out seems to be patterned by socio-demographic characteristics(Reference Maguire, Burgoine and Monsivais43). Individuals classified in low socio-economic status are more likely to frequent places of eating out like fast-food outlets and take away(Reference Mills, Adams and Wrieden44), which are characterised by having less availability of healthy food and enhance lower diet quality(Reference Pearce, Bray and Horswell45). These locals of eating out are more appeal for the more vulnerable due to lower food prices, especially by spending per unit of energy(Reference Monsivais and Drewnowski46) and also because they are possibly exposed to a high density of fast-food outlets in the places of residence(Reference Maguire, Burgoine and Monsivais43,Reference Pearce, Bray and Horswell45) . In a study, using data from the population-based cohort Generation XXI was also found that neighbourhood deprivation and paedestrian access to fast-food outlets could increase the prevalence of obesity in children with 7 years(Reference Ribeiro, Santos and Vieira47). This double burden, higher exposure to fast-food outlets and low income represent an additive effect for lower diet quality and can be a possible explanation for our results. The relation of conditioned access and lack of availability of healthy eating foods due to socio-economic variation may be a credible explanation for the impact of the SEE on the association between dietary adequacy and the EL. Another possible explanation is that when children and adolescents bring a snack from home to eat at school, this tends to be less healthy and potential more processed.
Strengths of the present study include the use of a representative sample of the Portuguese population and collection of individual data following a harmonised methodology of dietary assessment proposed by the European Food Safety Authority(48). The diet quality was measured by an index previously developed for this specific population which is also a strength. The quality of dietary assessment was another advantage as it was conducted by nutrition trained researchers with supporting software and access to a photo manual and other scales to quantify food portions, representing another quality procedure. For defining socio-economic status, the use of an index composed of six different indicators is also an advantage given the importance of using different indicators of socio-economic position for the associations between dietary adequacy and EL. The inclusion of geographical region type was also an advantage since living in rural or in urban areas seems to influence the food consumption(Reference McCormack and Meendering49).
Regarding the EL, it was used the theoretical assumption previous developed(Reference Moreira, Severo and Oliveira19) to classify the participants into the four different groups of EL, which could be discussed. The definition used has also some limitations, since it only takes into consideration EL, and not the place of preparation, although in schools it is not expected that warm meals are consumed and prepared in different places. The same was expected for restaurants, but in terms of snacks in school, the place of preparation could not be the school, which may have influenced the results. Another limitation is the cross-sectional nature of the study, hampering temporal associations between EL and diet quality, however, is not expectable that in this group age, the diet quality has influenced the EL.
In conclusion, the SEE changes the effect that EL exerts on diet quality. Children and adolescents belonging to a low socio-economic position might be at a higher risk of having unhealthy eating habits when eating out-of-home. The same occurs, despite less impact, in the middle/high socio-economic context, but only if the EL was at restaurants, showing that perhaps the higher prize of high-quality meals may explain the different magnitude of association. Nevertheless, eating at restaurant increases the risk of unhealthy eating’s across all socio-economic contexts. Eating at school seems to be protective for unhealthy eating habits in children and adolescents classified into the middle or high SEE, which it does not occur when belonging to a LSE. In this sense, it would be important to carry out food policies to minimise these differences to promote and address a good dietary quality when eating out equitably.
Acknowledgements
The IAN-AF 2015–2016 had institutional support from the General Directorate of Health (DGS), the Regional Health Administration Departments, the Central Administration of the Health System (ACSS) and the European Food Safety Authority (CFT/EFSA/DCM/2012/01-C03). The researchers acknowledge all these institutions and persons involved in all phases of the IAN-AF 2015–2016, as well as the participants.
The IAN-AF 2015–2016 received funding from the EEA Grants Program, Public Health Initiatives (grant number: PT06-000088SI3). This particular study was supported through Fundação Francisco Manuel do Santos under the project ‘How we eat what we eat: A portrait of meal consumption in Portugal (ref: HWE2019)’ and the Unidade de Investigação em Epidemiologia – Instituto de Saúde Pública da Universidade do Porto (EPIUnit) (UIDB/04750/2020). The funding institutions had no role in the design, analysis or writing of this article.
P. P. and S. V. designed the study; P. P., D. M. C and S. V performed data management and analyses; C. M. M. L. and D. P. M. T. coordinated the IAN-AF and contributed to the interpretation of data. P. P. and S. V. interpreted the data; P. P. wrote the first draft of the manuscript; P. P., C. M. M. L, D. M. C., D. P. M. T., S. S. P. R. and S. V. revised each draft of the manuscript for important intellectual content. All authors read and approved the final manuscript.
There are no conflicts of interest.
Supplementary material
For supplementary material/s referred to in this article, please visit https://doi.org/10.1017/S0007114521004049


