


1. INTRODUCTION
Estimating the present mass of glaciers, ice caps and ice sheets is a key element for global sea-level rise predictions, regional strategies for managing water resources and local hazard assessment in high mountain environments. Ground-penetrating radar (GPR) measurements (Plewes and Hubbard, Reference Plewes and Hubbard2001; Woodward and Burke, Reference Woodward and Burke2007), ice thickness modeling techniques (Farinotti and others, Reference Farinotti, Huss, Bauder, Funk and Truffer2009, Reference Farinotti2017; Huss and Farinotti, Reference Huss and Farinotti2012) and satellite observation (Hirt, Reference Hirt2014) have traditionally been the tools of choice for assessing the bedrock topography and determining ice volume. GPR systems, in particular, provide in-situ data and are also referred to as RES (Radio-echo sounding) techniques. They can be operated ground-based or air-borne. Airborne GPR systems mounted on fixed-wing aircrafts are common for large-scale surveys in the polar regions and over wide glaciers (Watts and Wright, Reference Watts and Wright1981; Conway and others, Reference Conway2009; Zamora and others, Reference Zamora2009; Shi and others, Reference Shi2010; Li and others, Reference Li2013), but in high-mountain environments with complex topography, helicopter-borne systems are more suitable because of better maneuverability (Kennett and others, Reference Kennett, Laumann and Lund1993; Blindow and others, Reference Blindow, Salat and Casassa2012).
One of the earliest attempts to measure bedrock topography underneath temperate glaciers with helicopter-borne GPR was carried out by Kennett and others (Reference Kennett, Laumann and Lund1993). They used an 8 MHz GPR system that was mounted on a H-shaped construction consisting of fiberglass poles and an aluminum mast. On Svartisen Glacier, Norway, bedrock reflections down to 350 m depth were recorded. In recent years, low-frequency helicopter-borne GPR systems have been used more frequently, particularly in mountainous environments. For example, Blindow (Reference Blindow2009) developed the UMAIR (University of Münster Airborne Ice Radar, later referred to as BGR-P30 system; Rückamp and Blindow, Reference Rückamp and Blindow2012), a broadband antenna system with a 30 MHz center frequency. During surveys on the Southern Patagonian Ice Field, Chile, bedrock reflections down to 800 m in temperate ice were recorded. Later, the UMAIR/BGR-P30 system was used in campaigns on the King George Island Ice Cap, Antarctica, (Rückamp and Blindow, Reference Rückamp and Blindow2012), the Colonia and Nef Glacier in Chile, (Blindow and others, Reference Blindow, Salat and Casassa2012) and the Gorner Glacier, Switzerland, (Ryser and others, Reference Ryser2013). Based on the UMAIR/BGR-P30 concept, a more lightweight and higher frequency (50 MHz) airborne GPR (named ‘Carlina’) was developed by Casassa and others (Reference Casassa, Rodríguez and Blindow2014). They mapped the bedrock topography of the Juncal Norte Glacier situated at altitudes above 5750 m. Gacitúa and others (Reference Gacitúa2015) operated a helicopter-borne GPR on the Olivares Alfa Glacier, Chile. The system consisted of a hanging dual bow-tie dipole antenna with a center frequency of 50 MHz. They achieved a maximum penetration depth of up to ~130 m and found distinct temperate and cold ice layers in the Olivares Alfa Glacier. Most modern helicopter-borne GPR systems are pulsed, that is, a short duration pulse is fed into the transmitting antenna. As an alternative, Krellmann and Triltzsch (Reference Krellmann and Triltzsch2012) developed a helicopter-borne stepped-frequency GPR (HERA-G). A series of mono-frequency signals are used to step through the required frequency range.
Most recently, Urbini and others (Reference Urbini2017) developed a helicopter-borne system with a pair of 40 MHz antennas attached to a wooden bird perpendicular to the flight direction. They noted that their data quality strongly depends on the surface roughness and water content of the glacier ice. Similar observations were made by Rutishauser and others (Reference Rutishauser, Maurer and Bauder2016). They published results from a comprehensive survey of ~1500 km helicopter-borne GPR profiles acquired in the Swiss Alps. Both systems, the BGR-P30 and the HERA-G system were employed as well as a commercial 70 MHz GPR system with unshielded SUBECHO-40 antennas (Radarteam Sweden AB, 2017) and a GSSI SIR-3000 control unit produced by Geophysical Survey Systems Incorporated (Geophysical Survey Systems Inc., 2017). The GPR systems showed varying degrees of success of detecting the ice-bedrock interface underneath the glaciers in the Swiss Alps. However, the systems were mostly operated on different glaciers, such that a direct comparison of the data quality was difficult. The deepest visible bedrock reflection (DVR) of 613.6 m was measured on the Great Aletsch Glacier with the BGR-P30 system, which was the helicopter-borne GPR system operated with the lowest center frequency. It also provided the highest coverage of traceable bedrock reflections in the GPR profiles with 46.8--68.9%. Overall, only in 46.2% of the acquired GPR profiles the bedrock reflection was visible, which highlights the difficulties of helicopter-borne systems operated over temperate glacier ice compared with surveys on cold ice glaciers.
A direct comparison of a ground-based profile with a helicopter-borne profile on the Allalin Glacier revealed a generally lower data quality of the helicopter-borne data (Rutishauser and others, Reference Rutishauser, Maurer and Bauder2016). This is likely caused by geometrical spreading of the electromagnetic waves (Reynolds, Reference Reynolds2011) and a change in radiation pattern, when the GPR antenna is elevated and, therefore, further away from the target. Finally, it has been observed that the orientation of GPR antennas has a substantial effect on data quality. Moran and others (Reference Moran, Greenfield and Arcone2003) and Langhammer and others (Reference Langhammer, Rabenstein, Bauder and Maurer2017) showed the importance of the antenna axis alignment in relation to the underlying subsurface topography. This is shown in Figure 1 adapted from Langhammer and others (Reference Langhammer, Rabenstein, Bauder and Maurer2017). It displays two coincident ground-based profiles measured across the Otemma Glacier, Switzerland, with 25 MHz GPR antennas. The profiles were acquired with both antennas either oriented parallel (Fig. 1a) to the glacier flow or perpendicular (Fig. 1b). The quality of the bedrock reflection differs strongly between the profiles. Similar observations were made for other helicopter-borne data (Langhammer and others, Reference Langhammer, Rabenstein, Bauder and Maurer2017). For valley-type glaciers, the antenna axis should be aligned parallel to the strike direction of valley walls (usually parallel to the glacier flow) to obtain optimal results (Fig. 1a), but for plateau-type glaciers and saddle areas with undulating bedrock topography it becomes difficult to determine a suitable antenna orientation.
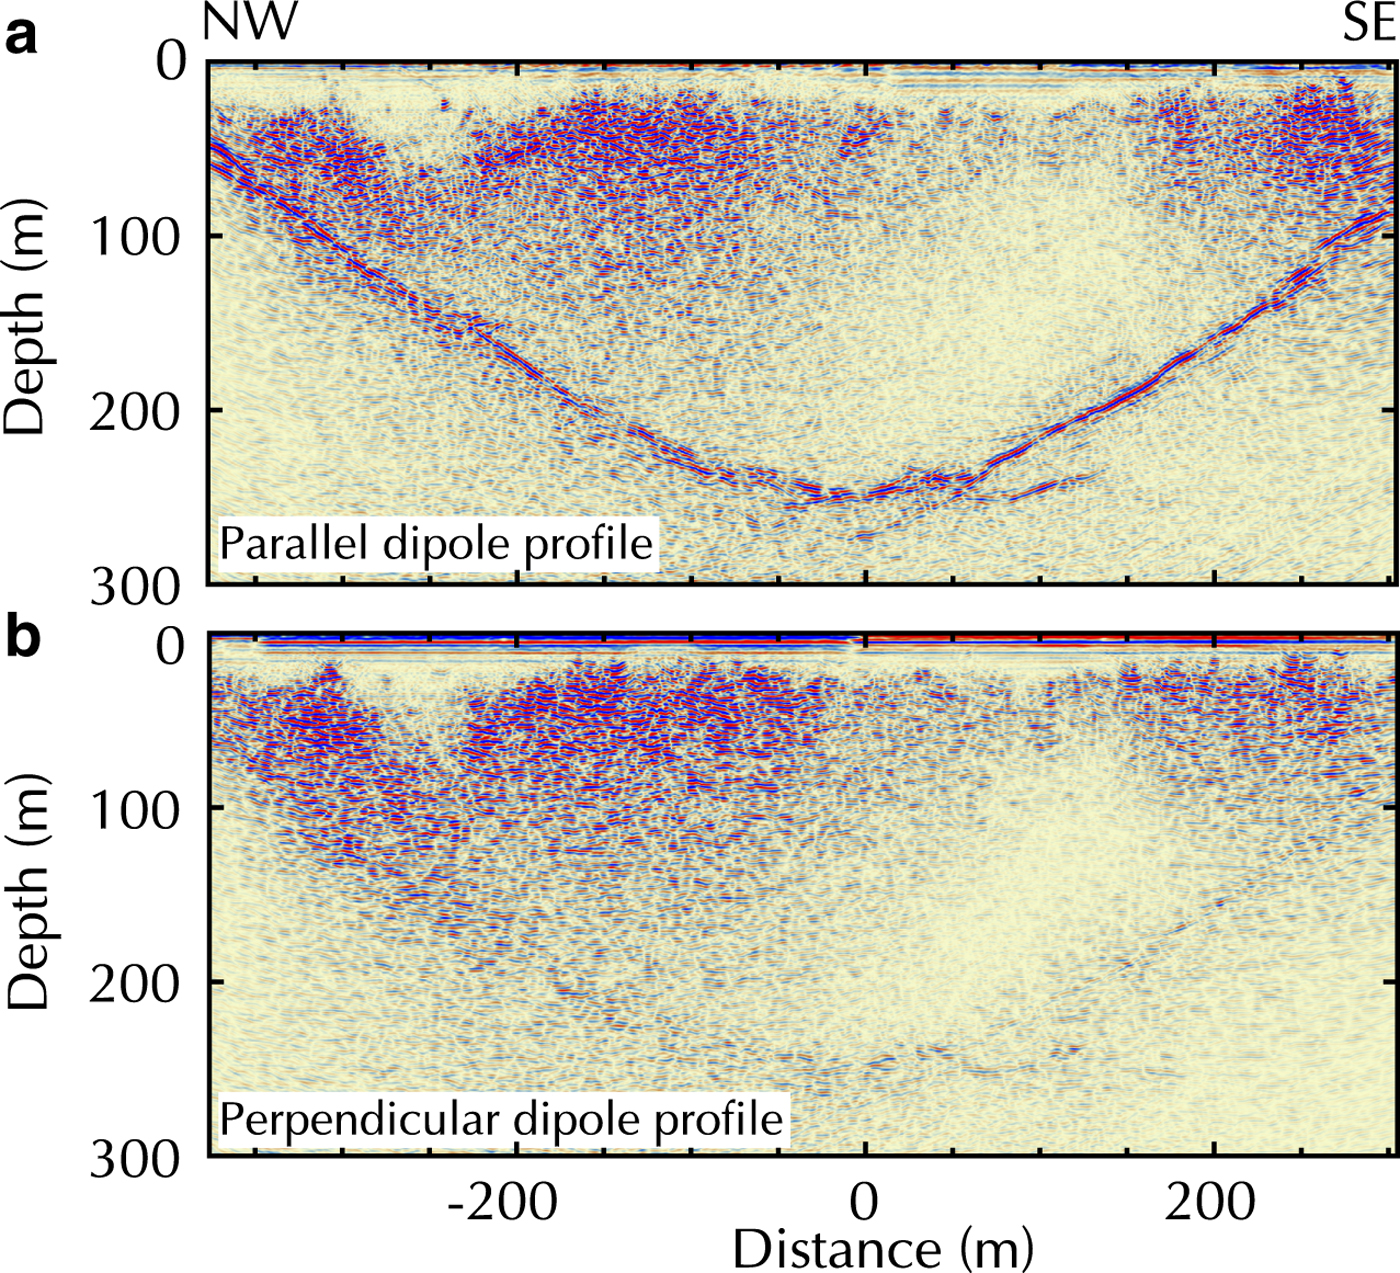
Fig. 1. Ground-based 25 MHz profile cross the Otemma Glacier with antenna axis aligned parallel to the strike direction of the valley walls (a) and perpendicular to it (b). Adapted from Langhammer and others (Reference Langhammer, Rabenstein, Bauder and Maurer2017).
Based on our review of helicopter-borne GPR systems employed on temperate glaciers, we can draw three important conclusions.
(1) It is advisable to employ low-frequency antennas of 25 MHz or less for mapping the bedrock topography underneath temperate Alpine glaciers.
(2) The high velocity contrast between air and ice strongly influences the propagation of the electromagnetic waves and should be considered appropriately during data processing.
(3) The antenna orientation has a major influence on the data quality.
To address these problems, we have developed a novel GPR system and modified the processing flow appropriately. After a brief discussion of 2-D and 3-D antenna radiation patterns of helicopter-borne systems at typical flight heights, we introduce our AIR-ETH system (Airborne Ice Radar ETH Zurich). One of its unique features is its capability of recording GPR dual-polarization data. We outline, how such a system can be realized using standard commercial components. Besides providing details of the technical setup, we propose a strategy, how helicopter-borne dual-component data can be processed. The performance of our acquisition and processing strategy is finally demonstrated with field examples from typical plateau and valley glaciers in the high-mountain environment of the Swiss Alps.
2. DIPOLE RADIATION PATTERN
2.1. 2-D representation
In conventional glaciological GPR surveys of the bedrock topography, only one transmitting and one receiving GPR antenna are used. They are usually placed in broadside or end-to-end configuration and transported with a fixed orientation along the survey line. As shown in Langhammer and others (Reference Langhammer, Rabenstein, Bauder and Maurer2017), the orientation of the GPR antennas is a crucial parameter to consider for detecting the bedrock topography and can influence data quality significantly. This is caused by the specific shape of GPR antenna radiation patterns. For helicopter-borne applications, the antennas can be approximated with infinitesimal dipoles. Engheta and others (Reference Engheta, Papas and Elachi1982) calculated the analytical far-field solution for an infinitesimal dipole, which was later advanced by Arcone (Reference Arcone1995). The analytical solution can be used to calculate the 2-D radiation pattern for a dipole either placed in a full space (i.e. when the helicopter flies at a high altitude) or at an interface between two dielectric media (i.e. for ground-based surveys). Generally, the H-Plane corresponds to the plane perpendicular to the dipole axis, while the parallel plane is referred to as E-Plane. Figure 2 shows the downward far-field radiation pattern calculated analytically of an electromagnetic infinitesimal dipole in a full space and the numerical results for antenna heights of 1, 20 and 40 m above a half space consisting of air and ice. For solving the analytical equations, we used an index of refraction n=1 for air and n=1.31 for ice and a frequency (f) of 20 MHz. The numerical radiation pattern was generated with the finite-difference time-domain electromagnetic simulation software gprMax (Giannopoulos, Reference Giannopoulos2005). Further details about the simulation and the parameters used can be found in Langhammer and others (Reference Langhammer, Rabenstein, Bauder and Maurer2017).
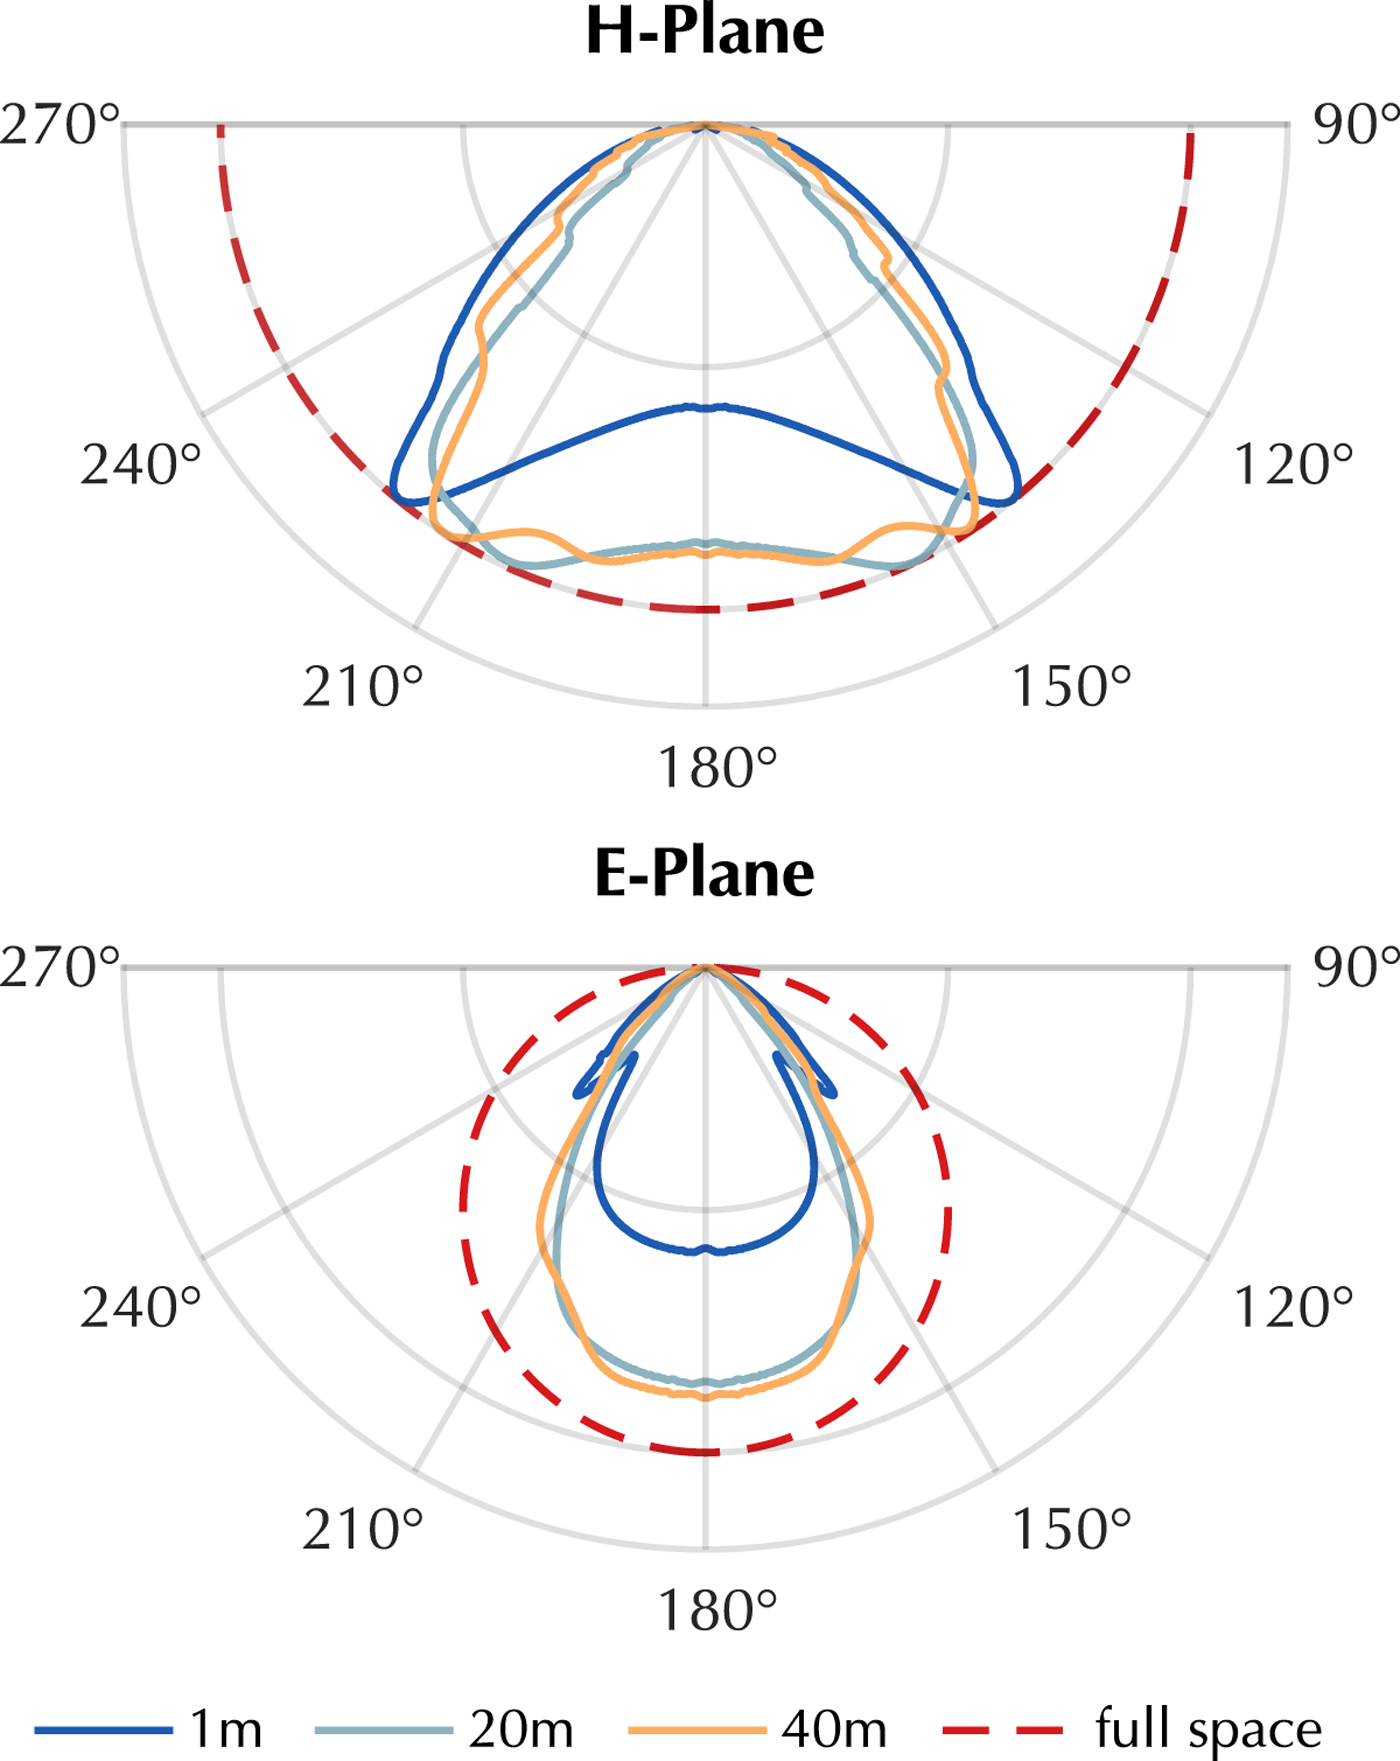
Fig. 2. Polar plots (H- and E-Plane) of radiation pattern of an infinitesimal dipole in full space (air) and placed on a half space interface (air/ice). Theonly lower half of polar plot is displayed. Analytical full space solution (dotted) and numerical curves for 1, 20 and 40 m antenna height (solid lines). Curves are area-normalized.
The radiation patterns in Figure 2 are area normalized in the H-Plane, such that the comparison of the distinct distribution of the amplitude is possible. In full space, the radiation pattern takes the shape of a doughnut with highest amplitudes perpendicular to the dipole axis and very low amounts at the ends of the antenna. Placing the dipole close to an interface for example, air and ice, changes the energy distribution of the amplitude along the wavefront as seen in Figure 2, because of the differing geophysical parameters of the two media. At 1 m distance from the surface and at ~140° and 220° in the H-Plane, high amplitude regions are formed in contrast to the uniform pattern of the full space solution. In the E-Plane side lobes occur and nulls are observed at ~140° and 220°. By lifting the dipole away from the half-space interface the radiation pattern shifts from an ideal half space curve toward the full space solution. It is important to notice that even with the dipole 40 m above the ground the radiation pattern does not correspond to the full space representation. This is caused by the generally low antenna frequencies (e.g. 25 MHz) and, therefore, the long wavelength of 12 m in air and ~6.68 m in temperate ice. Typical flight heights of 10--40 m above ground correspond thus only to a few wavelengths. Recent work by Diamanti and Annan (Reference Diamanti and Annan2013) showed that the transition to far-field behavior typically appears at 10 wavelengths. Higher amplitude regions can still be observed at ~150° and 210° in H-Plane for 40 m antenna elevation (Fig. 2). We conclude, that for helicopter-borne GPR measurements neither the full space nor the half space solution are applicable as long as the antennas are transported close to the ice surface.
2.2. 3-D interpolation and pseudoscalar wavefields
We demonstrated that the radiation pattern for 20 MHz dipoles placed reasonably close (≤40 m) to the ice surface still exhibit high amplitude side lobes. For our helicopter-borne surveys this observation causes significant problems, since regions perpendicular to the antenna axis at an angle of ~140°–160° and 200°–220° will be illuminated with higher amplitudes than the area directly underneath (180°) the antennas. Additionally, due to the nature of dipole antennas, less energy is radiated parallel to the axis. To illustrate this, we interpolated the 2-D H- and E-plane into 3-D by rearranging the analytical expressions by Engheta and others (Reference Engheta, Papas and Elachi1982) to
 $$A = [(S_1 - S_0) {sin}^2 \phi +S_0]^{{1}/{2}} $$
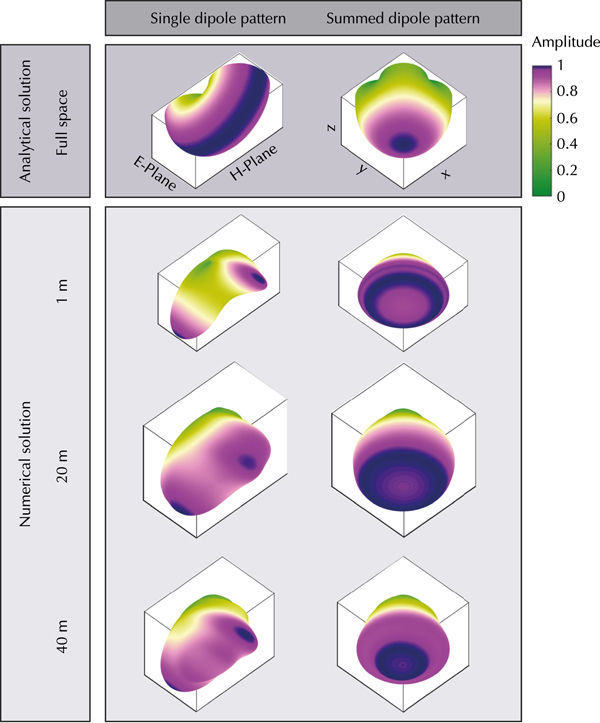
with A being the amplitude along the 3-D surface, S 0 and S 1 the power of the 2-D planes and 0<ϕ⩽ 2π. The results are shown in Figure 3 (left panel) as single dipole patterns for the full space and 1, 20, 40 m above the ice surface.

Fig. 3. Single (left) and summed (right) interpolated 3-D amplitude radiation pattern of an infinitesimal dipole in full space (air) and placed above a half space interface (air/ice). View angle from underneath, looking upwards. Color scale nonlinear.
Based on Lehmann and others (Reference Lehmann, Boerner, Holliger and Green2000), electromagnetic field components can be summed to simulate a more symmetric radiation pattern; called ‘pseudoscalar’ wavefields. This can be achieved by utilizing two broadside transmitter and receiver antenna sets, which are perpendicular to each other. Their signals can be summed to enhance the signal-to-noise ratio, and more importantly, to tune the radiation characteristics. The amplitude of the 3-D summed pseudoscalar wavefields are visualized in Figure 3. We summed two interpolated 3-D single dipole radiation pattern; one with the H-plane parallel to the x-axis and the other one 90° rotated (H-plane parallel to the y-axis). With increasing height, the highest amplitudes are observed underneath the dipoles and the effect of the side lobes decreases. Based on the results shown in Figure 3, we conclude that an acquisition system with two sets of orthogonal antenna pairs is expected to improve the data quality significantly. This motivated us to build the AIR-ETH system, as described in the next section.
3. AIR-ETH SYSTEM SETUP
The system consists of commercial GPR components (Table 1), which are mounted on a wooden frame and carried underneath a helicopter (Fig. 4c). It is hanging from a ~14 m rope, which can be released in case of emergency, and wings are attached to the back to ensure a stable trajectory during the flight. The wooden frame is constructed as a connector system (Fig. 4b, c). Individual parts of the GPR setup are the NIC-500X control unit and four 25 MHz unshielded dipole antennas build by Sensors & Software (2017). Other frequencies can be employed as well since the system consists of interchangeable antenna elements. The transmitter and receiver antenna of the individual pairs are attached in broadside configuration, but both pairs are placed perpendicular to each other to collect dual-polarization data during the survey. The GPR hard- and software, located in the box on the platform in the middle of the frame (Fig. 4a, b) can be controlled via any device with a browser and a wireless connection (e.g. labtop, tablet) while sitting in the helicopter. Additionally, three differential GNSS receivers are attached to the corners of the frame for determining the position as well as pitch, roll and yaw of the system during flight with a temporal sampling rate of 1 Hz. To measure the height of the system above the surface, we installed a LDM-301 laser altimeter. For navigation purposes, the GNSS position and elevation above ground is simultaneously displayed on a screen in the helicopter cockpit. Finally, a downward looking GoPro camera is attached to the platform to collect images of the space underneath the system. The system and the transmitter and receiver antenna modules are powered by two 12 V 38 Ah batteries with enough energy to operate the system for 10 hours.
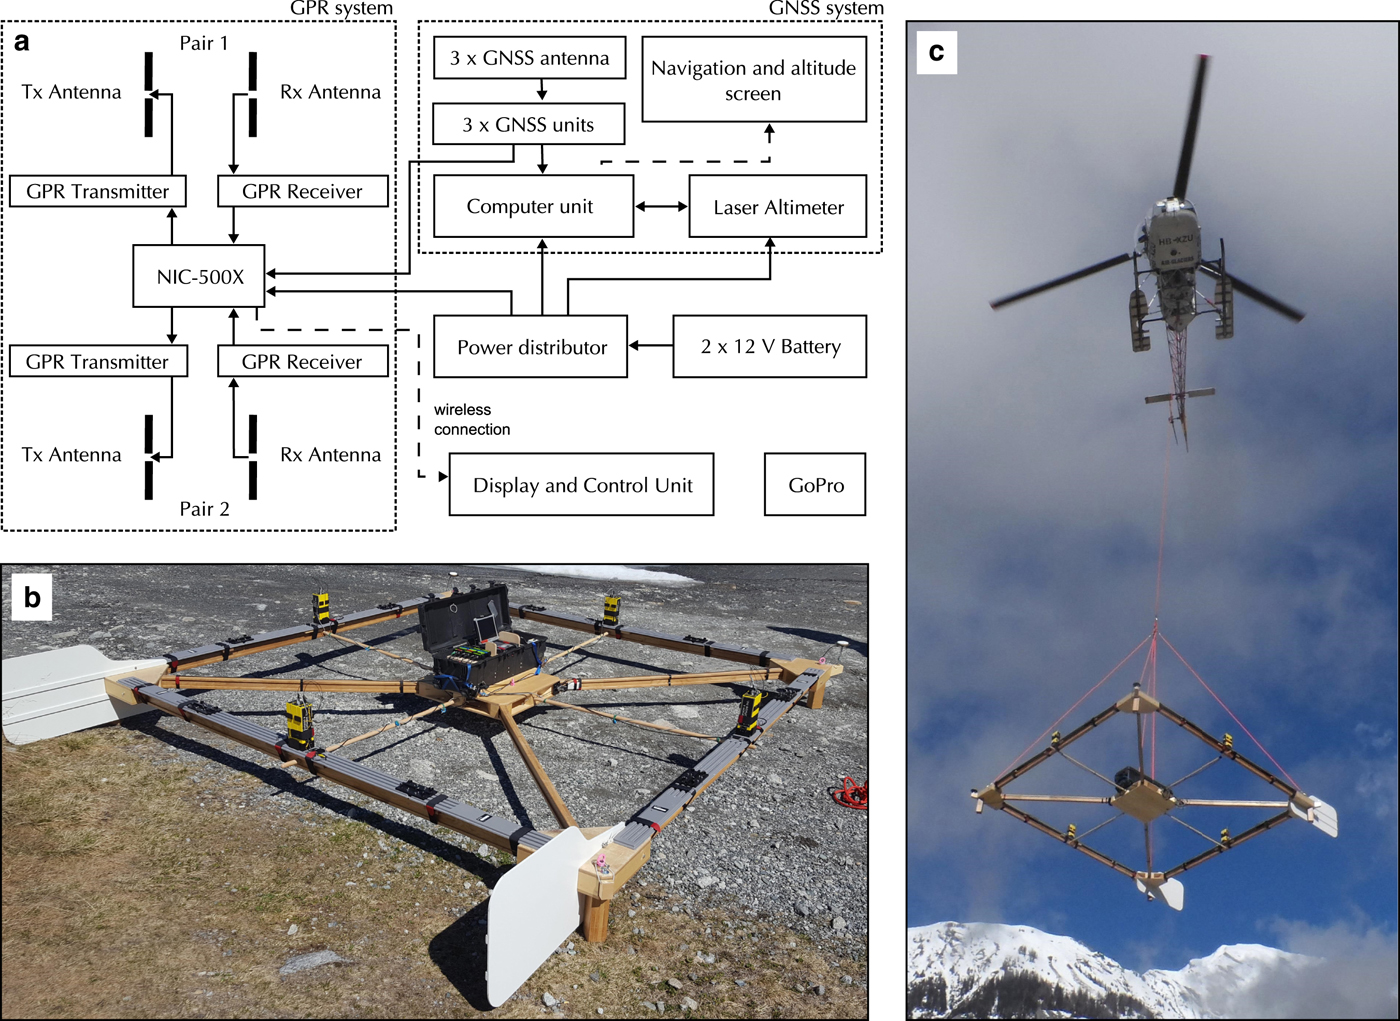
Fig. 4. Technical sketch of the helicopter-borne dual-polarization GPR system (a). For each dipole pair, the transmitter and receiver antenna are mounted in broadside configuration. The AIR-ETH system on the ground (b) and during take off (c).
Table 1. Helicopter-borne GPR system components
4. DATA PROCESSING AND RESULTS
To demonstrate the capabilities of our helicopter-borne dual-polarization GPR system, we will show results from two glaciers in Switzerland with different morphologies. First, we present the case study of the Glacier de la Plaine Morte (hereby referred to as Plaine Morte Glacier). Here, we describe the GPR data processing steps and highlight the bedrock reflection differences in the individual channels along the profiles. Second, we present a GPR data set from the debris-covered Oberaletschgletscher (hereby referred to as Oberaletsch Glacier) to demonstrate the performance of the AIR-ETH system in a more complex environment.
4.1. Case study 1: Plaine Morte Glacier
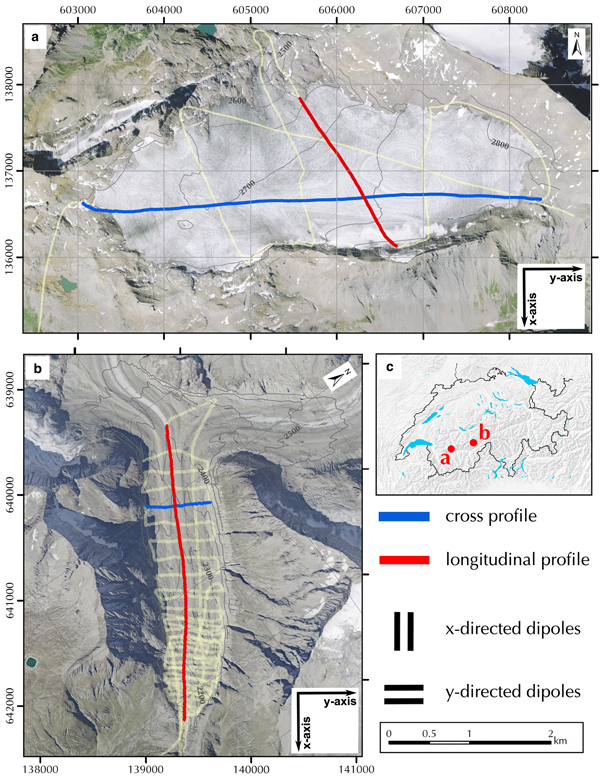
The Plaine Morte Glacier is situated between 2400–3000 m a.s.l. in the western Swiss Alps (Fig. 5a). With an area of 7.5 km2 in 2016, it is the largest plateau glacier in the European Alps (Bauder, Reference Bauder2017). Over 90% of the glacier is located at an altitude of 2650–3000 m a.s.l. and thus has a shallow surface slope of <4°. It drains into a short glacier tongue towards the North. In recent years, the glacier has been entirely snow free in summer, because of its particular plateau shape and an increasing equilibrium line altitude (Bauder, Reference Bauder2017). The flat and undulating surface of the Plaine Morte Glacier gives ambiguous indications about the underlying bedrock topography. As a result, it becomes challenging to determine the preferred orientation of the GPR antennas by looking at the strike direction of the surrounding valley walls. Therefore, we decided to measure the profiles with the AIR-ETH system with its dual-polarization GPR antenna configuration. In spring 2017, we collected several profiles of helicopter-borne GPR data on the Plaine Morte Glacier (Fig. 5a). Here, we will focus on one cross (W-E) and one longitudinal profile (N-S) for further analysis.
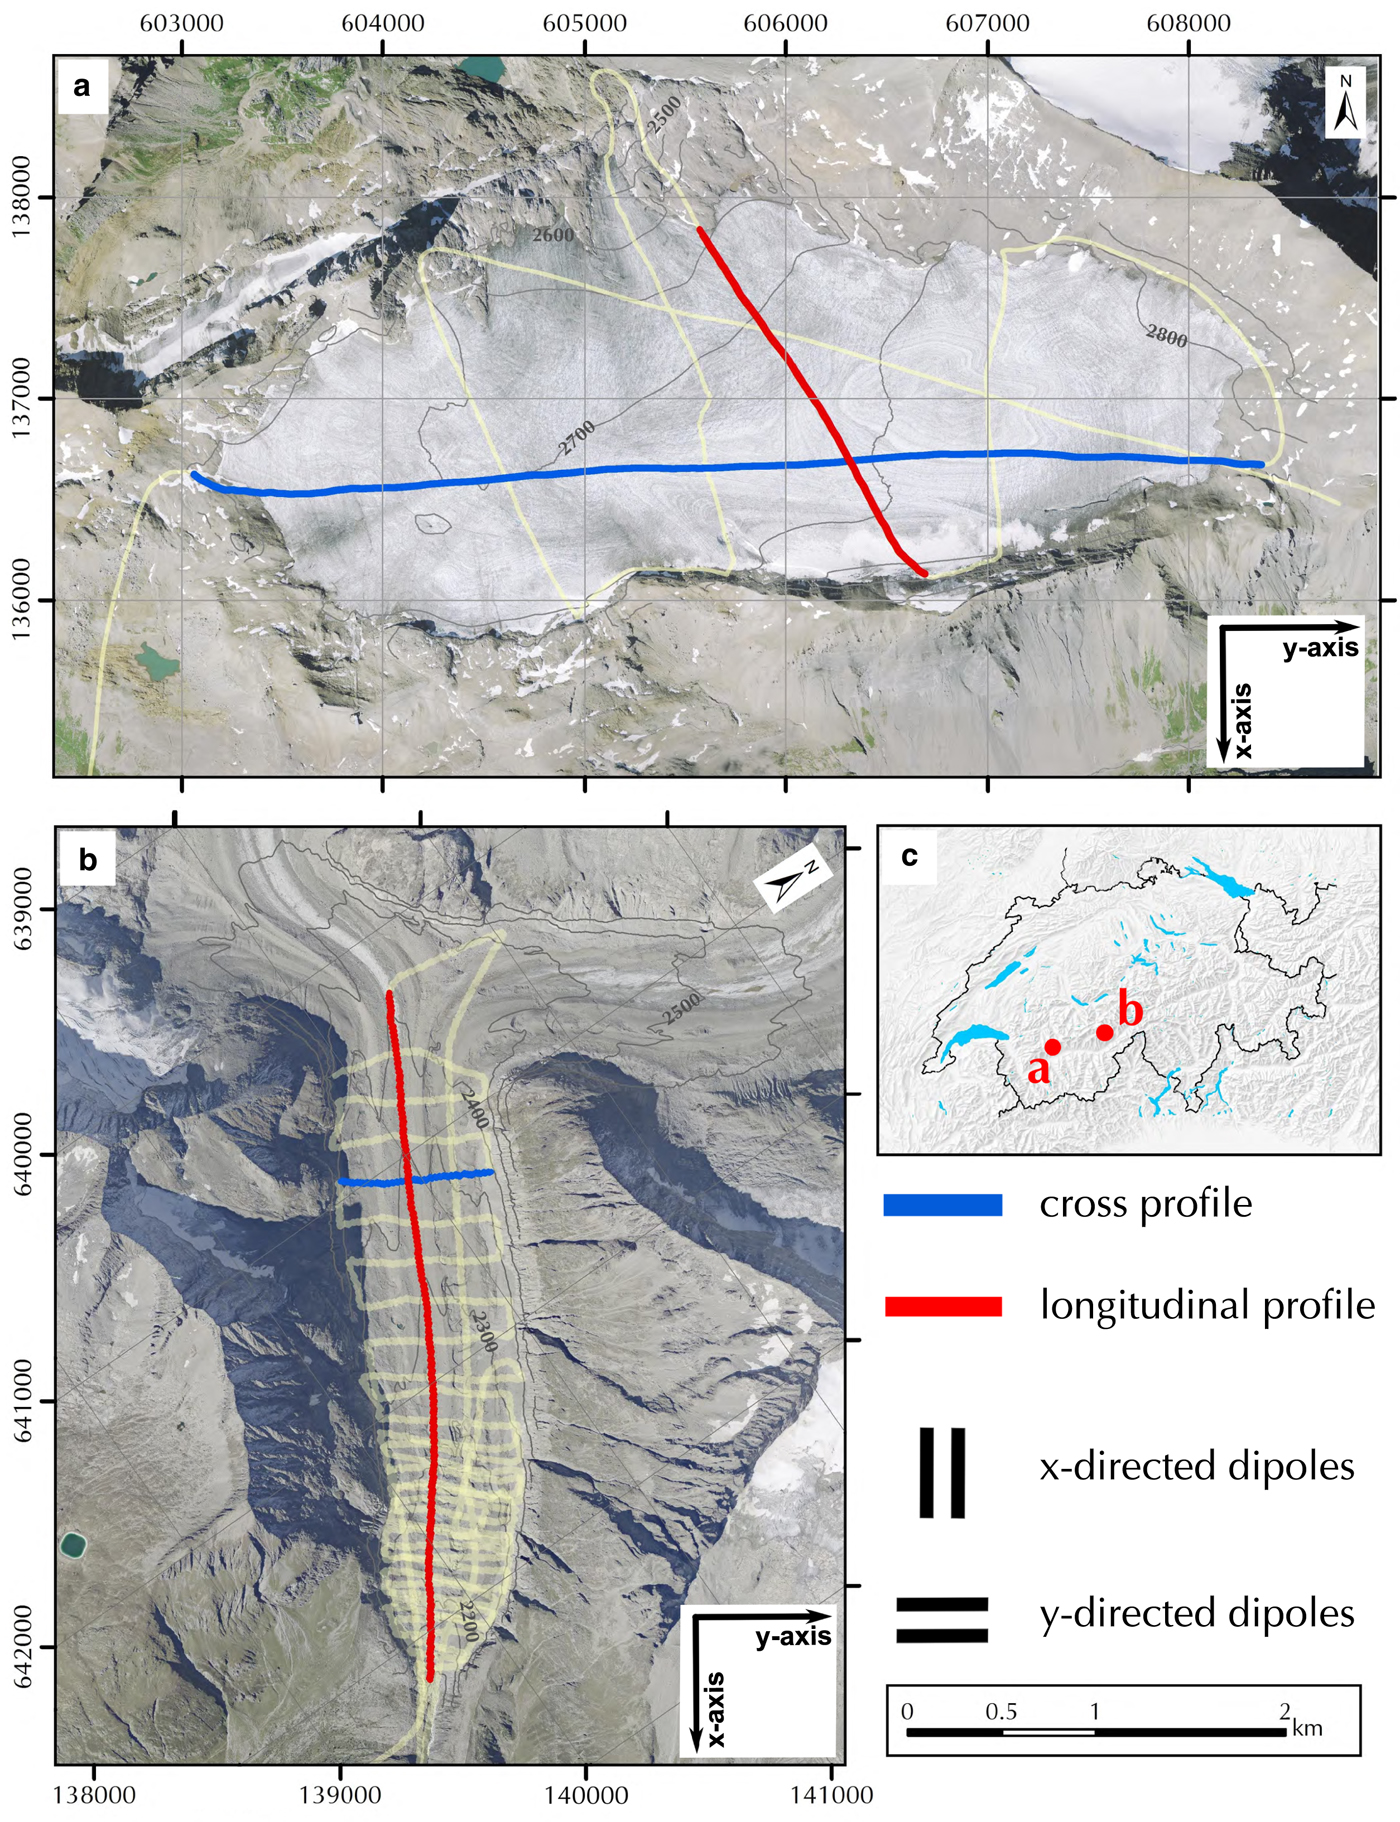
Fig. 5. Map of the survey area Plaine Morte Glacier (a) and Oberaletsch Glacier (b). Orthophotos© 2017 swisstopo (JD100042). Coordinate system: CH1903-LV03. Location of both glaciers in Switzerland (c). Yellow lines correspond to the entire survey grid measured during the campaign, while the cross (blue) and longitudinal (red) profiles are described in further detail. The x-axis is approximately parallel and the y-axis is perpendicular to the glacier flow direction.
4.1.1. Data processing
In the context of this paper, we will follow the terminology of x- and y-directed dipoles when referring to the GPR antenna orientation (see also Fig. 5) so that the terminology is irrespective of the survey direction or flight path of the helicopter. Dipoles orientated in x-direction have an approximate axis orientation parallel to the flow direction of the glacier and thus, are parallel to the strike direction of the surrounding valley walls in the tongue area. Consequently, y-directed dipoles are aligned perpendicular to the glacier flow.
During our surveys in the Swiss Alps and the development of the system, we noticed the strong influence of the helicopter type on the strength of ringing noise in the GPR data recorded with the AIR-ETH system. The bigger the helicopter and the closer the GPR system is attached, the stronger is the overlying ringing. We also tested detaching individual parts of the system (GNSS equipment, Laser altimeter, one antenna pair), but concluded that the helicopter is the key noise source in our datasets. Our raw data, displayed as a section of the cross profile on the Plaine Morte Glacier in Figure 6a-1 to c-1, is dominated by ringing down to ~1500 ns. Strong ringing causes a saturation of the GPR Receiver A/D converter and the incoming signal is clipped. However, the degree and occurrence of ringing can vary, when other GPR systems are employed.
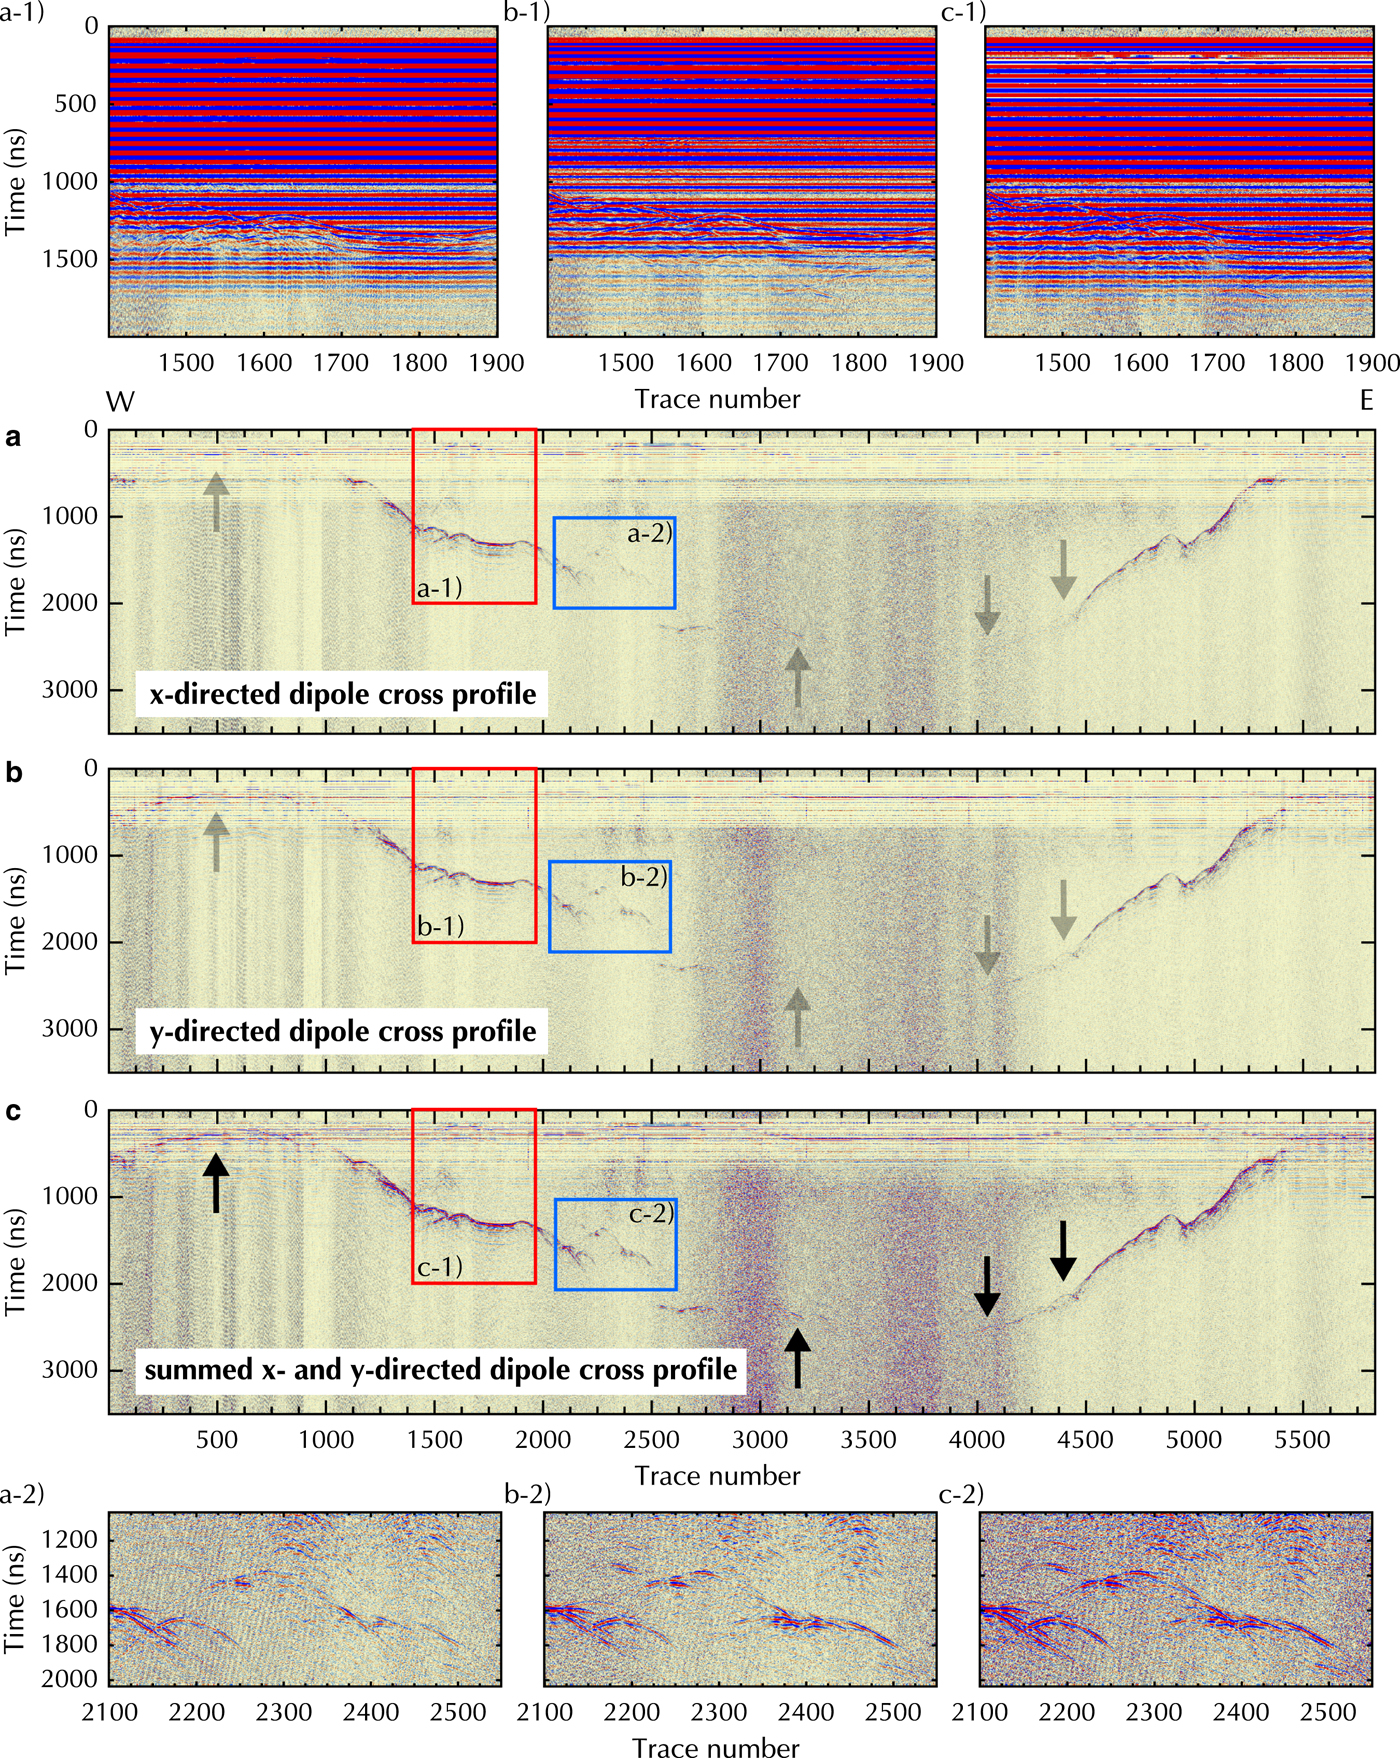
Fig. 6. Cross profile with only SVD filter applied for x-, y- and summed x- and y-directed dipoles (a-c) on the Plaine Morte Glacier. First enlarged section (a-1 to c-1) displays raw data with ringing (position marked as a red rectangle). Second enlarged section (a-2 to c-2) shows area of subsurface uprise to demonstrate enhancement of bedrock reflection due to summing of x- and y-directed dipoles (position marked by blue rectangle). Arrows indicate the area of interest.
To improve the image quality and to process our dual-polarization GPR data, we have developed in-house routines written in MATLAB and using the CREWES MATLAB software (Margrave, Reference Margrave2003). They include standard GPR processing steps (Table 2) and specific modification for our helicopter-borne acquisition (Table 3). To localize the recorded profiles, we assign differential GNSS coordinates to the individual traces. A custom software running-average filter (Sensors & Software, 2017) is applied to dewow the data. Then, we transform the GPR data into the industry standard format SEG-Y. Following the pseudoscalar approach (Lehmann and others, Reference Lehmann, Boerner, Holliger and Green2000), the x- and y-directed dipole datasets are summed to create a third set, which is processed in the same manner as the other ones. We statically correct for time zero and apply an amplitude interpolation algorithm based on a third-order polynomial function to recover the clipped signal content (Ammann, Reference Ammann2017). Afterward, the position of the surface reflection is automatically determined by using the system-surface distance measured with the laser altimeter. Depending on the quality and consistency of the laser data, the surface reflection has to be picked manually. To reduce the ringing noise caused by the helicopter, we use a singular value decomposition filter (SVD) with the first two eigenvalues set to zero and a window length equal to the absolute number of traces of the profiles. Furthermore, we apply a bandpass filter with corner frequencies of 10 and 40 MHz. The trace spacing is equalized to 1 m by assigning the nearest-neighbor trace to the binning center. Further processing includes a reversed-time migration to collapse diffractions and to locate dipping layers accurately in the subsurface. For this step, we generate a half space model with an air velocity of 0.3 m ns−1 and a uniform ice velocity of 0.167 m ns−1 (Reynolds, Reference Reynolds2011). As a final step, the GPR profiles results are displayed as depth versus distance and the energy signal content of the later arrivals is enhanced by applying a time-variant gain function (e at, a is a scaling factor and t denotes time). The gain parameters and color scale of the x- and y-directed dipole profiles are identical to compare the performance of the individual channels. For the summed x- and y-directed profile, the gain parameters are set for best visibility of the bedrock reflection.
Table 2. Data processing parameters
Table 3. Data acquisition parameters
4.1.2. Results
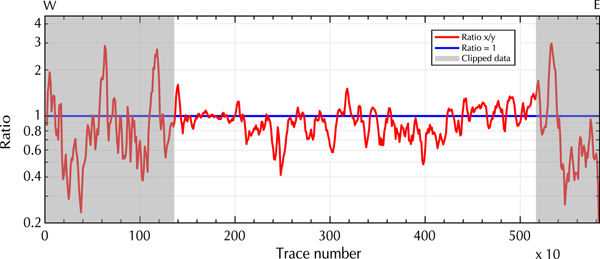
Figure 6a, b and c illustrates the bedrock reflection quality in the raw data of the individual channels. Here, we only applied a SVD filter to remove the ringing signal to further analyze the amplitudes of the bedrock reflection along the profile. After deleting the ringing, the clipped signal content becomes visible as light horizontal strips in the upper 700–800 ns of Figure 6a, b and c. The surface reflection at trace number 500 is distorted, but better visible in the y-directed dipole data. In contrast, the bedrock reflection is stronger in the x-directed dipole profile at trace number 3200. These differences can be analyzed by comparing the power content along the bedrock reflection interface as a ratio of the x- and y-directed dipole data (Fig. 7). Gray sections in Figure 7 should not be considered, because in these areas the ringing effects dominate the received signal and distort the surface and subsurface reflection amplitudes. In each profile, we picked the interface manually in a window of 50 samples, created a spectrogram for each trace separately and determined the power content (dB Hz−1) for the interface in a range between 10 and 40 MHz. To smooth the results, we merged ten traces to create a segment and used the ratio of the x- and y-directed data for further analysis. We observed that in case of the Plaine Morte Glacier, there is no dominantly stronger channel. The image of the bedrock topography varies in quality within the individual channels and in comparison with each other. While the bedrock reflection is visible in the deeper parts of the glacier in the x-directed dipole data between 2000 and 3000 ns (Fig. 6a), the y-directed dipole profile shows stronger reflections at the bedrock rise at trace numbers 2100–2500 (Fig. 6b). The ratio varies in selected areas from 0.4, which indicates an up to 2.5 times stronger power in the y-directed dipole profile, to 1.5 and, therefore, a stronger bedrock reflection amplitude in the x-directed dipole data. However, the horizontal reflector at traces 1600-1900 is imaged equally well with both polarizations (ratio ≈ 1). The variation of the ratio can be explained by undulations of the subsurface bedrock topography. The Plaine Morte Glacier is atypical for Swiss glaciers and fills rather a plateau than a characteristic u-shaped mountain valley. As mentioned in Langhammer and others (Reference Langhammer, Rabenstein, Bauder and Maurer2017), the polarization of the dipoles determines the sensitivity of the antennas to detect the bedrock dip and strike direction. Operating only one polarization would have been insufficient to obtain optimal results.
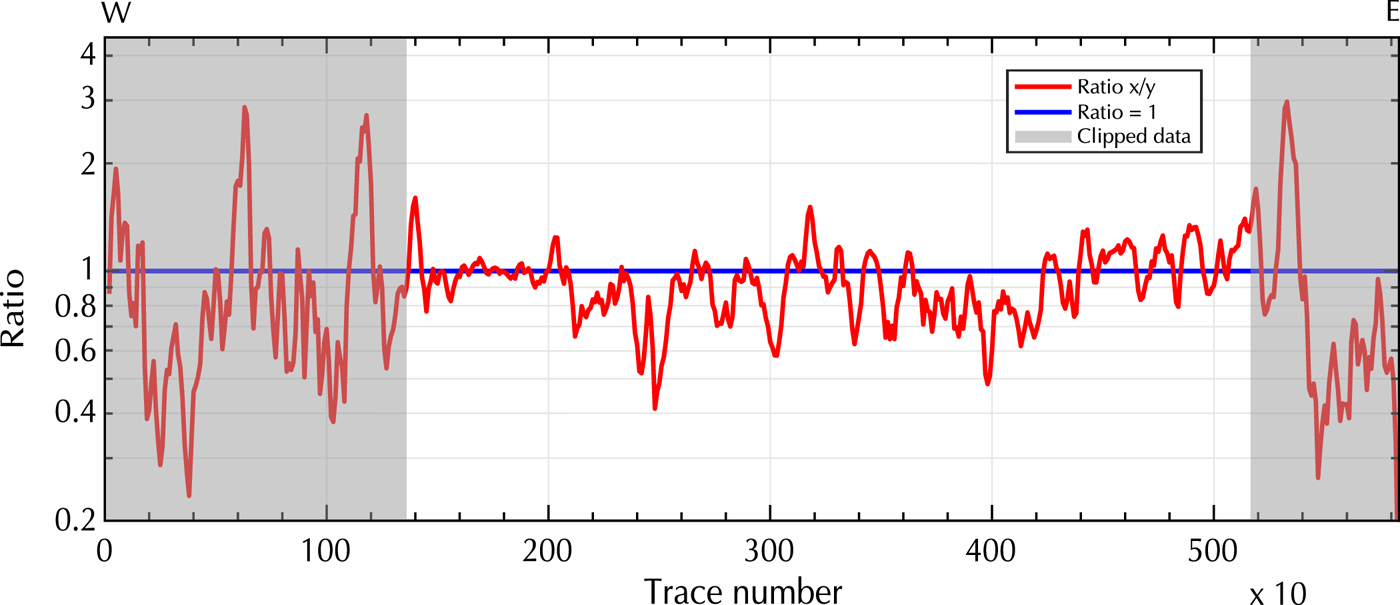
Fig. 7. Ratio (x/y) of the power content of the x- and y-directed dipole bedrock reflection of the cross profile on Plaine Morte Glacier. Gray areas indicate where the data are predominately influenced by ringing and clipping effects. Y -axis displayed as log-scale.
The summed x- and y-directed dipole profile is displayed in Figure 6c. It can be observed, that the surface reflection is more coherent and the ice/bedrock interface is traceable more consistently below 2000 ns. The uprise in the subsurface at trace 2100–2500 is well defined in space (Fig. 6c-2) and the overall bedrock reflection is more dominant in comparison with the background noise.
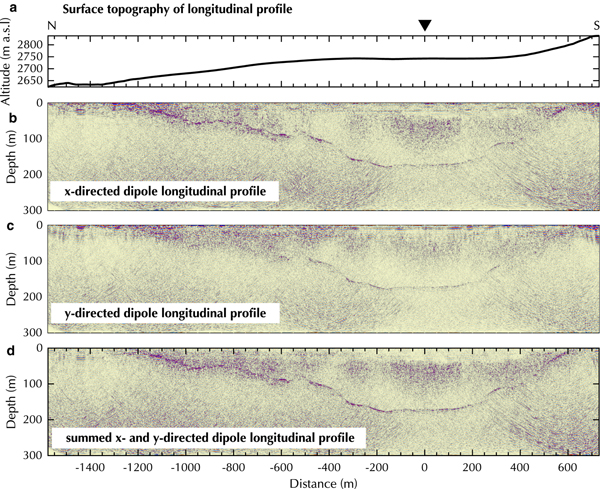
Figure 8 and 9 show the two selected fully processed profiles of the Plaine Morte Glacier. The vertical axis in all processed profiles shows depth below the surface. The crossover point of the cross and longitudinal profile is marked with a black triangle and a distance of 0 m. Similar to the results in Figure 6, the difference in bedrock reflection quality in Figure 8 is apparent when the x- and y-directed dipole datasets are compared. While the bedrock reflection below 100 m depth is more visible in the x-directed dipole profile, the uprise at  $\sim -1800\,{\rm m}$ distance is better defined in the y-directed dipole data. By summing both orientations (Fig. 8d) a second uprise and hummock at −800 to −1500 m become visible. Additionally, at greater depth and between −1000 and 500 m distance the coherency and visibility of the bedrock reflection are increased. In all profiles, a diffuse, vertical noise pattern can be seen in the middle section of the cross profile and its intensity does not change with depth. Its origin is unclear.
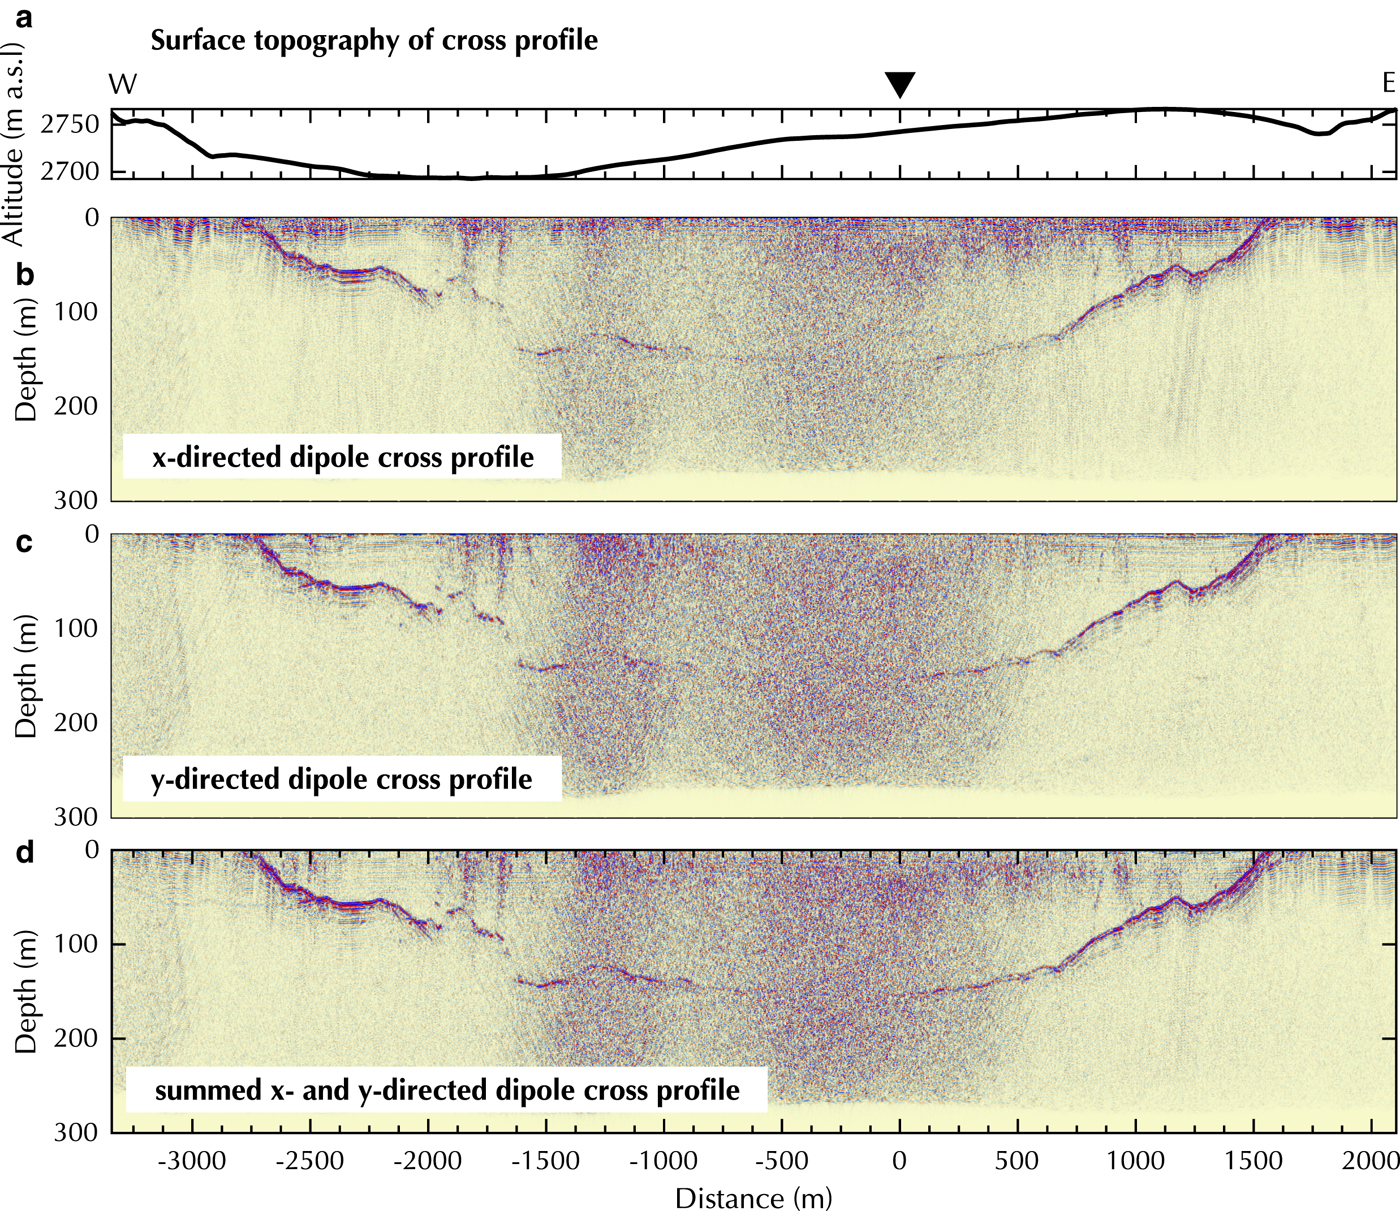
Fig. 8. Processed cross profile on Plaine Morte Glacier with (a) surface topography, (b) x-, (c) y- and (d) summed x- and y- directed dipoles. Black triangle marks cross-over point. Y -axis exaggeration of profiles 3:1.
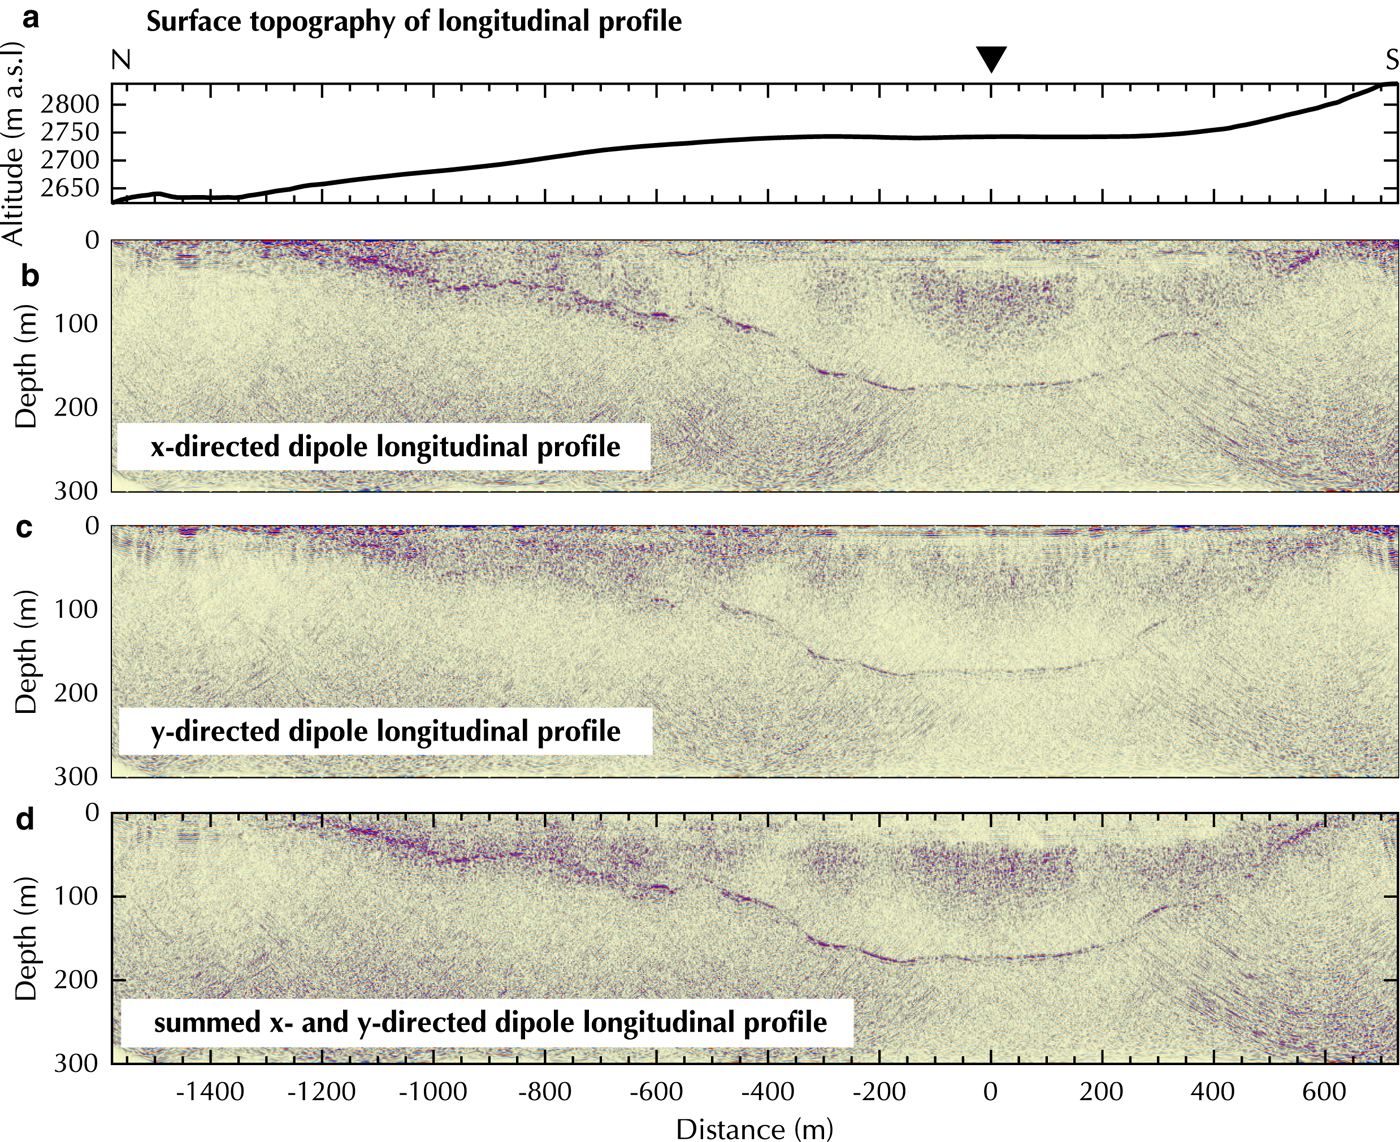
Fig. 9. Processed longitudinal profile on Plaine Morte Glacier with (a) surface topography, (b) x-, (c) y- and (d) summed x- and y- directed dipoles. Y -axis exaggeration of profiles 1.5:1.
The processed data of the longitudinal profile are presented in Figure 9. The bedrock reflection is generally more coherent and stronger in the x-directed dipole dataset, specifically, in the shallower tongue area in which the y-directed dipole data exhibits incoherent scattering. In all three datasets, patches of increased noise or scattering can be observed in 50–100 m depth in the vicinity of the cross-over point. At 600 m distance, a migration artifact occurs below 100 m depth and can be recognized by its characteristic hyperbolic pattern. The summed GPR profile (Fig. 9d) displays an enhanced bedrock reflection especially in the sections of steeply dipping subsurface topography; for example, at a distance of −350 to −400 m in the North and at 200–500 m in the South. We were able to determine the bedrock reflection down to the deepest part of the glacier at ~160 m depth.
4.2. Case study 2: Oberaletsch Glacier
As a second example, we chose the Oberaletsch Glacier (19.58 km2 in 2009) located in the Western Swiss Alps, Switzerland (Fig. 5b). The Oberaletsch Glacier (2150–3900 m a.s.l.) is a valley-type glacier and flows from North towards the South-East. In 2011, it covered an area of ~17.5 km2 and had a length of ~ 9 km (Bauder, Reference Bauder2015). Its tongue is heavily debris-covered (Jouvet and others, Reference Jouvet, Huss, Funk and Blatter2011) and supplied with supraglacial material from the northern headwalls and its tributary glacier from the West, the Beich Glacier (Paul and others, Reference Paul, Huggel and Kääb2004). In late spring 2017, we measured a dense survey grid of helicopter-borne GPR data on the tongue of the Oberaletsch Glacier to characterize the underlying bedrock topography (Fig. 5b). Here, we will present a cross and a longitudinal profile to discuss the performance of the AIR-ETH system on a debris-covered glacier.
4.2.1. Results
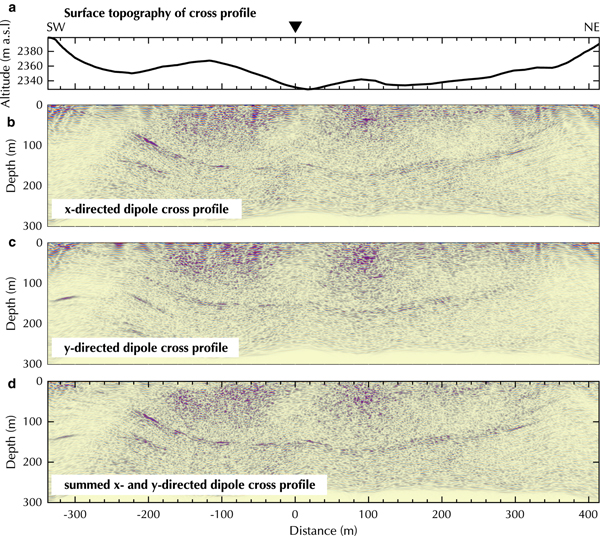
The bedrock reflection in the cross profile (Fig. 10) is less coherent compared with the Plaine Morte Glacier, but it is visible between 60 and 180 m depth. High noise clusters can be observed above 100 m depth and between −20 and −80 m and at 100 m distance. Several potential off-plane reflections in the south-western end (e.g. at −200 and −350 m distance) of the profile occur below 100 m depth. The x-directed dipole profile shows a more prominent bedrock reflection at −200 m distance and at shallower depth (Fig. 10b), whereas the y-directed dipole data image the subsurface syncline at ~−80 to −160 m to a greater extent (Fig. 10c). Summing both datasets enhance the coherency and amplitude of the reflection from the ice-bedrock interface (Fig. 10d).
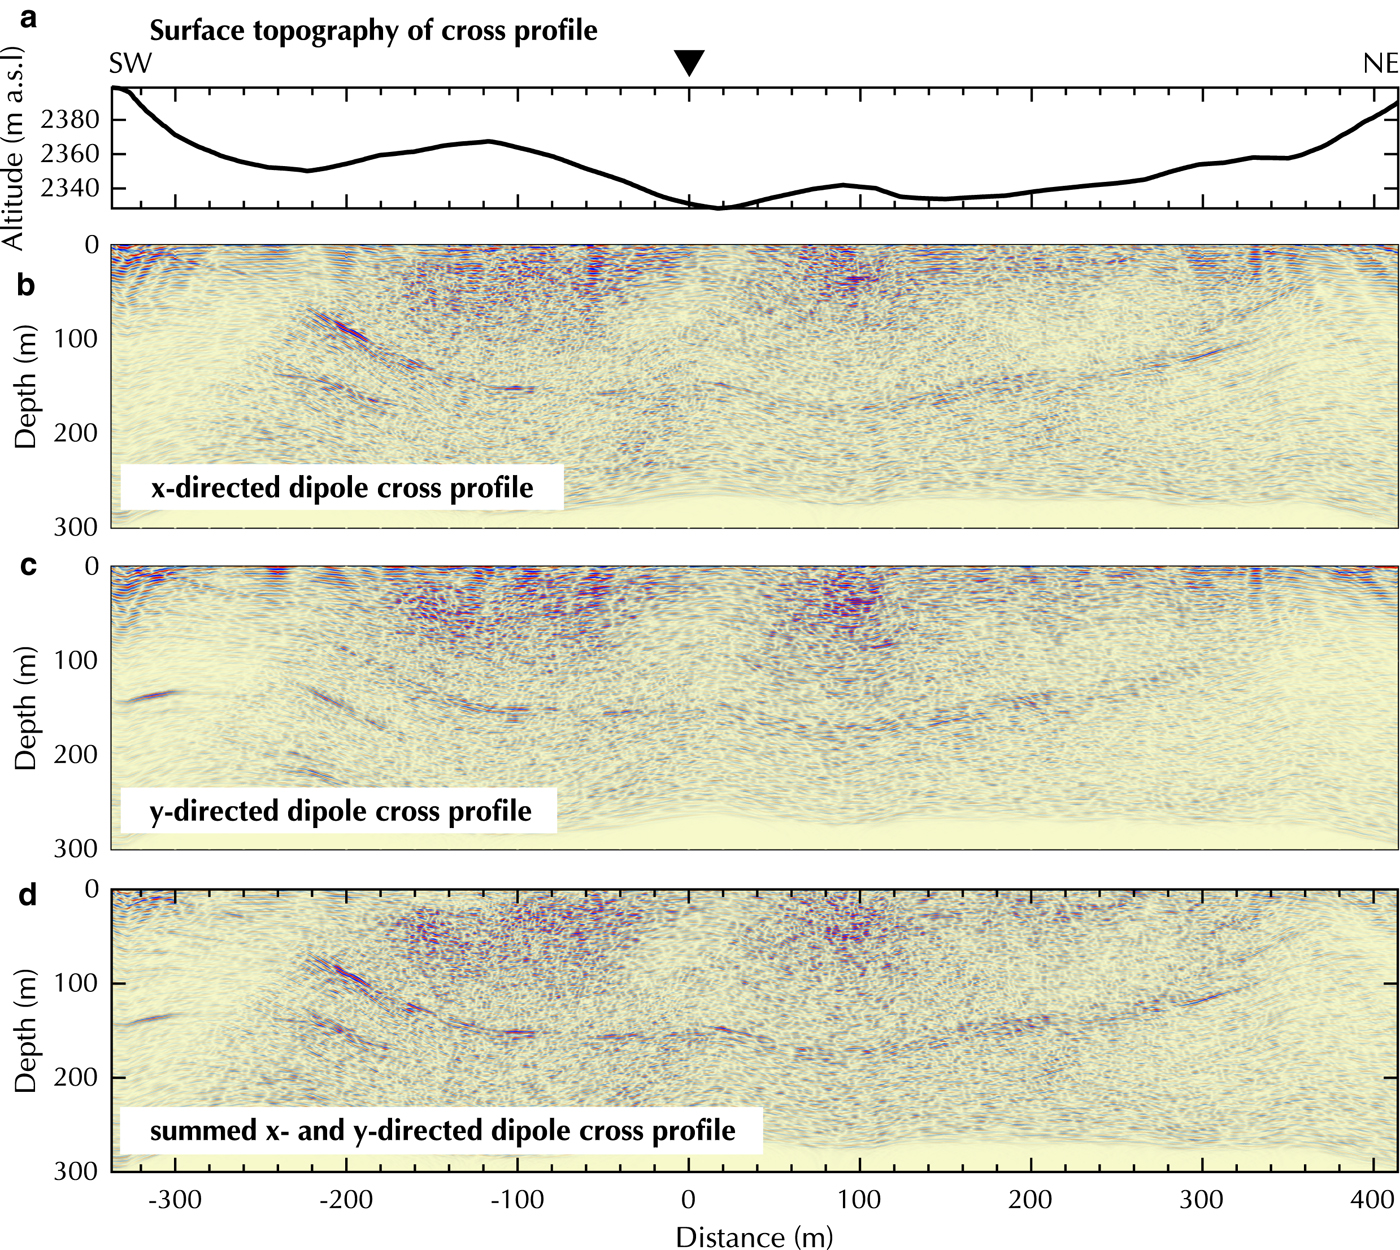
Fig. 10. Processed cross profile on Oberaletsch Glacier with (a) surface topography, (b) x-, (c) y- and (d) summed x- and y- directed dipoles. Y -axis exaggeration of profiles 1:1.8.
The longitudinal profile of the Oberaletsch Glacier shows greater differences in data quality, when both orientations are compared (Fig. 11). Generally, the x-directed dipole data displays a stronger bedrock reflection along the profile. In both, x- and y- directed dipole profiles, several off-plane reflections can be observed at the same location but different depths. They occur preferentially at a distance of ≥ 1500 m at the lower end of the glacier, which is situated in a more narrow glacier valley (Fig. 5b). In the x-directed dipole profile additional off-plane reflections are visible at approximately −400, 100 and 700 m. In those regions, differentiating between off-plane and in-plane bedrock reflections becomes challenging. Less off-plane reflections are present in the y-directed dipole profile (Fig. 11c). The bedrock reflection is amplified in the summed x- and y-directed dipole data and off-plane reflections are reduced in amplitude, specifically in the area from approximately −900 to 1300 m distance (Fig. 11d). However, the high amount of scattering in the shallower section of the tongue (South-East) prohibit the localization of the bedrock reflector. Overall, the helicopter-borne GPR profiles of the Oberaletsch glacier are less coherent and present a higher noise level than the Plaine Morte Glacier data, but we were able to delineate the bedrock topography below 200 m of temperate glacier ice overlain by a heavily debris-covered surface.
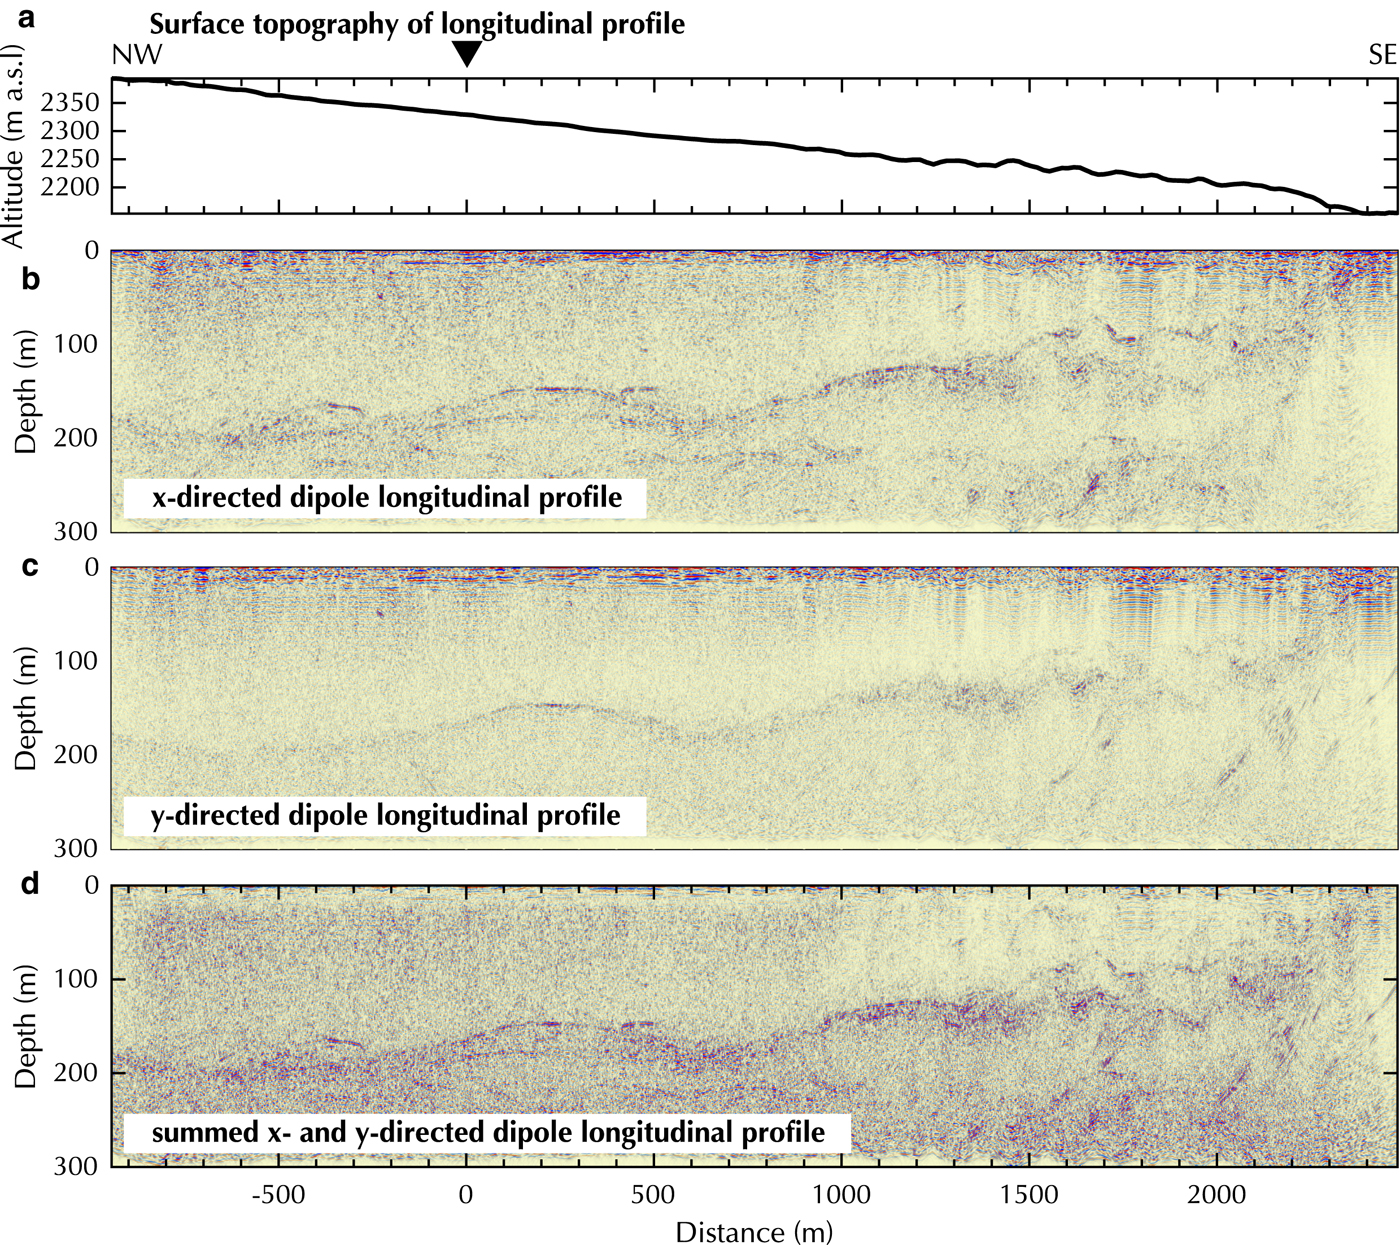
Fig. 11. Processed longitudinal profile on Oberaletsch Glacier with (a) surface topography, (b) x-, (c) y- and (d) summed x- and y- directed dipoles. Y -axis exaggeration of profiles 3:1.
5. DISCUSSION
Results of the Plaine Morte (Figs 8 and 9) and Oberaletsch Glaciers (Figs 10 and 11) demonstrate the amplitude of the bedrock reflection varies significantly in space along the profile and depending on the antenna orientation. We can account for these deviations by utilizing a dual-polarization GPR system, because predicting the optimal orientation for a single antenna pair a priori is cumbersome.
In the regions of undulating topography or a bowl-shaped subsurface, two antenna sets with orthogonal polarization complement each other as seen in the cross profile on Plaine Morte (Fig. 8d) and the deeper section in the longitudinal profile (Fig. 9d). Generally, the reflections observed in the summed data appear to be more coherent, which could be related to a certain redundancy of the two polarizations. Thus, summing the traces increases the coherency of the desired bedrock topography signals and suppresses random noise causing an increase in the signal-to-noise ratio.
Scattering effects, caused by air bubbles, water inclusions and debris cover present a severe problem in temperate glaciers. Nobes (Reference Nobes1999) and Urbini and others (Reference Urbini2017) noted that scattering from such features could cause directionality-dependent variations. In contrast, by comparing the x- and y-directed data for the Oberaletsch cross profile (Fig. 10), it can be observed that a high amount of scattering rather reduces the amplitude differences of both polarizations and the deviations are enhanced in profiles with less englacial scattering (e.g. Fig. 11 at 1200 m distance). If background noise or scatter, also caused by crevasses (Bradford and others, Reference Bradford, Nichols, Harper and Meierbachtol2013), anthropogenic electromagnetic systems or military communications, is present in the single polarization dataset, it is likely to be added in the summed x- and y-directed profile as well (e.g. Fig. 8, −1500 to 500 m distance). In the case of the Oberaletsch Glacier, the scattering can be associated with the heavily debris-covered surface and the presence of meltwater, since we measured the profiles at the beginning of the summer season. Additionally, we observe several off-plane reflections (Fig. 11b, c, Fig. 10b, c at −200 and −320 m), which could be associated with a strong undulating subsurface topography or helicopter's vicinity to the surrounding rock walls.
During the past months, we have acquired several hundreds of kilometers of data with our new system. Based on our experience, we can offer specific recommendations for optimizing the GPR data quality. A critical component is the length of the rope, which is used to attach the system to the helicopter. A short rope likely increases ringing effects, but the strongest signal distortion will appear in early portions of the radargrams. They may not obscure bedrock reflections from intermediate and deeper parts of the glaciers. In contrast, a longer rope will decrease the ringing amplitudes but may lead to a stronger masking of subsurface reflections. An optimal choice is, therefore, survey dependent. Similar arguments apply to an appropriate choice of the flight height above ground. Lower flight heights allow better coupling to the ground but will increase the distortion of the bedrock signal due to ringing. We also experienced that the ringing significantly depends on the type of helicopter. As expected, smaller helicopters generate considerably less ringing and conversations with transponders should be kept to a minimum to avoid interferences.
Another critical operational parameter is the helicopter speed. Since the dual-polarization system acquires the two data channels in an alternating mode, the acquisition time for a single position is approximately doubled compared with a single-polarization system. Additionally, because of the airborne acquisition and the depth of the glaciers, the data are recorded with a long time window of 4000 ns. To avoid spatial aliasing, the stacking rate has to be low and the helicopter speed should be kept to a maximum velocity of <30–40 km h−1, which increases survey costs. Reducing the velocity can be achieved by flying against the wind direction and adapting the flight path trajectory during the survey relative to the surface gradient.
6. CONCLUSION AND OUTLOOK
Based on analytical calculations and numerical modeling, we conclude that the radiation pattern of GPR dipoles at low flight altitude (<40 m above the surface) does not correspond to a full space solution, because the far-field is reached inside the ice body. To overcome these directivity problems of a single pair of GPR antennas, we have developed a novel dual-polarization, helicopter-borne system (AIR-ETH). The benefits of acquiring dual-polarization data and applying the pseudo-scalar approach, in which both channels are summed, were demonstrated with two datasets of temperate Alpine glaciers. We observed that undulating subsurface topography causes varying bedrock amplitudes for both polarizations. Overall, after summing the data the bedrock reflections become more coherent, are visible at greater depth and in steep dipping regions.
The system is built with commercial components and can be reproduced. To maximize depth penetration, we have employed non-shielded 25 MHz antennas (the lowest frequency that can be currently used with our setup), but the system is versatile enough, such that higher frequency antennas could be operated for investigating shallow structures. Ringing effects from the helicopter can be a significant noise source. However, a proper shielding of the relatively large GPR antennas would require a sizeable shielding cover and would add extra weight. More research is required to investigate if such an option for the AIR-ETH system is feasible. A potential extension of our dual-polarization concept could include true multi-component recording. Not only data recorded in broadside configuration, but additional orthogonal transmitter-receiver combinations could be considered. If desired, non-commercial two-channel real-time acquisition systems and novel commercial high-power transmitters can be added to the existing setup. In principle, extending the system with vertical antennas would be possible and would provide a great range of opportunities. Advanced imaging algorithms could be employed to exploit the vectorial nature of GPR data (Lehmann and others, Reference Lehmann, Boerner, Holliger and Green2000; Streich and others, Reference Streich, van der and Green2007). This could be particularly beneficial for detecting and handling off-plane reflections in helicopter-borne GPR surveys on plateau and valley glaciers.
ACKNOWLEDGMENTS
Financial support was provided by ETH Zurich, the Swiss Geophysical Commission, and the Swiss Competence Center for Energy Research – Supply of Electricity (SCCER-SoE). Data acquisition has been enabled by the group of Exploration and Environmental Geophysics (EEG), the Laboratory of Hydraulics, Hydrology and Glaciology (VAW) of ETH Zurich and GEOSAT SA, Sion. The Oberaletsch Glacier campaign was funded by Alpiq Holding, Lausanne, Switzerland. We like to thank BRTechnik for building the frame, Christoph Bärlocher, Institute of Geophysics at ETH Zurich for technical support and we acknowledge G. Church for the help during the field campaigns. Processing of our data was facilitated by CREWES MATLAB software (Margrave, 2003). We thank S. H. Faria, H. Pritchard, an anonymous reviewer and E. King for constructive comments that improved the manuscript.


 Open access