


1. INTRODUCTION
In recent decades, much attention has been paid to global glacier reduction and its consequences for sea-level rise and the mountain ecosystem (e.g. Immerzeel and others, Reference Immerzeel, van Beek and Bierkens2010; Gardelle and others, Reference Gardelle, Berthier and Arnaud2012a). Glaciers located in the western Kunlun Mountains (WKM), Karakoram, Pamirs and Himalaya represent the largest ice masses outside of the polar regions (Smiraglia and others, Reference Smiraglia2007). They are the headwaters of many prominent rivers such as the Indus, Ganges and Brahmaputra, and play an important role as the water towers of Asia (Yao and others, Reference Yao2012). Glaciers in the WKM, Pamirs and Karakoram have become a focus of public and scientific debate due to their unusual behavior (e.g. Hewitt, Reference Hewitt2005; Gardner and others, Reference Gardner2013; Kääb and others, Reference Kääb, Treichler, Nuth and Berthier2015). In contrast to worldwide glacier reduction, their overall areas present no significant changes, with some glaciers advancing or surging in recent decades (e.g. Copland and others, Reference Copland2011; Bhambri and others, Reference Bhambri2013). Additionally, their mass is stable or even growing in the early 21st century (e.g. Bolch and others, Reference Bolch2012; Ke and others, Reference Ke, Ding and Song2015; Zhang and others, Reference Zhang2016).
In contrast, glaciers in the Himalaya are reported to be losing mass rapidly during the same period (e.g. Bolch and others, Reference Bolch, Pieczonka and Benn2011; Kääb and others, Reference Kääb, Treichler, Nuth and Berthier2015; Maurer and others, Reference Maurer, Rupper and Schaefer2016). These contrasting glacier changes may result from regional variations in climatic change (Maussion and others, Reference Maussion2014; Wiltshire, Reference Wiltshire2014). To determine if recent variations in glaciers are representative for longer time periods, glacier mass budgets have been extended to the 1970s over the middle and eastern Himalaya (e.g. Maurer and others, Reference Maurer, Rupper and Schaefer2016; Ragettli and others, Reference Ragettli, Bolch and Pellicciotti2016), eastern Pamirs (Holzer and others, Reference Holzer2015; Zhang and others, Reference Zhang2016) and central Karakoram (Bolch and others, Reference Bolch, Pieczonka, Mukherjee and Shea2017). They reveal that the stability of glaciers over the Karakoram and Pamirs is probably not limited to the past 15 years, but extends back at least to several-decade time span. Very recent research (Zhou and others, Reference Zhou, Li, Li, Zhao and Ding2018) indicates that WKM glaciers have been stable prior to 2000, and are part of a larger regional anomaly that includes the Pamirs and Karakoram (Kääb and others, Reference Kääb, Treichler, Nuth and Berthier2015).
Based on the first and second Chinese Glacier Inventories (CGI) and Landsat images, some attempts have been made to determine changes in glacier extent over the WKM since 1970 (e.g. Shangguan and others, Reference Shangguan2007; Ji and others, Reference Ji, Guo and Zhang2013; Wei and others, Reference Wei2014; Bao and others, Reference Bao, Liu, Wei and Guo2015). Shangguan and others, (Reference Shangguan2007) found a slight area increase from 1991 to 2001, and no significant change during the period 1970–2001. Ji and others (Reference Ji, Guo and Zhang2013) reported slightly positive conditions of six typical glaciers from 1991 to 2009. Bao and others (Reference Bao, Liu, Wei and Guo2015) indicated only −3.4 ± 3.1% reduction in glacier area over WKM for the 1970–2010 period. These results seem to suggest that WKM glaciers have been in balance or changing insignificantly during the last several decades. To further confirm this, there is still a need to examine changes in the glacier mass budget before 2000. Thus, the major objective of this study is to quantify the changes in mass budget over WKM glaciers before 2000 by means of geodetic measurements to fill a knowledge gap, and also to give possible climatic consideration for the glacier changes in the WKM.
2. STUDY AREA
WKM, located on the northwestern Tibetan Plateau (Fig. 1), is one of the most extensively glacierized regions in China (Shi and others, Reference Shi, Liu, Ye, Liu and Wang2008). Morphologically, the WKM contain cirque glaciers, valley glaciers and ice caps, nine of which have an extent of >100 km2. Over the rugged northern slopes, valley glaciers are dominant, while ice caps are mainly distributed over the southern slopes. Among them, Guliya Ice Cap is the largest ice cap in mainland Asia covering an area of >370 km2. These glaciers are situated in an extremely cold and dry continental climate (Zhou and others, Reference Zhou, Li and Guo2014) and are almost debris free (<3% debris-covered area) (Scherler and others, Reference Scherler, Bookhagen and Strecker2011). End-of-summer transient snowlines range from 5900 to 6100 m a.s.l and the average equilibrium line (ELA) elevation is 5930 m a.s.l (Zhang and Jiao, Reference Zhang and Jiao1987). Primarily controlled by mid-latitude westerlies, the climate of WKM is cold and semi-arid, with most precipitation occurring between May and September (Zhang and others, Reference Zhang, An, Yang and Jiao1989). Near the ELA, annual mean air temperature and precipitation reach ~ − 13.9 °C and 300 mm, respectively (Zhang and others, Reference Zhang, An, Yang and Jiao1989). The glaciers provide seasonal to long-term downstream freshwater supply and also act as invaluable indicators of climate changes (e.g. Vaughan and others, Reference Vaughan, Stocker, Qin, Plattner, Tignor, Allen, Boschung, Nauels, Xia, Bex and Midgley2013; An and others, Reference An2016).
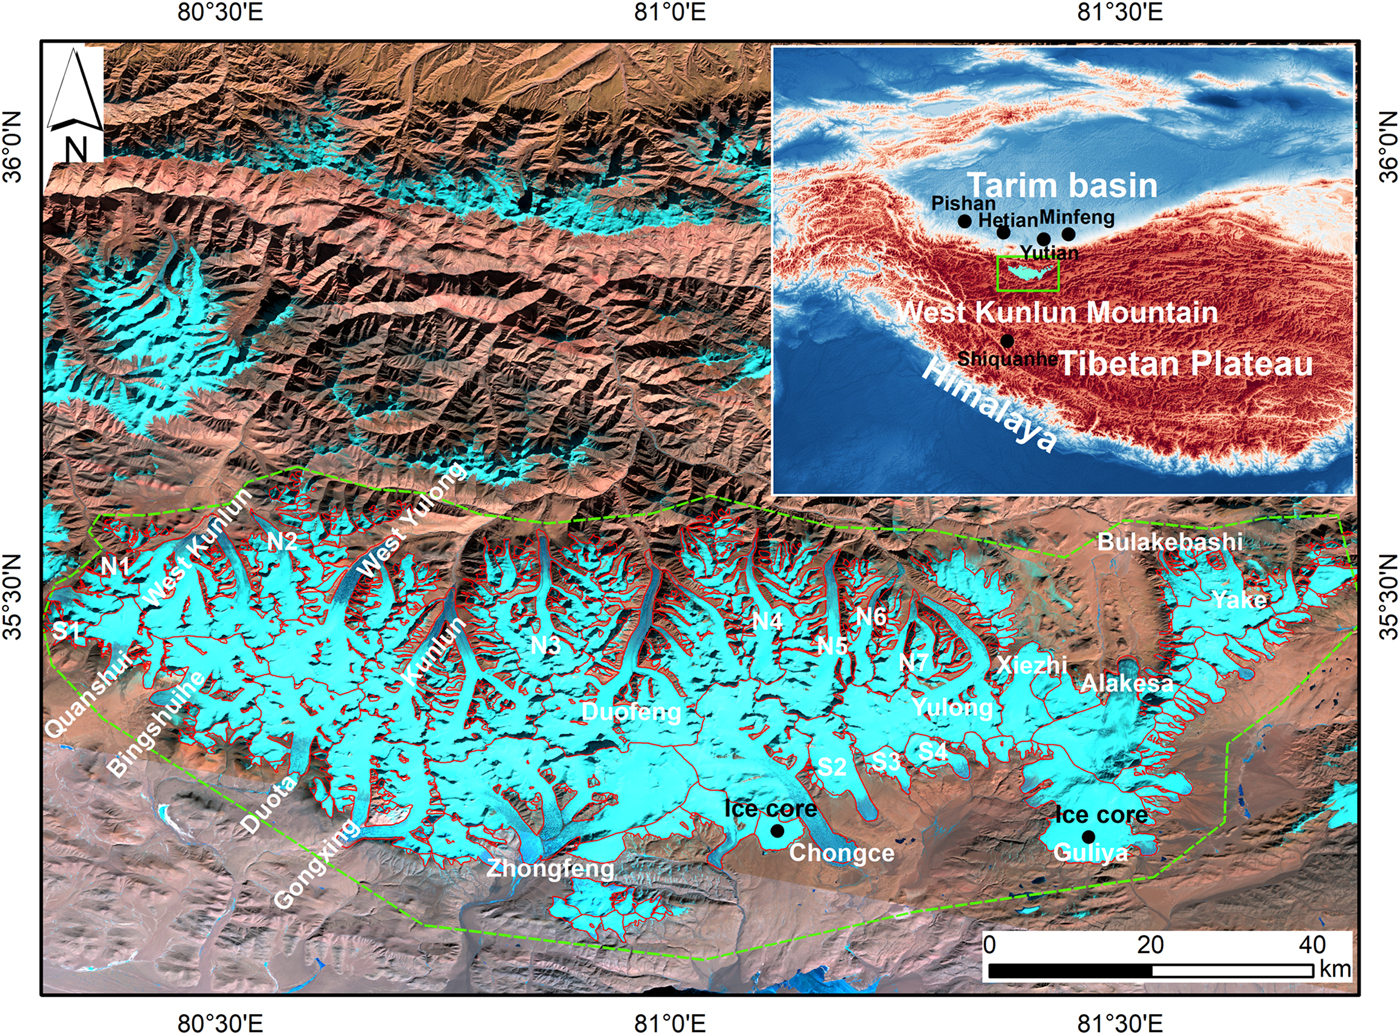
Fig. 1. Western Kunlun Mountains (WKM) on Landsat 8 OLI image false-color composite (band 7, 5, 4 for R, G, B) acquired in September 2016. Inset indicates the locations of meteorological stations, WKM and Tibetan Plateau. Glacier outlines are derived from the topographical maps generated in 1968–71. The names of well-known glaciers are presented, and the unnamed glaciers in the north and south slopes have identifiers prefixed by N or S, respectively.
3. DATA AND METHODS
3.1. Data
3.1.1. DEM70
We collected seven topographic maps at a scale of 1: 1 00 000, which were generated from 1: 60 000 aerial stereo pairs acquired during 1968–71 by the Chinese Military Geodetic Service (CMGS). They are referenced to the Beijing Geodetic Coordinate System 1954 (BJ54) geoid and the Yellow Sea 1956 datum (the averaged sea level at the Qingdao Tidal Observatory in 1956). The contour and points of elevation were digitized from these topographic maps by the State Bureau of Surveying and Mapping of China and reprojected to the Xian Geodetic Coordinate System 1980 (GDZ80) geoid using the Yellow Sea 1985 datum. The digital contour and points were then used to construct a triangulated irregular network (TIN) and the TIN was interpolated to an ~50 m resolution DEM called DEM70.
According to General Administration of Quality Supervision Inspection and Quarantine (2008), the nominal vertical uncertainties of the topographic maps are controlled within 10–16 m over mountain regions (with slopes of 6°–25°) and 16–28 m over steep mountains (with slopes of >25°). The average slope of WKM glaciers is 11.2° (calculated based on Shuttle Radar Topography Mission (SRTM) DEM) and hence we consider the averaged vertical accuracy of these topographic maps may be better than 16 m on the glacierized terrain. It is noted that topographic data are derived from stereo photogrammetry, which often suffers from errors and gaps over the snow accumulation zones because of low radiometric contrast, leading to the larger uncertainty (>16 m) in these regions.
3.1.2. SRTM DEM
The SRTM DEMs are constructed by means of C-band and X-band Spaceborne Imaging Radar operating in interferometric mode aboard the space shuttle Endeavour from 11 to 22 February 2000, and has been widely applied for glacier investigations (e.g. Kääb and others, Reference Kääb, Berthier, Nuth, Gardelle and Arnaud2008; Gardelle and others, Reference Gardelle, Berthier, Arnaud and Kääb2013; Bao and others, Reference Bao, Liu, Wei and Guo2015). SRTM C-band DEM is available over the entire globe between 60°N and 57°S. However, the X-band DEM's coverage is not continuous and fails to cover our whole study region because of its narrow swath widths. Therefore, we use C-band DEM for the estimate of glacier changes. Assuming the radar beam fully penetrating into snow (Paul and Haeberli, Reference Paul and Haeberli2008), the resulting DEM is considered to be representative of the glacier surface at the end of the 1999 ablation period (Gardelle and others, Reference Gardelle, Berthier, Arnaud and Kääb2013). The geodetic reference for SRTM C-band DEM is the World Geodetic System 1984 (WGS84), defined as the 1996 Earth Gravitational Model (EGM96) geoid. The horizontal and vertical datum of X-band SRTM DEM is WGS84 ellipsoid. The original SRTM data contain data gaps, especially at high and steep regions because of heavy shadows and layover effects. The voids on the glacierized surface of WKM account for 0.52% of glacier total areas for the 1970s, and Figure S1 presents their spatial distribution. To render the data more useful, the voids in C-band DEM have been filled by the Consortium for Spatial Information of the Consultative Group for International Agricultural Research (CGIAR-CSI) (Jarvis and others, Reference Jarvis, Reuter, Nelson and Guevara2008). The C-band DEM data for regions outside the USA has a spatial resolution of 3 arc-seconds (~90 m) (SRTM3).
3.1.3. ICESat elevation
The Geoscience Laser Altimeter System (GLAS) onboard ICESat provides surface elevation data in several campaigns, with horizontal and vertical accuracies of 10.6 ± 4.5 and 0.34 m, respectively (Magruder and others, Reference Magruder, Webb, Urban, Silverberg and Schutz2007; available online at http://www.nsidc.org). The laser footprints have 172 m spacing along-track, and ~42 km cross-track spacing between 91 day repeat. Because of the reliability of vertical reference of GLAS elevations for stable ground control points (Kääb, Reference Kääb2008; Nuth and Kääb, Reference Nuth and Kääb2011), the GLAS14 product is used to evaluate the quality of DEM70 and SRTM DEM. ICESat/GLAS elevations are referenced to the TOPEX/Poseidon ellipsoid.
3.1.4. Landsat images
Table 1 summarizes all the cloud-free Landsat MSS, TM/ETM+ and 8 Operational Land Imager (OLI) images used in this study. Landsat MSS images have 57 m horizontal resolution and have one thermal, two near-infrared and two visible bands. The spatial resolution of TM images is 30 m, including one near infrared band two short-infrared bands, one thermal band and three visible bands (i.e. blue, green and red). Different from TM images, the ETM+ images have a 15 m resolution panchromatic band, which is often used to merge with other TM bands to improve the resolution of images. The Landsat 8 satellite launched 11 February 2013 and has two push-broom instruments, i.e. the OLI sensor and the Thermal Infrared Sensor (TIRS), which can be used to enhance the radiometric signal-to-noise and to improve characterization of land cover state and condition. New deep blue visible and shortwave infrared bands are included in the OLI sensor to improve the prior Landsat instruments.
Table 1. List of data for the WKM glacier change assessment
3.2. Methods
3.2.1. Datum transformation
To make the DEM70 and C-band SRTM-DEM (topographical maps and Landsat images) under the same horizontal coordinate system, a seven parameter transformation is used to transform the Xian 80 data into the WGS84 data:
 $$\left[ \matrix{X_{84} \hfill \cr Y_{84} \hfill \cr Z_{84} \hfill} \right] = M \times \left[ \matrix{1 - w_{\rm Z} + w_{\rm Y} \hfill \cr w_{\rm Z} + 1 - w_{\rm X} \hfill \cr - w_{\rm Y} + w_{\rm X} + 1 \hfill} \right] \times \left[ \matrix{X_{80} \hfill \cr Y_{80} \hfill \cr Z_{80} \hfill} \right] + \left[ \matrix{X_0 \hfill \cr Y_0 \hfill \cr Z_0 \hfill} \right]$$
where X 84, Y 84 and Z 84 are the WGS84 datum coordinates, X 80, Y 80 and Z 80 are the Xian 80 datum coordinates, X 0, Y 0 and Z 0 are the translation parameters, w X, w Y and w Z are the rotation parameters, and M is the scale factor. Three known national trigonometric points are used to evaluate these parameters for each map. The uncertainty of this seven-parameter transformation is estimated to be <0.5 m (Gao and others, Reference Gao and Zang2009).
An IDL program acquired from NSIDC (https://nsidc.org/data/icesat/geoid.html) is used to convert the TOPEX/Poseidon ellipsoid of GLA14 data to the WGS 84 ellipsoid, and further to EGM96 geoid based on the model from the National Geospatial-Intelligence Agency (NGA)/NASA (http://earth-info.nga.mil/GandG/wgs84/gravitymod/egm96/egm96.html). We also use this NGA/NASA model to transform the vertical reference datum of SRTM X-band DEM to the EGM96 geoid.
3.2.2. DEM co-registration
Subtracting the DEM70 from the SRTM-DEM, difference maps are constructed to compare elevation deviations on a cell-by-cell basis. We first calculate the difference of DEM70 relative to SRTM-DEM by excluding nonstable terrain such as glaciers, lakes and ice-cored moraines. The elevation difference is strongly affected by topographical slope and aspect (Fig. 2; Nuth and Kääb, Reference Nuth and Kääb2011). To minimize the horizontal displacements on stable terrain, DEM70 is co-registered to SRTM-DEM using the following equation described by Nuth and Kääb (Reference Nuth and Kääb2011).
 $$\displaystyle{{dh} \over {\tan \alpha}} = a\,\cos (b - \varphi ) + c$$
where α and φ denote the topographic slope and aspect, respectively, and a, b and c represent the shift vector magnitude and direction and the averaged difference of the two DEMs. Before co-registration, the pixels with a slope angle of <5° are discarded. A least-squares optimization is used to calculate the parameters a, b and c. This process is iterated to reach an ultimate solution when the length of the solved shift vector is <1 m. The resulting horizontal shifts are 19.3 m in X-direction and −23.0 m in Y-direction (Table 2). The vertical bias (Z-offset) is 6.9 m. The vertical RMSE of elevation difference for off-glacier terrain after the correction decreases ~20% compared with that before the correction. Based on this co-registration method, we also co-register DEM70 and SRTM DEM to ICESat data to estimate their vertical accuracy.
Fig. 2. Scatter plot of slope standardized elevation differences between DEM70 and SRTM DEM vs. aspect (a) before co-registration and (b) after co-registration.
Table 2. Shift vectors in X, Y and Z directions and the uncertainty in DEM before and after co-registration
SD, standard deviation; RMSE, root mean square error.
3.2.3. DEMs accuracy
We use ICESat data to assess DEM70 and SRTM elevation data prior to the quantification of glacier elevation changes. The surface elevation accuracy of DEM70 is tested by a comparison with the GLA14 over ice-free stable areas. In total 2301 GLAS footprints during 2003–09 are available over the barren areas of the WKM. ICESat elevation differences >100 m relative to DEM70 and SRTM DEMs are regarded as outliers resulting from the cloud reflections, saturated waveforms, or inaccurate regions of the DEM70 or SRTM data and thus are excluded from the evaluation. ICESat footprints with a slope angle of >15° are also omitted to ensure that the vertical uncertainty of GLA14 data are <1 m (Beaulieu and Clavet, Reference Beaulieu and Clavet2009; Pieczonka and others, Reference Pieczonka, Bolch, Wei and Liu2013). After the outlier exclusion, 1810 ICESat data are left for the assessment of DEM70 and SRTM DEM accuracy. The resulting surface elevation difference between DEM70 and GLAS ICESat data has the averaged value and RMSE of 0.3 and 10.9 m. The averaged value and RMSE of the difference between available GLAS data and SRTM in the WKM are −0.1 and 9.8 m, respectively. Due to the limited available number of ICESat GLAS data, further corrections are performed using the difference between SRTM DEM and DEM70 rather than individual DEM adjustment based on ICESat data.
3.2.4. Correction of terrain curvature and SRTM radar penetration
As pointed out by previous studies (Berthier and others, Reference Berthier, Arnaud, Vincent and Rémy2006; Paul, Reference Paul2008; Gardelle and others, Reference Gardelle, Berthier and Arnaud2012b), elevation-dependent vertical bias in mountainous regions is attributable to differences in the original spatial resolution of the two DEMs. The coarse DEM is prone to underestimate the heights of the sharp peaks or ridges with high terrain curvature due to its limited capacity of the representation of high-frequent changes in slopes. This bias can be corrected by the relationship between elevation difference and maximum curvature over the stable terrain off glaciers (Gardelle and others, Reference Gardelle, Berthier and Arnaud2012b, Reference Gardelle, Berthier, Arnaud and Kääb2013). A clear polynomial relationship is found between the two variables and thus in this study, a cubic-polynomial fitting is utilized to make the correction (Fig. 3a).
Fig. 3. (a) Relationship between elevation difference and maximum curvature; (b) Relationship between SRTM C band snow penetration depth and elevation.
For glacier covered by snow and firn, SRTM data map a surface which is below the real glacier surface because of penetration of the C-band radar signal. This penetration depth varies from 0 to 10 m (e.g. Barundun and others, Reference Barundun2015; Fischer and others, Reference Fischer, Huss and Hoelzle2015; Kääb and others, Reference Kääb, Treichler, Nuth and Berthier2015). A geodetic mass balance without any correction for this penetration will likely be severely biased in the dry cold climate of the WKM. Here, we estimate this penetration by differencing the SRTM C-band (5.7 GHz) and X-band (9.7 GHz) DEMs, as done by Gardelle and others (Reference Gardelle, Berthier and Arnaud2012b, Reference Gardelle, Berthier, Arnaud and Kääb2013), due to the lower penetration of the X-band than C-band. Based on this method, the SRTM C-band DEM elevations are compared with the simultaneously acquired X-band SRTM DEM covering ~70% of the icefield. The resulting averaged SRTMC−band penetration over WKM glaciers is estimated to be ~2.8 m. We determine the relationship between the penetration depth in each 50 m elevation bin and the corresponding glacier altitude (Fig. 3b). Following Gardelle and others (Reference Gardelle, Berthier, Arnaud and Kääb2013), the correction is performed using the elevation difference (SRTMX−band−SRTMC−band) as a function of altitude (a six-order polynomial fitting, Fig. 3b) at each glacierized pixel.
3.2.5. Glacier extent delineation and geodetic mean elevation change calculation
Before glacier outline delineation, all Landsat images are co-registered to the topographical maps using 30–45 easily identified ground control points (GCPs) and the accuracy of co-registration is ~20 m (slightly more than half of one pixel of Landsat images). Glacier outlines from the topographical maps are manually digitized and then corrected by Landsat MSS images taken in 1977. The resulting glacier boundaries are then manually adjusted to reflect the glacier outlines in 1999 and 2016 by means of the visual interpretation of co-registered Landsat TM/ETM+ and 8 OLI images.
Prior to elevation change calculations, we exclude data that meet the following conditions:
• Void-filled regions of the SRTM DEM
• Slopes >30° (Pieczonka and others, Reference Pieczonka, Bolch and Buchroithner2011)
• Absolute elevation changes >100 m
• For nonsurging glaciers, we exclude (1) elevation changes > or <3 standard deviations of the mean in each 100 m elevation band and (2) elevation changes that are >68.3 and <31.7 quantiles of elevation change in the accumulation area (Holzer and others, Reference Holzer2015)
• For surging glaciers, we use the filtering method of Pieczonka and Bolch (Reference Pieczonka and Bolch2015) which applies a sigmoid function that allows for a larger range of elevation change in ablation areas and a narrower range at the glacier head.
Missing data below the ELA are replaced by kriging and data gaps in the accumulation area are filled using the average elevation change of the appropriate 100 m elevation band.
Fluctuations in glacier length and elevation changes in surge-type glaciers are controlled by internal instabilities and are typically independent of climate change, whereas for nonsurge-type glaciers these are more closely related to climate changes. To better examine the cause of WKM glacier changes, we calculate area changes and geodetic mass balances separately for surge-type glaciers, nonsurge-type glaciers and all glaciers (cf. Citterio and others, Reference Citterio, Paul, Ahlstrøm, Jepsen and Weidick2009). The averaged elevation change for the WKM glaciers is assessed as an area-weighted averaged elevation difference per 100 m altitude bin. We transform elevation change to mass balance by using a constant density of 850 ± 60 kg m−3 (Huss, Reference Huss2013).
3.2.6. Uncertainty assessment
The uncertainties of the glacier areas and area changes are estimated using a buffering method as described by Minora and others (Reference Minora2016). This method considers both the uncertainty from the data sources (satellite images, topographic maps and aerial photos) and the clarity of glacier limits (Vögtle and Schilling, Reference Vögtle, Schilling, Bähr and Vögtle1999; Citterio and others, Reference Citterio2007). The error for the whole glacier coverage is computed by taking the root of the squared sum of the buffer perimeter of each glacier. Additionally, we take into account the error of co-registration from the different images. The final estimate formula is:
 $$E_{{\rm area}} = \sqrt {\sum\nolimits_{i = 1}^n {(\,p_i \cdot \sqrt {LRE_{{\rm yr}}^2 + E_{{\rm co}}^2}}}{)} $$
where E area is the areal error, and p i and n are the i th glacier perimeter and the number of glaciers, respectively. LRE yr is the Linear Resolution Error affecting topographical map and Landsat images from the different years. E co represents the error of co-registration (20 m). Following O'Gorman (Reference O'Gorman1996), LRE yr is half a pixel for the outline delineation and thus in this study, it is 15 m for the Landsat TM images, 7.5 m for Landsat 8/OLI images and 25 m for the 1: 1 00 000 topographical maps. It is noted that this error may be too low for debris-covered pixels because glacier extents are more difficult to distinguish when ice is covered by debris (Paul and others, Reference Paul and Andreassen2009). Therefore, errors on the debris pixels are regarded as three times those of clean ice. Finally, the total error in area change is calculated as the following format.
 $$\Delta E_{{\rm area}} = \sqrt {E_{{\rm A}1}^2 + E_{{\rm A}2}^2} $$
where ΔE area represents an error in changes in glacier area, and E A1 and E A2 are the uncertainties of the outlines of glaciers at different periods.
Following Gardelle and others (Reference Gardelle, Berthier, Arnaud and Kääb2013), the uncertainty of the glacier elevation change is calculated after the exclusion of nonstable terrain using the two DEMs.
 $$U_{\Delta \,{\rm h}} = \displaystyle{{U_{\Delta \,{\rm hi}}} \over {N_{{\rm eff}}}}$$
where U Δhi represents the Std dev. of the averaged elevation change in each altitude band for off-glacier terrain and N eff is the effective number of measurements:
 $$N_{{\rm eff}} = \displaystyle{{P \times N_{{\rm tot}}} \over {2d}}$$
where N tot is the total number of measurements, P is the pixel size (30 m) and d is the distance of spatial autocorrelation (810 m), which is calculated by Moran's I autocorrelation index.
Furthermore, the uncertainties in the penetration correction, ice density and mapped glacier extents are also considered. Penetration correction error (U p) is assumed to be ± 1 m, which is the maximum difference of two penetration estimate methods from Gardelle and others (Reference Gardelle, Berthier, Arnaud and Kääb2013) and Kääb and others (Reference Kääb, Treichler, Nuth and Berthier2015), respectively. Following Huss (Reference Huss2013), glacier ice density uncertainty (U d) is ± 60 kg m−3, i.e. ± 7% of the elevation change. The uncertainty of the glacier area (U a) is <4%, based on the area error estimate method as describe above, and thus 4% is applied for the elevation change error calculation. The final uncertainty (U) is calculated based on the sum of these individual uncertainties:
 $$U = \sqrt{ U_{\Delta {\rm h}}^2 + U_{\rm a}^2 + U_{\rm p}^2 + U_{\rm d}^2} $$
4. RESULTS
4.1. Area change
There are 389 glaciers with elevation change calculation in the WKM region, covering an area of 3079 ± 105 km2 in 1968–71. These glaciers have shrunk to 2968 ± 103 km2 in 2016. Hence, the glacier area shrinkage rate is 3.6 ± 4.8% or 0.07 ± 0.1% a−1 (Table 3), which is not significant. Area changes over the past 40 years are characterized by spatial and temporal heterogeneity. As shown in Figure 4, Xikunlun Glacier experiences terminus retreat for the 1977–90 and 1990–2011 periods, and advance during 2011–16, while Chongce Glacier retreats between 1977 and 1990 and advances from 1990 to 2011, then remains stable until 2016. Overall, some glacier tongues advance, while most are stable or retreating from 1968–71 to 2016. Non-surging glaciers exhibit low or insignificant area changes, with a mean area loss of 100 km2 (−0.14 ± 0.12% a−1) between 1968–71 and 2016. In comparison, surge-type glaciers show a mean area loss of 11 km2 (−0.02 ± 0.09% a−1) over the same period.
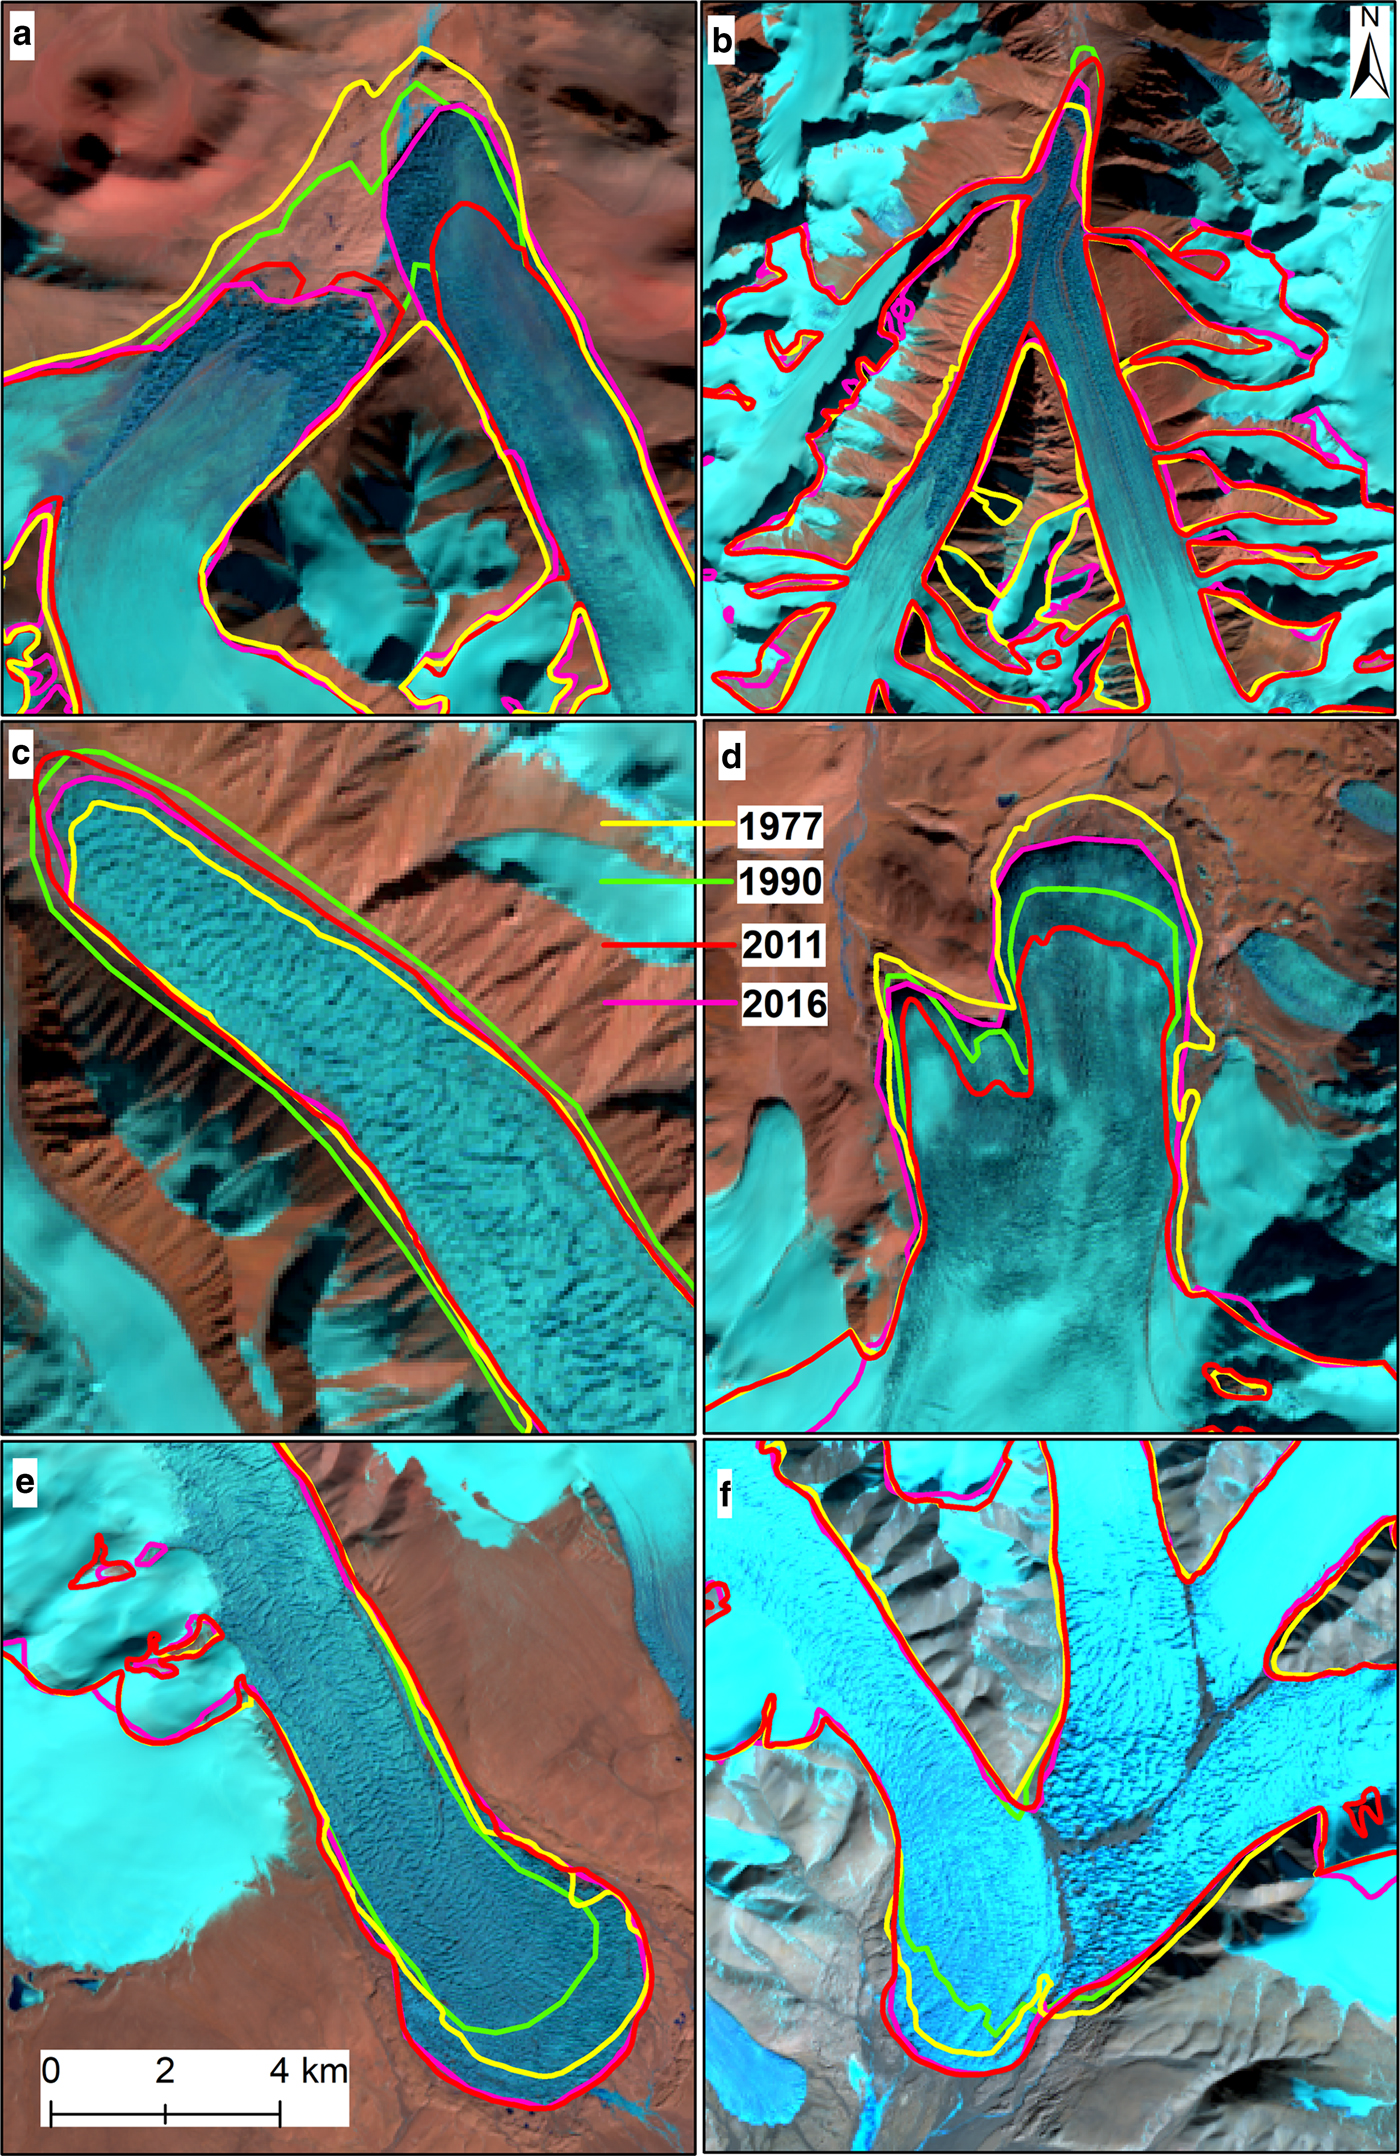
Fig. 4. Terminus positions at different time spans for (a) West Kunlun Glacier, (b) Kunlun Glacier, (c) Yulong Glacier, (d) Alakeasyi Glacier, (e) Chongce Glacier and (f) Zhongfeng Glacier.
Table 3. Area changes for glaciers in the WKM
4.2. Mass change
Between 1968–71 and 1999, we observe a heterogeneous pattern of surface elevation changes in the WKM. We thus divide the WKM into western, central and eastern parts (Fig. 5), and calculate mass changes (Fig. 5) and altitudinal distribution of thickness changes (Fig. 6) of nonsurging and surging glaciers separately for each region. A mass gain (0.13 ± 0.15 m w.e. a−1) is observed in the western WKM nonsurging glaciers, whereas central WKM nonsurging glaciers experience a mass loss of −0.08 ± 0.15 m w.e. a−1. Non-surging glacier mass loss over the eastern WKM is greatest (−0.16 ± 0.15 m w.e. a−1). In contrast to mass gain of nonsurging glaciers over the western WKM, surging glaciers exhibit an insignificant mass loss. Over the central and eastern WKM, there is no distinct difference of mass change between surging and nonsurging glaciers.
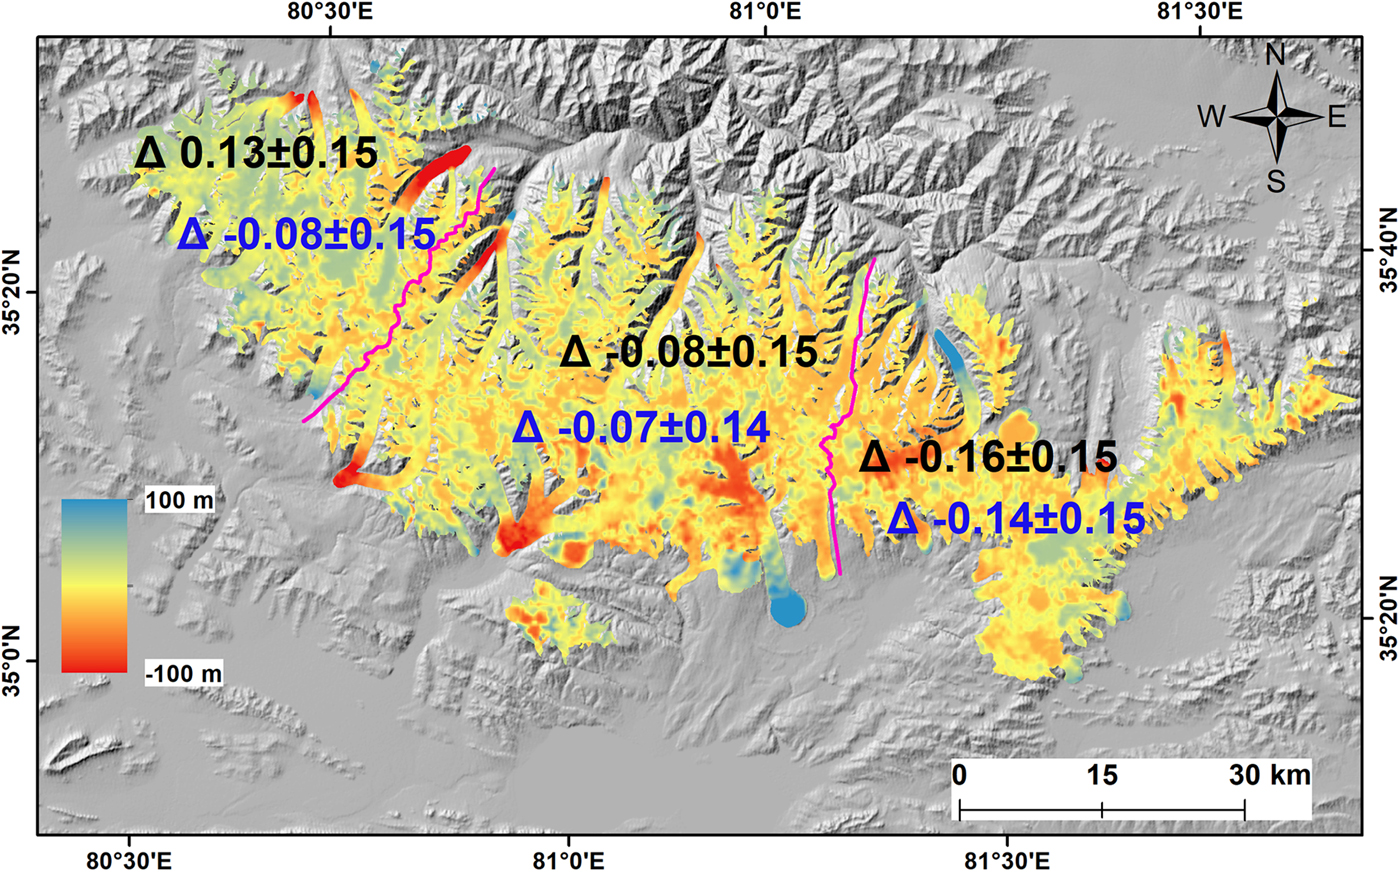
Fig. 5. Surface elevation changes of WKM glaciers between the 1970s and 1999. Glaciers are divided into western, central and eastern parts by purple lines. Their annual mean mass balances are indicated in units of m w.e. a−1 (blue: surging glaciers, and black: nonsurging glaciers).
Fig. 6. Altitudinal distribution of thickness changes of nonsurging (a, c and e) and surging (b, d and f) glaciers over the western, central and eastern WKM. Error bars present Std dev. of glacier height changes in each elevation bin.
In the elevation bins above 5600 m, nonsurging glaciers over the western WKM show rather constant thickening rates (Fig. 6a), whereas small thinning rates are observed for nonsurging glaciers over the central and eastern WKM (Figs. 6c, e). Although the surging glaciers over the western and eastern WKM exhibit significant thickening rates in each elevation bin below 5600 m (Figs 6b, f), several thinning rates are found in the surging glaciers in the central WKM at elevation bins below 5300 m (Fig. 6d)
Surface elevation changes vary significantly both within and between glaciers. The western branch of Kunlun Glacier, for example, has high thinning rates at middle elevations and elevation increases larger than 40 m at its terminus (Fig. 7a). More typical patterns of thinning at the terminus and slight elevation gains in the accumulation area are observed over Gongxing and West Kunlun Glaciers (Fig. 7b). A switch between quiescent and surging phases of the Zhongfeng Glacier is demonstrated by thinning at the terminus and thickening in its middle elevations in 1980–99 (Fig. 7d), followed by thinning in the middle elevations and bulging at the glacier terminus after 2003 (Yasuda and Furuya, Reference Yasuda and Furuya2013; Ke and others, Reference Ke, Ding and Song2015).
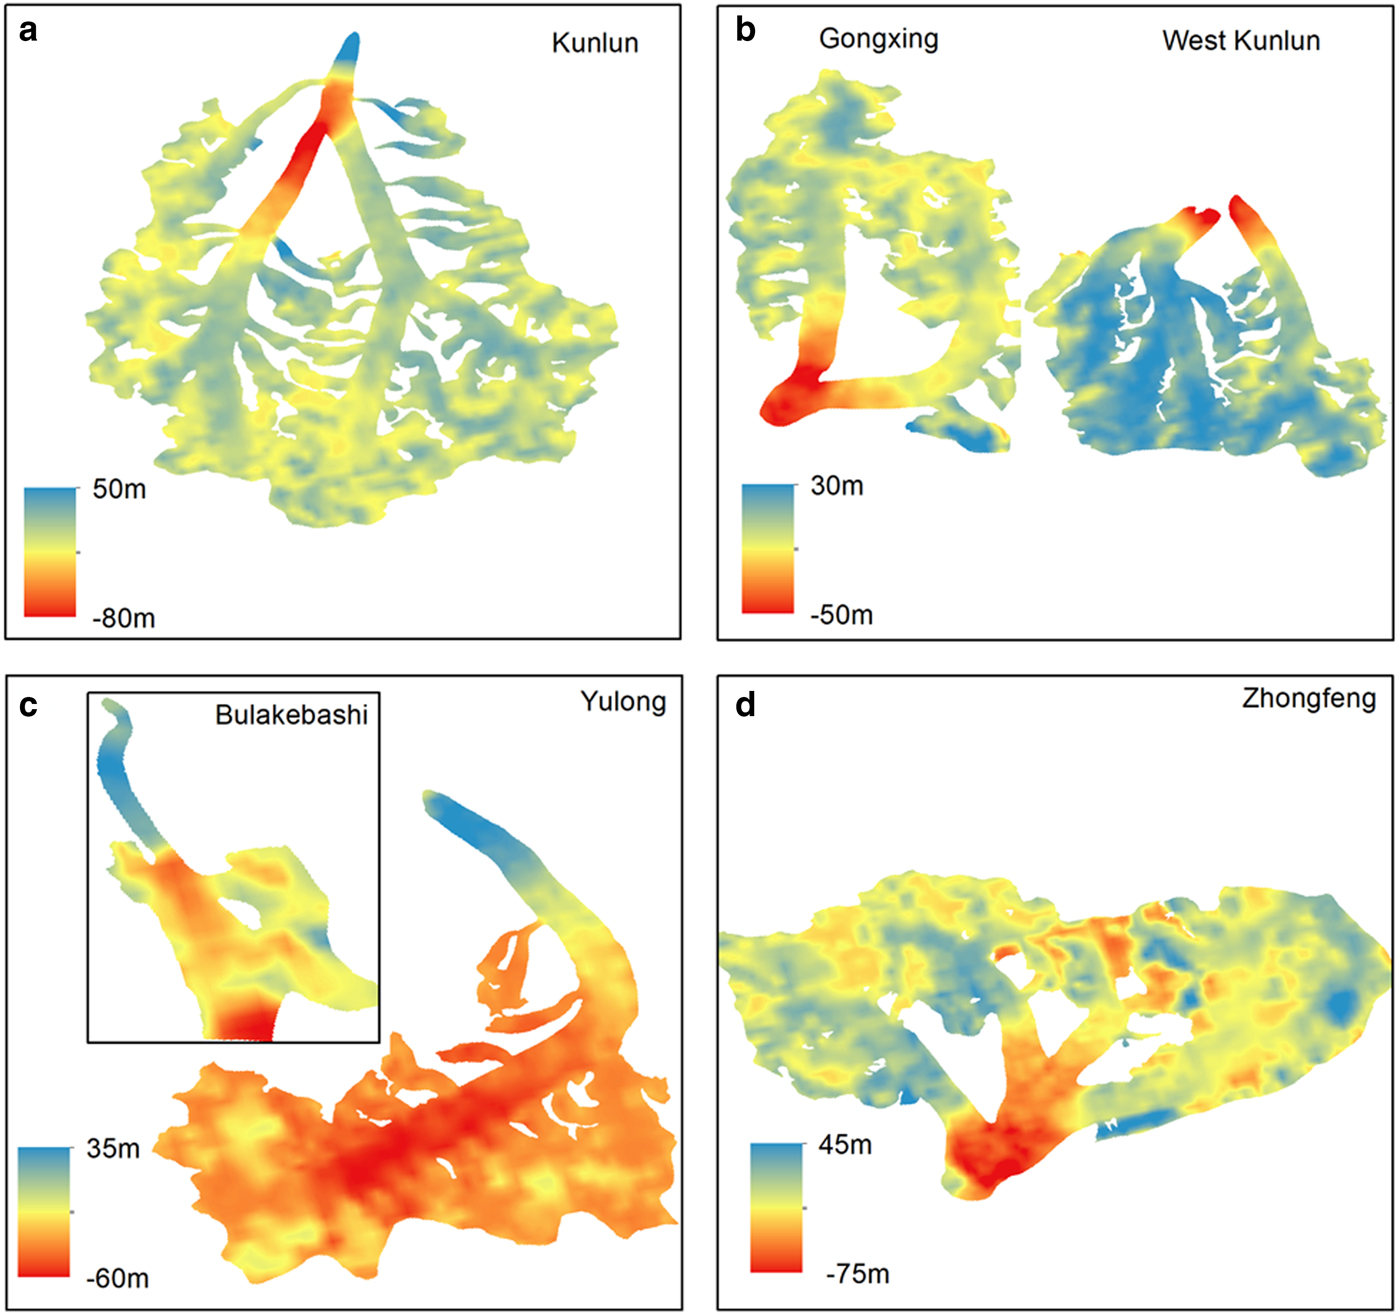
Fig. 7. Surface elevation changes for (a) Kunlun Glacier, (b) Gongxing Glacier and West Kunlun Glacier, (c) Yulong Glacier and Bulakebashi Glacier, and (d) Zhongfeng Glacier.
Strong thickening in the downstream part and significant thinning over the upstream part are observed on a few glaciers, for example Bulakebashi Glacier (Fig. 6c), Yulong Glacier (Fig. 6c), Chongce Glacier, Kunlun Glacier and N6 Glacier, which are characteristic of surging glaciers.
5. DISCUSSION
5.1. Glacier area and surface elevation change
Glacier outlines of the CGI from GLIMS, which are published in 2002 and are based on topographical maps obtained from aerial photographs from the 1950s to the 1980s (Shi and others, Reference Shi, Liu and Kang2010), have potential application for the investigation of glacier changes. However, the quality of the CGI is reported to be poor based on comparison with Landsat 8 OLI images over WKM (Ke and others, Reference Ke, Ding and Song2015). Therefore, we do not use the inventory data, but manually digitize the boundaries of glaciers on the topographical maps. Because of the possible uncertainty in the boundaries of glaciers presented on the topographic maps (Bolch and others, Reference Bolch2010), we further correct the outlines based on Landsat MSS images. Combined with Landsat 8 OLI images in 2016, the determined area change reduction of both surging and nonsurging glaciers is −3.6 ± 4.8% (−0.07 ± 0.1% a−1) in the last 40 years, which is comparatively small and within the calculation uncertainty. The slight area reduction rate agrees well with the previously published results from Ji and others (Reference Ji, Guo and Zhang2013), Wei and others (Reference Wei2014) and Bao and others (Reference Bao, Liu, Wei and Guo2015). However, our calculated shrinkage rate (−0.07 ± 0.1% a−1) is higher than the area decrease rate (~ −0.02% a−1) from 1970 to 2000 determined by Shangguan and others (Reference Shangguan2007). The different glacier area shrinkage rate may result from the different investigation period, the uncertainty in glacier extent from the Chinese topographic maps (Bolch and Schneider Reference Bolch2010) and the difficulty in the glacier interpretation based on the coarser resolution Landsat imagery. Furthermore, a detailed assessment of glacier extent uncertainty is absent in Shangguan and others (Reference Shangguan2007). Compared with multi-decadal glacier shrinkage rates of −0.57 to −0.40% a−1 found for High Mountain Asia (Cogley, Reference Cogley2016), the WKM glacier area shrinkage rate is an order of magnitude lower (Table 3).
In recent decades, WKM glacier mass-balance evaluations have been performed based on the available gravimetric (GRACE) and ICESat observations (Bao and others, 2015; Gardner and others, Reference Gardner2013; Kääb and others, Reference Kääb, Treichler, Nuth and Berthier2015; Ke and others, Reference Ke, Ding and Song2015). Gardner and others (Reference Gardner2013) have found an average thickening of 0.17 ± 0.15 m a−1 from 2003 to 2009 by analyzing ICESat footprints and GRACE observations for WKM. Slightly lower rate of increase in surface elevation (0.05 ± 0.07 m a−1) has been estimated by Kääb and others (Reference Kääb, Treichler, Nuth and Berthier2015) using ICESat measurements in relation to SRTM-DEM. Ke and others (Reference Ke, Ding and Song2015) and Bao and others (Reference Bao, Liu, Wei and Guo2015) also used ICESat laser altimetry to determine the WKM glacier elevation change between 2003 and 2008, and the determined elevation increase rate is >0.20 m a−1. The relatively high thickening rate probably results from their uncorrected SRTM C band penetration. Based on the difference of DEM70 relative to SRTM-DEM, averaged elevation change is −0.06 ± 0.19 m w.e. a−1 for the glaciers on the WKM region from 1970s to 1999. In addition, Lin and others (Reference Lin, Li, Cuo, Hooper and Ye2017) reported a mass gain of 0.128 ± 0.055 m w.e. a−1 for WKM glaciers from 2000 to 2014, based on the difference between SRTM DEM and TerraSAR-X DEM. Therefore, WKM glacier mass is probably balanced or changing only slightly since the 1970s. At Muztagh Ata and Kongur Tagh (eastern Pamir), geodetic measurements show glacier masses are balanced or nearly balanced since the 1970s (Holzer and others, Reference Holzer2015; Zhang and others, Reference Zhang2016). At Hunza catchment of Karakoram, the averaged glacier mass budgets are slightly but insignificantly negative between 1973 and 1999 and positive after 1999 (Bolch and others, Reference Bolch, Pieczonka, Mukherjee and Shea2017). These results show that the Pamir-Karakoram-WKM anomaly may be at least put back to the 1970s and are consistent with recent publications (Forsythe and others, Reference Forsythe, Fowler, Li, Blenkinsop and Pritchard2017; Zhou and others, Reference Zhou, Li, Li, Zhao and Ding2018).
5.2. Glacier surging
The spatial pattern of elevation changes reveals that surge-type glaciers are widely distributed in the WKM. They can be easily identified by the marked thinning over the accumulation area and thickening on the ablation area. It is clearly seen that surge events have happened over Chongce Glacier, Yulong Glacier, N6 Glacier, Kunlun Glacier and Bulakebashi Glacier from the 1970s to 1999. This agrees with velocity, terminus position and morphology changes determined from SAR images during 1972–2014 (Yasuda and Furuya, Reference Yasuda and Furuya2015). In addition, N4 Glacier, N5 Glacier and the eastern branches of Duofeng Glacier and Duota Glacier present surge-type elevation change character. They are regarded by Yasuda and Furuya (Reference Yasuda and Furuya2015) as possible surge-type glaciers because no active surge was observed. The similar mass changes of surge-type and nonsurge-type glaciers suggest that the glacier internal instabilities seem not to have a significant impact on the glacier mass balance over WKM. Similar mass budgets for surging and nonsurging glaciers have been also reported in the Pamirs and Karakoram (Gardelle and others, Reference Gardelle, Berthier, Arnaud and Kääb2013).
5.3. Climate consideration
Glacier changes are related to a larger-scale meteorological or climatic feature. Here, we collect the monthly air temperature and precipitation observations from five meteorological stations (Pishan, Hetain, Yutain, Minfeng and Shiquanhe, Fig. 1 and Table S1) near to the WKM glaciers. The data are derived from the National Meteorological Information Center, China Meteorological Administration. Based on the averaged records from the five meteorological stations, it is found that from 1970 to 1999, annual and summer mean air temperature shows the significant upward trends of 0.24 ± 0.10 °C decade−1 (p < 0.01) and 0.20 ± 0.12 °C decade−1 (p < 0.01), respectively. However, the upward trends are not significant for the 2000–12 period (Fig. 8a). In October 2012, three ice cores with the length of 133.83 m, 135.81 m and 58.82 m were recovered from Chongce ice cap (35°14′N, 81°07′E, 6010 m a.s.l., see Fig. 1) (An and others, Reference An2016). Stable oxygen isotope ratios are positively correlated with annual mean air temperature recorded at Shiquanhe and the ice core temperature trend calculated between 1970 and 1999 (0.74 ± 0.12 °C decade−1) is greater than that observed from station data. In consideration of the scarceness of the meteorological stations around WKM glaciers, the nine high-resolution reanalyses (Table S2) for this region (33–39°N, 71–82°E) are compared with the available observations to further determine the air temperature variability. The results also show that significant warming occurs between 1970 and 1999, but variability in the air temperature is not significant since 2000 (Fig. 9). Meteorological station measurements reveal an insignificant increase in the annual and winter (November–April) precipitation for the 1970–99 and 2000–12 time spans (Fig. 8b). Based on the gridded precipitation fields from Global Precipitation Climatology Project (GPCP) Combined Precipitation Data Set, WKM and surrounding (33–39°N, 71–82°E) experience a significantly increasing annual precipitation trend (>2 mm a−1) since 1979 (Fig. 10), which may result from the strengthening westerlies (e.g. Yao and others, Reference Yao2012). The background of climate change in recent decades suggests that the increased snow accumulation and summer melt both contribute to WKM glacier changes. Thus, the determination of glacier sensitivity to climate change is essential to understand the slight glacier reduction in the WKM.
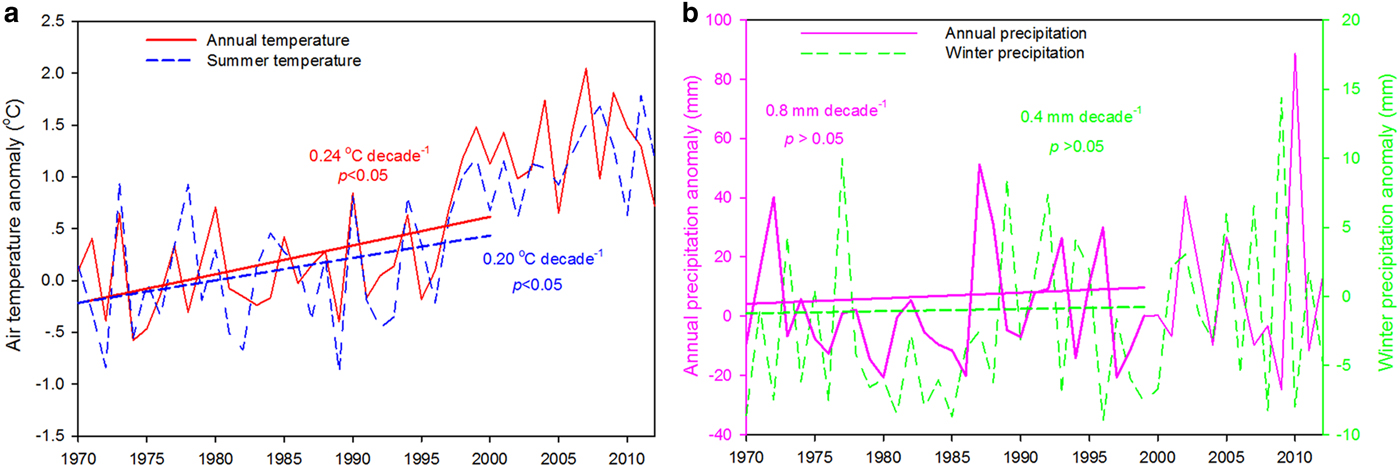
Fig. 8. Temporal variations of (a) averaged annual and summer (June, July, August and September) air temperature and (b) annual and winter (November, December, January and February) precipitation of the five meteorological stations nearest to the WKM from 1970 to 2012.
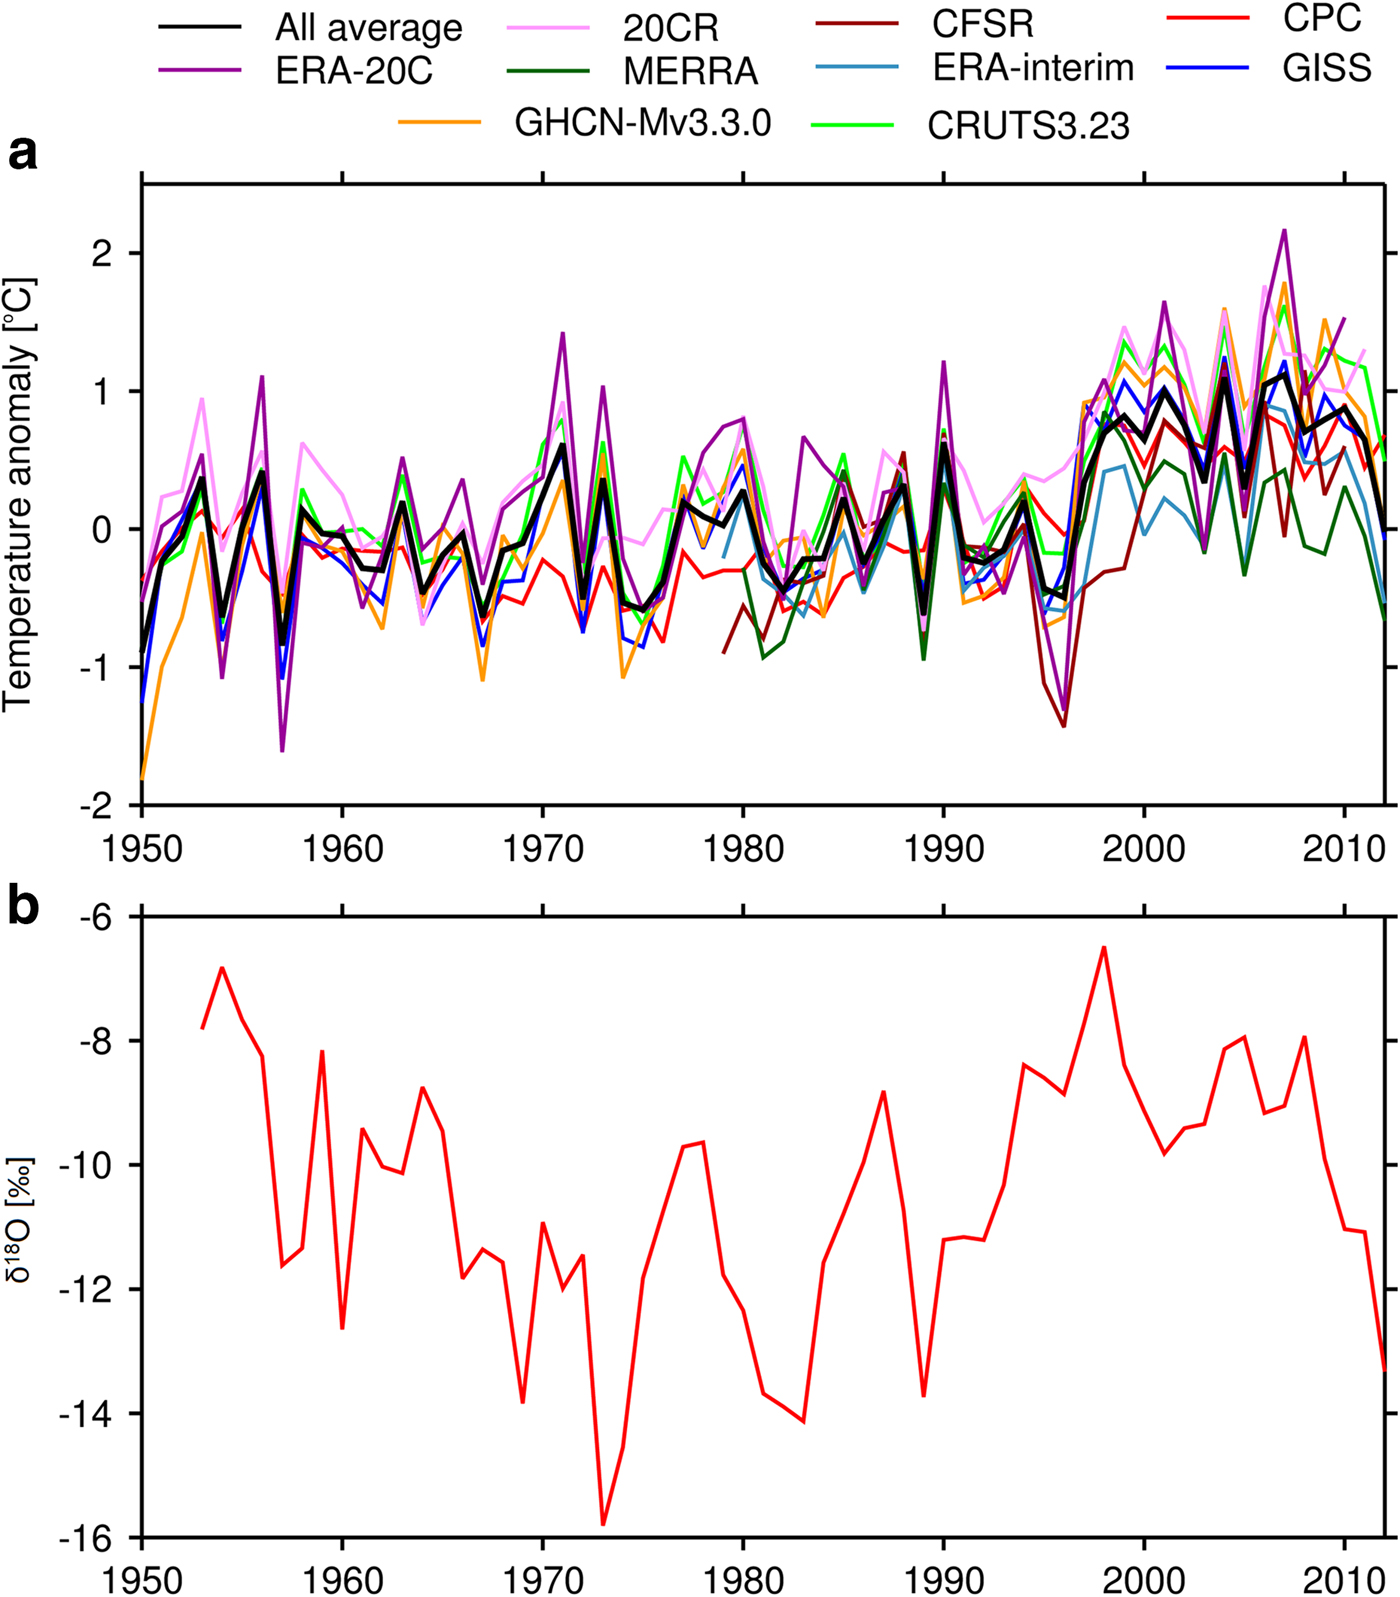
Fig. 9. Time series of air temperature from nine reanalyses for the northwestern Tibetan Plateau (33–39oN, 71–82oE) including ERA-Interim, MERRA, CFSR, GISS, 20CR, ERA-20C, CRU, GHCN-M and CPC (a), and δ18O records from Chongce ice core from An and others (Reference An2016).
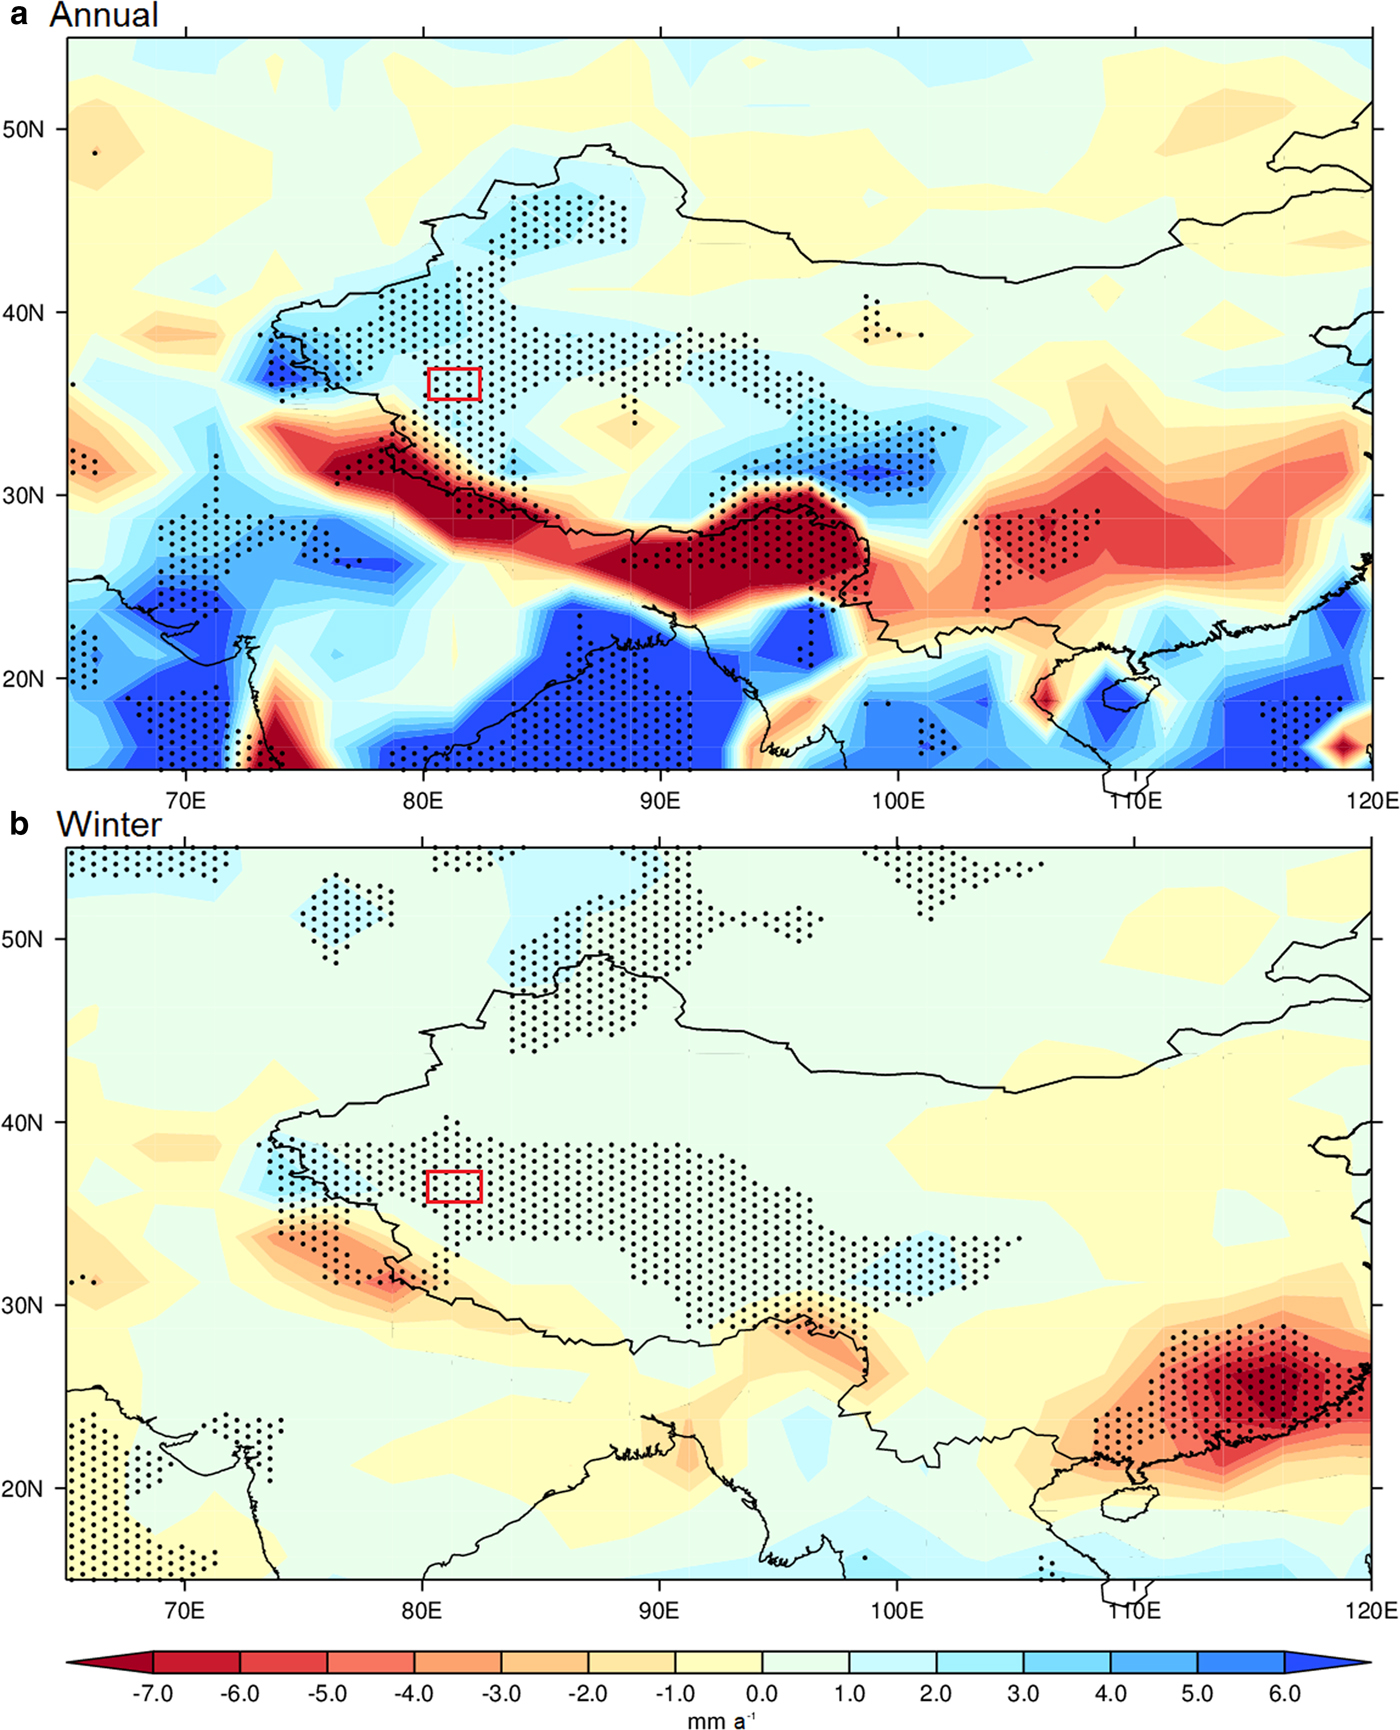
Fig. 10. Linear trend of winter and annual precipitation during the period 1979–2014 from GPCP. Dotted areas denote trends that are statistically above 95% confidence level. Highlighted box shows the location of WKM.
The difference in the sensitivity of glaciers to climate change can result in varying glacier response. WKM glaciers are reported to be more sensitive to changes in winter precipitation, rather than temperature variability, in contrast to other regions of the Tibetan Plateau (Kapnick and others, Reference Kapnick, Delworth, Ashfaq, Malyshev and Milly2014). Furthermore, the increased air temperature in winter will not result in increased melt or changes in precipitation phase, due to their relatively high altitudes. Thus, the increased winter precipitation likely translates into greater snow accumulation that may offset recent summer warming and ablation season increase in melt on the glacier summer melting over the WKM. Alternatively, de Kok and others (Reference de Kok, Tuinenburg, Bonekamp and Immerzeel2018) have suggested that intensive regional irrigation leads to increased cloudiness in summer that would reduce ablation. Further research is required to evaluate these two theories.
6. CONCLUSIONS
Based on a set of remote-sensing data that includes topographical maps, SRTM DEM and Landsat images, changes in glaciers over the WKM are determined. The analysis of the glacier area change reveals insignificant shrinkage (−0.07 ± 0.1% a−1) between the 1970s and 2016, agreeing well with the recent glacier area change estimates by Ji and others (Reference Ji, Guo and Zhang2013) and Bao and others (Reference Bao, Liu, Wei and Guo2015). The slight reduction in glacier extent may imply that the mass budgets in the WKM were also balanced over the last 40 years. However, glacier extent or length changes can only provide an indirect and delayed response to climate change. Here, based on geodetic measurements, we report that WKM glaciers do not experience significant mass change from 1970s to 1999. Combined with mass-balance calculations from ICESat laser altimetry measurements (e.g. Gardner and others, Reference Gardner2013; Kääb and others, Reference Kääb, Treichler, Nuth and Berthier2015), WKM glacier stability is not a recent phenomenon, but has persisted for at least 40 years. The slight reduction in the WKM glaciers may be associated with peculiarities of the regional meteorological or climatic features. More accumulation from increased winter precipitation partly offsets the glacier mass wasting resulting from significant warming during 1970–99. A slowdown in warming since 2000 happened in this region and may also be responsible for the nearly balanced mass budgets, even mass gaining, especially for the early 21st century.
Recently, glaciers in the eastern Pamir and the Hunza catchment in the Karakoram are also reported to have been in balance since the 1970s (Holzer and others, Reference Holzer2015; Bolch and others, Reference Bolch, Pieczonka, Mukherjee and Shea2017; Zhang and others, Reference Zhang2016). These results seem to suggest that the Pamir-Karakoram-WKM glacier anomaly may extend back at least to the 1970s.
SUPPLEMENTARY MATERIAL
The supplementary material for this article can be found at https://doi.org/10.1017/jog.2018.53
ACKNOWLEDGEMENTS
This work was supported by the Outstanding Youth Fund of Shandong Provincial Universities (ZR2016JL030), the National Natural Science Foundation of China (41330526 and 41576182), the Chinese Academy of Sciences (XDA19070103, XDB03030101-4) and the National Key Basic Research Program of China (2013CBA01804). We thank the two anonymous reviewers and Joseph Shea (Scientific Editor) for their work, and their comments and suggestions to improve this paper. Thanks to the USGS which provides SRTM DEM and Landsat 8 OLI satellite imagery, GLCF which provides the orthorectified Landsat MSS and TM/ETM+ images, and National Meteorological Information Center, China Meteorological Administration, which provides meteorological data. ICESat data are derived from NSIDC.


 Open access