


1. Introduction
Ventilation is important to optimise the air quality in indoor spaces (Linden Reference Linden1999; Awbi Reference Awbi2003; Morawska et al. Reference Morawska2020). There are many reasons for achieving effective ventilation, such as thermal comfort, energy savings and to minimise pollutants such as carbon dioxide (CO $_{2}$) or aerosols contributing to the spread of infectious diseases (Fisk Reference Fisk2000; Li et al. Reference Li2007; WHO 2020; CDC 2021). Recently, indoor ventilation has become increasingly important considering that the majority of COVID-19 infections are caused by asymptomatic or presymptomatic infected individuals, and that, by speaking and breathing, tiny saliva droplets are released into the environment, accumulate (Abkarian et al. Reference Abkarian, Mendez, Xue, Yang and Stone2020; Pöhlker et al. Reference Pöhlker2021) and persist in the air for long periods (Bourouiba Reference Bourouiba2020, Reference Bourouiba2021; Chong et al. Reference Chong, Ng, Hori, Yang, Verzicco and Lohse2021). To measure the amount of respiratory contaminants in a room, one often relies on the fact that tiny droplets, aerosols or droplet nuclei (i.e. dried-out droplets) behave like tracers and are simply carried along by the air flow. Therefore, they evolve similarly to another tracer produced through exhalation, namely CO
 $_{2}$. Since CO
 $_{2}$ is easily measured, it is often regarded as a surrogate for indoor airborne contaminants (von Pohle, Anholm & McMillan Reference von Pohle, Anholm and McMillan1992; Rudnick & Milton Reference Rudnick and Milton2003).
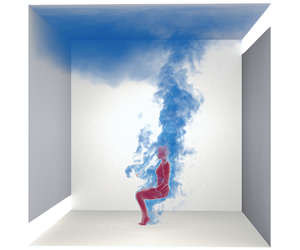
There are two limiting ventilation types (Linden Reference Linden1999; Awbi Reference Awbi2003; Chenvidyakarn Reference Chenvidyakarn2013; Bhagat et al. Reference Bhagat, Davies Wykes, Dalziel and Linden2020). First, for mixing ventilation, air is circulated throughout the room, leading to a uniform distribution of temperature and contaminants (Linden Reference Linden1999), and the purpose of this ventilation type is usually thermal comfort. The second type is displacement ventilation, which has the benefit of displacing contaminants to the upper level of the room where they are extracted, so that occupants breathe fresher air (Bhagat & Linden Reference Bhagat and Linden2020). In this case, the air inlet is at a low level and the air outlet is at a high level. This arrangement results in a flow through the room interior from bottom to top, with the exhaled droplets or aerosols being discharged upwards. The flow in the interior is stratified: each occupant produces an upward thermal plume (the typical heat output of a person at rest is 80 W) due to body heat (Craven & Settles Reference Craven and Settles2006; Bhagat et al. Reference Bhagat, Davies Wykes, Dalziel and Linden2020), which leads to a density stratification, with the warm, lighter air layer above the cooler, heavier counterpart (see e.g. figure 1a). Respiratory contaminants exhaled together with a warm vapour puff that are not entrained by the main body plume tend to accumulate between the stratified air layers (Bolster & Linden Reference Bolster and Linden2007; Bhagat et al. Reference Bhagat, Davies Wykes, Dalziel and Linden2020) to form the so-called lock-up layer (Qian et al. Reference Qian, Li, Nielsen, Hyldgaard, Wong and Chwang2006; Zhou et al. Reference Zhou, Qian, Ren, Li and Nielsen2017).

Figure 1. ( $a$) Illustration of the simulation set-up with the body plume and breathing flow; arrows indicate the inlet and outlet flows. (
 $b{,}c$) Temperature, CO
 $_{2}$ field and horizontal velocity of ventilated flows for (
 $b$)
$b$)  $Q=0.02$ m
 $^3$ s
 $^{-1}$ person
 $^{-1}$, where clean thermal stratification, the interface height
  $h$ and lock-up CO
 $_{2}$ layer are observed, and for (
 $c$)
$c$)  $Q=0.1$ m
 $^3$ s
 $^{-1}$ person
 $^{-1}$, with much stronger turbulent activity behind the body.
Early studies of displacement ventilation were mainly focused on experiments and theories. Sandberg & Lindstrom (Reference Sandberg and Lindstrom1990) were the first to discuss displacement ventilation with a source of buoyancy, which is referred to as natural displacement ventilation since there is no mechanical extraction. Linden, Lane-Serff & Smeed (Reference Linden, Lane-Serff and Smeed1990) further investigated this phenomenon in an enclosure with inflow at the bottom and outflow at the top. They demonstrated the presence of thermal stratification with two layers of uniform temperatures separated by a horizontal interface (see e.g. figure 1). They also derived how the layer height  $h$ of the lower cold zone depends on the effective area of the vent. The stratification is also affected by the number of occupants. With separately distributed buoyancy sources, multiple layers can form, leading to a more gradual change of temperature in the domain (Cooper & Linden Reference Cooper and Linden1996; Livermore & Woods Reference Livermore and Woods2007).
When the displacement ventilation is driven by mechanical extraction or an input wind (Hunt & Linden Reference Hunt and Linden1999, Reference Hunt and Linden2001, Reference Hunt and Linden2005), the interface height  $h$ is obtained from matching the total extraction rate
  $\tilde {Q}$ and the buoyancy sources, giving the hallmark formula:
 \begin{equation} \tilde{Q}=cn^{2/3}B^{1/3}(h-h_v)^{5/3}. \end{equation}
Equation (1.1) is obtained by scaling arguments of a self-similar buoyant plume in an unstratified background (Schmidt Reference Schmidt1941; Morton, Taylor & Turner Reference Morton, Taylor and Turner1956; Linden et al. Reference Linden, Lane-Serff and Smeed1990). Here,  $B$ is the buoyancy flux produced by each of
  $n$ occupants and
  $h_v$ is the ‘virtual origin’ of the thermal plume, i.e. the height at which the plume would start if it were a point buoyant plume. The empirical constant
  $c$ has an approximate value of
  $c\approx 0.105$ (Morton et al. Reference Morton, Taylor and Turner1956; Linden Reference Linden1999). Given that the formula is based on some simple scaling arguments and is derived using some assumptions, one wonders how well the clean zone height
  $h$ prediction works for practical extraction rates and in what range it holds. For example, when the inflow is too strong, the interface can break down and lead to a short-circuit flow between the inlet and outlet (Partridge & Linden Reference Partridge and Linden2017).
In this study, we use direct numerical simulation (DNS) to study the mechanical displacement ventilation with a wide and practically relevant range of ventilation rate  $Q$. To reproduce indoor air flows, the flow is fully coupled to the temperature, and to the CO
 $_{2}$ and water vapour concentration fields. Previous work on indoor ventilation has mainly focused on the design for energy efficiency, whereas, due to the COVID-19 pandemic, the recent objective has been on how ventilation can effectively remove the respiratory contaminant.
Previous numerical studies mainly employed large-eddy simulation (LES) or turbulence models (Davidson Reference Davidson1989; Durrani, Cook & McGuirk Reference Durrani, Cook and McGuirk2015; van Hooff, Blocken & Tominaga Reference van Hooff, Blocken and Tominaga2017), while numerical results obtained by DNS are scarce. However, LES and turbulence models perform differently in different air flow cases (Zhang et al. Reference Zhang, Zhang, Zhai and Chen2007). Simulating flows in the near-wall region is more challenging than those in the free flow region (Piomelli & Balaras Reference Piomelli and Balaras2002) due to the dominance of smaller vortices. LES also becomes more questionable once temperature and CO $_{2}$ are coupled, since with LES the turbulent heat flux can be significantly underestimated (Taylor & Sarkar Reference Taylor and Sarkar2008). Thus the dataset from our DNS can be seen as a benchmark for comparison with results by LES or turbulence models, which are unavoidable for large parameter space studies.
The paper is organised as follows. In § 2, the flow set-up and the governing equations are introduced. In § 3, we discuss how the lock-up effects change with increasing  $Q$ (§ 3.1), explain the change in the layer formation by an energy balance (§ 3.2), analyse globally and locally averaged concentration values (§ 3.3), and discuss the influence of different ventilation set-ups on the lock-up effect (§ 3.4). Finally, in § 4, we summarise our findings and provide an outlook for future work.
2. Flow set-up
Owing to computational constraints, we consider a room of dimensions 3 m  $\times$ 3 m
  $\times$ 3 m, with a single occupant, having an idealised lower-level inlet flow and higher-level outlet flow on opposite walls, as sketched in figure 1(
 $a$). For simplicity, both inlet and outlet have the same heights (0.3 m) and widths (3 m). The ambient temperature, relative humidity (RH) and CO
 $_{2}$ volume fraction of the room are considered fresh and homogeneous initially and set to values acceptable for indoor comfort, i.e.
  $T_{\textit {amb}}=22\,^\circ \textrm {C}$, 40 % and 0.04 %, respectively. Correspondingly, the inlet flow is a uniform flow and set to be the same as the initial ambient conditions, whereas an outflow boundary condition is imposed at the outlet. For the walls, no-slip, impermeable and adiabatic boundary conditions are imposed.
A seated occupant within the room produces thermal buoyancy (from body temperature), high vapour concentration (from exhalation) and respiratory contaminants (represented by CO $_{2}$). The fluid is assumed to be incompressible,
  $\partial _i u_i=0$. To capture complete interactions of these anthropogenic sources, the flow is fully coupled with the heat, water vapour concentration and CO
 $_{2}$ concentration by applying the Boussinesq approximation. The governing equations read
 $$\begin{gather} \partial_t u_i + u_j \partial_j u_i ={-}\rho_{\textit{ref}}^{{-}1}\partial_i p + \nu\partial^2_j u_i + g \delta_{i3} (\beta_T T + \beta_\gamma \gamma - \beta_c c), \end{gather}$$
 $$\begin{gather}\partial_t \phi + u_j \partial_j \phi = \kappa_\phi\partial^2_j \phi. \end{gather}$$
The scalar variable  $\phi$ represents either temperature
  $T$, vapour mass fraction
  $\gamma$, or CO
 $_{2}$ volume fraction
  $c$, all of which are simultaneously taken into consideration. We define
  $\rho _{\textit {ref}}$ as the reference density,
  $\beta _{\phi }$ as the isobaric thermal expansion coefficient of the fluid for each scalar,
  $\nu$ is the kinematic viscosity and
  $\kappa _{\phi }$ is the diffusivity for each scalar, for example,
  $\kappa _{T}$ is the thermal diffusivity. All of these quantities are assumed to be independent of temperature. Accordingly, the gas Prandtl number is
  $Pr \equiv \nu /\kappa _{T} = 0.71$.
The thermal Rayleigh number of the occupant,  $\textit {Ra}_{\textit {ocpt}} \equiv g\beta _T \varDelta h_{\textit {ocpt}}^3/(\nu \kappa _{T}) = 8.8\times 10^8$, where
  $\varDelta \equiv T_{\textit {ocpt}}-T_{\textit {amb}}$ and
  $h_{\textit {ocpt}}=1.2$ m. The grid resolutions are
  $768^3$, with a clipped Chebyshev clustering in the
  $z$-direction to resolve gradients at the upper and lower walls. Our resolutions have been validated by performing grid refinement studies and by comparing with the body thermal plume velocity profile from experiments (Craven & Settles Reference Craven and Settles2006) (see the supplementary material and movies, which are available at https://doi.org/10.1017/jfm.2021.949). Equations (2.1a,b) are solved by DNS using the multi-scalar second-order finite-difference method with a fractional third-order Runge–Kutta scheme (Verzicco & Orlandi Reference Verzicco and Orlandi1996; Ostilla-Mónico et al. Reference Ostilla-Mónico, Yang, van der Poel, Lohse and Verzicco2015). The body in the room is modelled by the immersed boundary method with no-slip boundary, fixed body temperature and zero CO
 $_{2}$ and vapour concentrations.
The interactions are expected to be non-trivial because of the competing effects of hot humid air, which is lighter than the ambient, with the heavier CO $_{2}$. The occupant body temperature is set as
  $T_{\textit {ocpt}} =27\,^\circ$C (Houdas & Ring Reference Houdas and Ring2013), which is the mean of the periphery and ambient temperature. The exhaled breath is set to 27
  $^\circ$C (given that the temperature drops from the mouth at 37
  $^\circ$C), with
  $\textrm {RH}=100$% and CO
 $_{2}$ volume fraction of 4 %. The tidal period and volume of the breath is set to 4 s and 2 l, respectively, matching experimental measurements (Gupta, Lin & Chen Reference Gupta, Lin and Chen2010). Since our focus is on the large-scale flows in the room, and also to make our simulations tractable, the breath is modelled as a Gaussian spatial source at a distance of
  $\approx$20 cm from the mouth and angled
  $60^\circ$ below horizontal. The simulations were performed for at least 500 free-fall time units (equivalent to 30 min in physical time), and we sample the last 200 free-fall units for our statistical analysis. To ensure that the steady state is reached, we compared the last 100 free-fall units to the full sampling duration, and the variation is
  $\sim$1 % difference. A visualisation of the flow field is available in the supplementary movie. The main control parameter of the simulations is the ventilation rate
  $\tilde {Q}$ per person (in the following, p
 $^{-1}$ represents per person), which we denote as
  $Q$ (having units m
 $^3$ s
 $^{-1}$ p
 $^{-1}$). We chose to use
  $Q$ as the ventilation unit instead of air change rate (commonly with units of air changes per hour, ACH), since
  $Q$ includes the number of occupants as the key factor. For reference,
  $\textrm {1~ACH}=0.0075$ m
 $^3$ s
 $^{-1}$ p
 $^{-1}$ or, equivalently, an average inlet speed is 0.0083 m s
 $^{-1}$ in our set-up. The range of
  $Q$ is simulated from 0.01 to 0.1 m
 $^3$ s
 $^{-1}$ p
 $^{-1}$ corresponding to ACH from 1.3 to 13, which adopts the ventilation rate in Bhagat et al. (Reference Bhagat, Davies Wykes, Dalziel and Linden2020).
3. Results
3.1. Influence of  $Q$ on the lock-up effect

We begin by analysing the clean-zone height,  $h$, defined as the height below which the air maintains the same properties as at the inflow (see figure 1). Typically, clean zones are designed to be taller than occupants to ensure a contaminant-free occupied space.
In the presence of thermal sources, a stably stratified environment can exist within a room (Bolster & Linden Reference Bolster and Linden2007) where lower, cooler air is separated by upper, warmer air by an interface at height  $h$. Contaminants such as aerosols and fomites that are entrained by the thermal sources can accumulate at this interface (Bolster & Linden Reference Bolster and Linden2007), and this is commonly referred to as the lock-up effect (Qian et al. Reference Qian, Li, Nielsen, Hyldgaard, Wong and Chwang2006; Zhou et al. Reference Zhou, Qian, Ren, Li and Nielsen2017). To illustrate this point, in figure 2, height
  $h$, the mean temperature profiles and CO
 $_{2}$ concentrations are plotted for various
  $Q$.
$Q$.

Figure 2. ( $a$) Plot of layer height
  $h$, based on the coordinate of the steepest temperature gradient between the upper part of the inlet and the lower part of the outlet, versus
  $Q$. At
  $Q \lesssim 0.05$ m
 $^3$ s
 $^{-1}$ p
 $^{-1}$, the trend of
  $h$ is predicted by (1.1), which is shown by the black dashed line with
  $h_v=0.24$ m (obtained from a linear regression fit to the first five data points). (
 $b{,}c$) Mean profiles for (
 $b$) temperature and (
 $c$) CO
 $_{2}$ concentration for various
  $Q$-values.
In figure 2( $a$), we find that the interface height
  $h$ increases from
  $Q=0.01$ to 0.05 m
 $^3$ s
 $^{-1}$ p
 $^{-1}$. This increasing trend is in remarkably good agreement with (1.1), shown as the dashed line in figure 2(
 $a$), indicating that the thermal body plume can be well approximated by assuming a simplified buoyant plume source in accordance with Morton et al. (Reference Morton, Taylor and Turner1956). However, when
  $Q \gtrsim 0.05$ m
 $^3$ s
 $^{-1}$ p
 $^{-1}$, relation (1.1) no longer holds and
  $h$ remains roughly constant instead. This implies that the simplified assumptions cannot be extended to the largest ventilation rates in our set-up. We will see later that this is because of the dominance of the inflow resulting in vastly different flow structures in the room. We call this large-
 $Q$ regime the inflow-dominant regime. The weak influence of
  $h$ on
  $Q$ for high
  $Q$ values is also reflected in the temperature and CO
 $_{2}$ profiles (figure 2
 $b{,}c$), which remain roughly unchanged for
  $Q \gtrsim 0.05$ m
 $^3$ s
 $^{-1}$ p
 $^{-1}$. To further test the robustness of these results, we conducted three additional simulations with two occupants in the room (shown as crosses in figure 2
 $a$), which are also in agreement with the general trend. It should be noted that the transition point of ventilation rate may change as the number of occupants increases, since the potential energy depends on the number of occupants. It also depends, of course, on the vent size and position, the volume of the room and the geometry. These dependences are not analysed in the present work and deserve further studies.
Using the CO $_{2}$ concentration as an indicator of respiratory contaminants (von Pohle et al. Reference von Pohle, Anholm and McMillan1992), in figure 2(
 $c$), we find that the lock-up effect is evident for
  $Q\lesssim 0.05$ m
 $^3$ s
 $^{-1}$ p
 $^{-1}$, as shown by the peaks in the CO
 $_{2}$ concentration. At
  $Q\gtrsim 0.05$ m
 $^3$ s
 $^{-1}$ p
 $^{-1}$, the CO
 $_{2}$ concentration is substantially reduced as compared to
  $Q=0.01$ m
 $^3$ s
 $^{-1}$ p
 $^{-1}$, suggesting that the contaminant layer depletes at large
  $Q$ and as expected for mechanical displacement ventilation (Bhagat & Linden Reference Bhagat and Linden2020). However, although the lock-up layer diminishes at large
  $Q$, there is a modest increase in CO
 $_{2}$ concentration close to head height at
  $z\approx 1.2$ m (see inset in figure 2
 $c$). This implies that, at
  $Q\gtrsim 0.05$ m
 $^3$ s
 $^{-1}$ p
 $^{-1}$, contaminants become dispersed at lower heights, which contributes to poorer air quality. The findings from this simplified set-up highlight that careful design of indoor ventilation configuration is necessary to ensure efficient removal of contaminants. As stated above, the transition point of the flow rate
  $Q$ also depends, of course, on other factors, such as the room geometry and layout, the vent size and position.
3.2. Regime transition explained by balance of potential and kinetic energy
We next explain why there is transition to the inflow-dominant regime by examining the relative strength of the energies in the system. As depicted in figure 3( $a$), three types of energies (per unit mass) can be identified: (i) kinetic energy,
  $E_k=\tfrac {1}{2}u^2$; (ii) potential energy due to the stable stratification,
  $E_p\equiv N^2\Delta h_{\textit {layer}}^2$; and (iii) energy losses from friction and blockage,
  $E_{\textit {loss}}$. Here,
  $u$ is the inflow velocity,
  $N\equiv \sqrt {\beta _T g |{\mathrm {d}T/\mathrm {d}z}|_{max}}$ is the buoyancy frequency, with
  $\beta _T$ the thermal expansion coefficient and
  $g$ the gravitational acceleration, and
  $\Delta h_{\textit {layer}}$ is the effective thickness of the upper layer (with height of the outlet vent
  $w$ being subtracted) expressed as
  $\Delta h_{\textit {layer}} \equiv H-w-h$ with
  $h$ the height of the clean zone. Thus, the potential energy can be rewritten as
  $E_p\equiv \beta _T g |\mathrm {d}T/\mathrm {d}z|_{max} (H-w-h)^2$.

Figure 3. ( $a$) Sketch of the potential energy,
  $E_p$, and kinetic energy,
  $E_k$, in the displacement ventilation flow. (
 $b$) Plot of
  $E_k$ and
  $E_p$ versus
  $Q$. The transition to a stable
  $h_{\textit {layer}}$ in figure 2(
 $a$) correlates with
  $E_k \sim E_p$ (vertical shaded area) when
  $Q\approx 0.06$ m
 $^3$ s
 $^{-1}$ p
 $^{-1}$, implying that the influence of mechanical mixing is diminished by a stronger inflow when
  $Q\gtrsim 0.06$ m
 $^3$ s
 $^{-1}$ p
 $^{-1}$.
The energy loss in (iii) consists of two parts, which are the friction from the ground,  $E_{\textit {friction}}$, and the drag due to the blockage of the occupant,
  $E_{\textit {block}}$. We estimate
  $E_{\textit {friction}}$ by
  $\frac {1}{2}C_f u^2$ with the friction coefficient for turbulent flow
  $C_f \equiv (2/H) \int _0^{H/2} 0.664 Re_y^{-1/2}\,\mathrm {d} y \approx 0.03$–
 $0.01$ (cf. Pope Reference Pope2000), where
  $Re_y(y) \equiv u y/\nu$. The other part of the energy loss is
  $E_{\textit {block}}$, which is expressed as
  $E_{\textit {block}}=({\alpha }/{2})C_d u^2$. Here, the geometrical factor
  $\alpha$ takes into account the partial blockage by the occupant (estimated by the product of the cross-sectional area of the occupant and the height of the occupant over the domain volume) and its value is approximately
  $0.06$. The drag coefficient
  $C_d \approx 0.7$ (Wang, Zhou & Mi Reference Wang, Zhou and Mi2012). The dissipated energy is two orders of magnitude smaller than the kinetic energy itself and can thus be neglected.
In figure 3( $b$), we compare the residual kinetic energy
  $E_k$ to the potential energy
  $E_p$ for various
  $Q$. When
  $Q< 0.05$ m
 $^3$ s
 $^{-1}$ p
 $^{-1}$ the inflow is still relatively weak compared to the strong thermal stratification established in the room, and therefore
  $E_p$ is dominant. Upon increasing
  $Q$, the influence of the inflow becomes more dominant. At around
  $Q=0.06$ m
 $^3$ s
 $^{-1}$ p
 $^{-1}$, the residual kinetic energy becomes larger and overtakes
  $E_p$. This energy argument explains the transition to the inflow-dominant regimes in figure 2. As can be seen in figure 2(
 $c$), the layer height remains the same for large enough
  $Q$. The physical explanation is that the strong inflow breaks the stratified layer near the outlet and directly leaves the room (see figure 3
 $a$), which has been shown experimentally by Partridge & Linden (Reference Partridge and Linden2017). Therefore, in our set-up the excessive kinetic energy no longer contributes to making the upper stratified layers thinner. Crucially, the particular value of the ventilation rate at which this ‘short-circuiting’ occurs is related to the kinetic energy of the inflow via the vent size and further depends on, at least, the room layout and geometry, and the position and orientation of the vents.
3.3. Globally and locally averaged temperature and CO$_2$ concentration

While spatial profiles are useful for quantifying the interface height  $h$ and the lock-up effect, it is also instructive to compute integral-averaged quantities, since they represent measurable metrics for real-world cases. Therefore, in figure 4, we plot the spatially averaged temperature and CO
 $_{2}$ concentrations versus
  $Q$. The plane averaging is performed on the longitudinal plane and the region near the occupant is omitted. We consider four different ways of averaging; see the inset sketches in figure 4(
 $a$).
$a$).

Figure 4.  $(a)$ Average temperature in front of the body, average temperature behind the body (beyond the direct neighbourhood of the person), local temperature average in the height band
  $0.3\ \textrm {m}< h<1.5\ \textrm {m}$, and point measurement for statistically stationary mean temperature versus
  $Q$; see inset sketches for symbols. (
 $b$) The same, but now for the mean CO
 $_{2}$ concentration. The dashed line in each panel denotes the ambient value of
  $T$ and CO
 $_2$. With increasing
  $Q$, both temperature and CO
 $_{2}$ concentration are reduced to the ambient values.
From figure 4, in all these cases the averaged temperature and CO $_{2}$ concentration eventually decrease towards the ambient values with increasing
  $Q$. In particular, local and pointwise measurements are reduced to ambient values when
  $Q\gtrsim 0.02$ m
 $^3$ s
 $^{-1}$ p
 $^{-1}$. In contrast, the global values are larger than the ambient values and reach a plateau at
  $Q \gtrsim 0.05$ m
 $^3$ s
 $^{-1}$ p
 $^{-1}$. These trends highlight two crucial points. Firstly, measurements at head height can provide an inadequate view of the temperature and CO
 $_{2}$ concentration values (Mahyuddin & Awbi Reference Mahyuddin and Awbi2012). For our case, the inaccuracy is mainly caused by the non-trivial flow organisation, where a stably stratified background flow is separated by a temperature interface. Secondly, increasing
  $Q$ above 0.05 m
 $^3$ s
 $^{-1}$ p
 $^{-1}$ does not alter the global temperature value and CO
 $_{2}$ concentration since they are almost at their ambient values, which further supports the fact that a transition point of
  $Q$ exists for mechanical displacement ventilation if short-circuiting occurs.
3.4. Influence of different flow configurations
To test the sensitivity to different inflow set-ups, we simulated additional cases with air inflow and outflow on the same side (see figure 5 $f$–
$f$– $j$). As seen from these, the stratified temperature field for this case and the original case (figure 5
 $a$–
$a$– $e$) are quite similar (figure 5
 $a{,}f$). Just as before, the region of high CO
 $_{2}$ concentration is closely related to the inflection point in the mean temperature profile
  $T(z)$ (indicated, for example, by the isocontour of 500 ppm in figure 5
 $b{,}g$). On closer inspection, some key differences can be identified. For example,
  $h$ is much lower in the one-sided case (
 $\approx$1.9 m, see circled marker in figure 5
 $j$) and as a result the CO
 $_{2}$ concentration is also higher at that
  $z$-level. Some differences between the profiles are indeed expected since the large-scale flow structures are clearly different for the two-sided and one-sided ventilation cases. In particular, when we inspect the vertical velocity in the periphery above the body (see figure 5
 $i$), we find that there is a significant upward velocity contribution from the inflow. This upflow contribution influences the effective buoyant flux from the body through mixed convection, causing a stronger temperature mixing and thus lowering the interface height
  $h$.
$h$.

Figure 5. Comparison of mean flow fields for two-sided ventilation ( $a$–
$a$– $e$) and one-sided ventilation (
 $f$–
$f$– $j$) for
  $Q=0.05$ m
 $^3$ s
 $^{-1}$ p
 $^{-1}$. The two-dimensional contours show: (
 $a{,}f$) temperature, (
 $b{,}g$) CO
 $_{2}$ concentration, (
 $c{,}h$) horizontal velocity, and (
 $d{,}i$) vertical velocity. The colour map is kept the same as shown in figure 1. The vertical mean profiles of temperature and CO
 $_{2}$ are shown in (
 $e{,}j$), where
  $h$ is denoted by the circle symbol.
4. Conclusions and outlook
In summary, we have shown and discussed a regime transition of mechanical displacement ventilation by studying a wide range of  $Q$. When the ventilation rate is low, the observed flow structure agrees with the classical stratified flow structure of displacement ventilation, where there is a clean and cooler zone established beneath the warm contaminated zone. In this case, the height
  $h$ for the lower clean zone scales with
  $Q$ as
  $h\sim Q^{3/5}$, cf. (1.1). However, when the ventilation rate becomes high , we observe the inflow-dominant regime in which
  $h$ becomes insensitive to
  $Q$. There is a major change in flow structure where the stratified layer partially breaks down due to the kinetic energy of the flow exceeding the potential energy of the stratification. By measuring the ambient mean CO
 $_{2}$ concentration, we find that the local and global concentrations remain unchanged with increasing
  $Q$ in the inflow-dominant regime, implying that too large ventilation strengths (i.e. too large flow rates
  $Q$) do not help to remove more contaminants. Our work gives clear evidence that, for the cross-flow displacement ventilation studied, the benefits of the displacement ventilation strategy break down for too strongly forced inflows. In such cases part of the ventilating flow passes to the outlet without being entrained into the upper layer via thermal convection. We call this mechanism ‘short-circuiting’. Once the ventilation exhibits such short-circuiting, increasing the interface height and the further removal of pollutants from the upper layer both become more challenging.
In the presence of internal heat loads, one expects that the potential energy, or stack pressure, associated with the stratification is decreased as the ventilation flow is increased. For vents of fixed size, this is reflected in an increase of the kinetic energy. We have found no prior evidence of the energy balance being expressed in this manner in the literature, but from our point of view this is a useful approach. For the cases that we examined, once the flow short-circuited, further increasing the kinetic energy of the driving does not result in an enhanced potential energy of the stratification. Moreover, the point at which short-circuiting occurred approximately coincided with the crossing point between the kinetic energy of the inflow and the potential energy of the stratification. We hope that the energy balance analysis as done in this paper will also be applied to other ventilation flows, for example to examine when the transition between a displacement flow and a ‘well-mixed’ state will occur. Clearly, the essence of our findings will also hold for other ventilation scenarios and geometries.
Motivated by mitigating the COVID-19 pandemic, many studies on indoor ventilation have emerged recently (Bhagat & Linden Reference Bhagat and Linden2020; Bhagat et al. Reference Bhagat, Davies Wykes, Dalziel and Linden2020; Morawska & Milton Reference Morawska and Milton2020; Morawska et al. Reference Morawska2020). Given that the parameter space is vast, it is computationally demanding to obtain a generalised view on indoor ventilation. Nevertheless, by examining the energetic balance in the room with simple formulae, one can gain insight into the transition point of  $Q$ for different scenarios, such as cases with different-sized rooms, number of occupants, etc. Note that, in our set-up, we chose idealised inlet and outlet vent shapes and scheme to simplify the energy balance argument. The value of the transition point from the low-
 $Q$ regime to the high-
 $Q$ regime may depend on the geometry and other factors. Further work using LES and other turbulent models are more suitable for exploring the wide parameter space, and are crucial to further generalise the methodology proposed in our work. Our DNS results of ventilation flows can be used for validations of these simulation methods. Lastly, other factors could also influence our results and merit further investigation, such as when occupants are moving between rooms (Mingotti et al. Reference Mingotti, Wood, Noakes and Woods2020), or when occupants are performing different respiratory activities (Pöhlker et al. Reference Pöhlker2021).
Supplementary material and movie
Supplementary material and a movie are available at https://doi.org/10.1017/jfm.2021.949.
Acknowledgements
We acknowledge PRACE for awarding us access to MareNostrum in Spain at the Barcelona Computing Center (BSC) under the project 2020235589 and 2021250115, SURFsara (a subsidiary of Cooperatie SURF, the collaborative ICT organisation for Dutch education and research) and to Irene at Très Grand Centre de Calcul du CEA (TGCC) under PRACE project 2019215098. We would like to thank Dr H. Burridge for his comments and efforts towards improving our manuscript.
Funding
This work was funded by the Netherlands Organisation for Health Research and Development (ZonMW), project number 10430012010022, ‘Measuring, understanding & reducing respiratory droplet spreading’; the ERC Advanced Grant DDD, number 740479; the Foundation for Fundamental Research on Matter with Project No. 16DDS001, which is financially supported by the Netherlands Organisation for Scientific Research (NWO); and Priority Programme SPP 1881 Turbulent Superstructures of the Deutsche Forschungsgemeinschaft. K.L.C. is supported by Shanghai Science and Technology Program under project no. 19JC1412802.
Declaration of interests
The authors report no conflict of interest.


 Open access