


1. Introduction
It is well known that the mass balance of glaciers is an important indicator in assessing climate change (Kang and others, Reference Kang2010; Yao and others, Reference Yao2012). Over the past decades, the glaciers in the Qinghai–Tibet Plateau, especially the temperate glaciers, have experienced a pronounced retreat and mass loss under global warming (Zhou and others, Reference Zhou, Li, Li, Zhao and Ding2018), and the mass loss in the southeastern Qinghai–Tibet Plateau is usually more severe than that in the northwestern (Bolch and others, Reference Bolch2019; Shean and others, Reference Shean2020). Rapid changes in the glaciers not only affect the surrounding natural and human systems in terms of runoff volume but also have an impact on agricultural and tourism activities (Wang and others, Reference Wang, He and Song2010). Moreover, the rise in air temperatures, and consequently the melting and imbalance of glaciers, can have the potential to exert significant social-environmental consequences for the local population, such as glacial lake outburst flood and glacial debris flow hazards (Cui and others, Reference Cui, Dang, Cheng and Scott K2010). Therefore, it is essential to continuously and comprehensively monitor and understand the glacier changes.
Various techniques have been developed for monitoring the glaciers. For example, satellite, airborne and ground observations are widely used to monitor glacier area, ice speed, elevation and mass changes (Baltsavias and others, Reference Baltsavias, Favey, Bauder, Bosch and Pateraki2001; Joughin and others, Reference Joughin, Abdalati and Fahnestock2004; Scherler and others, Reference Scherler, Leprince and Strecker2008; Nuth and others, Reference Nuth, Moholdt, Kohler, Hagen and Kääb2010; Berthier and others, Reference Berthier2014; Racoviteanu and others, Reference Racoviteanu, Arnaud, Williams and Manley2015). However, remote-sensing results often have relatively coarse spatio-temporal resolution and the vertical uncertainty is often relatively large and underestimated (Hugonnet and others, Reference Hugonnet2022). Therefore, these remote-sensing methods are less suitable for small mountain glaciers in steep terrain. In recent years, uncrewed aerial vehicles (UAVs) have been used in glaciers to estimate surface ice velocity and mass balance by repeated measurements, especially for debris-covered glaciers (Immerzeel and others, Reference Immerzeel2014; Che and others, Reference Che, Wang, Yi, Wei and Cai2020). In addition, to measure surface ice velocity and height change of glacier, a network of stakes on glacier surface was installed, surveyed and collected with a Global Navigation Satellite Systems (GNSS) receiver over a fixed period (Machío and others, Reference Machío, Rodríguez-Cielos, Navarro, Lapazaran and Otero2017; Patel and others, Reference Patel2021). Nonetheless, limited by the remoteness and harsh field environment, only a few tens of glaciers have been ground monitored and studied around the world.
The Baishui River Glacier No.1 is a typical temperate glacier in the southeastern Qinghai–Tibet Plateau and the largest reference glacier of Yulong Snow Mountain, the southernmost snow-capped area in mainland Eurasia (He and others, Reference He, Yao, Cheng and Yang2001). The status of the glacier is usually considered to be a representative indicator of local climate change (Yue and others, Reference Yue, Shen, Yu and Zhang2018), and its beautiful geological landscapes are also a valuable tourism resource (Wang and others, Reference Wang, He and Song2010). Hence, the Baishui River Glacier No.1 is affecting the nearby human society in ways that exceed its role as a provider of water. However, like the majority of glaciers worldwide, the Baishui River Glacier No.1 has been shrinking at a rapid rate: the elevation of the glacier terminus retreated from 4100 to 4300 m a.s.l. during 1982–2006 (Pang and others, Reference Pang, Yuanqing and Zhang2007) and the glacier length decreased from 2.65 to 1.90 km between 1957 and 2017, while glacier area decreased from 2.07 to 1.32 km2 (Wang and others, Reference Wang, Che, Pang, Du and Zhang2020). To assess the changes in the Baishui River Glacier No.1, many ground-based and airborne measurements have been carried out there over the past decades. For example, several meteorological stations have been installed near the glacier to monitor and record meteorological variables since 2005 (Wang and others, Reference Wang, Che, Pang, Du and Zhang2020; Yan and others, Reference Yan2021a; Chen and others, Reference Chen, Che, Cao, Wang and Ma2022). With field investigations and remote-sensing observations, the surface velocity and mass balance of the Baishui River Glacier No.1 were also estimated during the period 2008–2020 (Yan and others, Reference Yan2021a, Reference Yan2021b). Furthermore, UAV was used to monitor the dynamic features of velocity and mass balance of the glacier (Che and others, Reference Che, Wang, Yi, Wei and Cai2020). These studies show that several factors, such as width, slope, surface meltwater, ice avalanche and crevasses, play important roles in spatial movement patterns of the Baishui River Glacier No.1. Nevertheless, the current monitoring methods are often difficult to maintain continuity and inadequate to provide specific details about the seasonal change processes of glaciers. Energy and mass-balance models have been used in some studies to fill the gap in data (Huintjes and others, Reference Huintjes, Neckel, Hochschild and Schneider2015; Li and others, Reference Li, Yao, Yang, Yu and Zhu2018; Zhu and others, Reference Zhu2021), but they usually need to be adjusted with reliable measurements of glacier and meteorological parameters, and some physical indicators such as ice temperature have limited observations in the Qinghai–Tibet Plateau to support these models (Wang and others, Reference Wang, Che and Yanqiang2021).
With the low-power wireless sensor network, permanent monitoring in near real-time has been successfully established with the GNSS platform in some remote locations, such as the Swiss Alps (Beutel and others, Reference Beutel2021). Also, the real-time surface mass-balance variations at the point scale on three glaciers of the Swiss Alps have been automatically derived from in situ stations with ablation stakes and cameras (Cremona and others, Reference Cremona, Huss, Landmann, Borner and Farinotti2023). These studies provide new ideas about real-time monitoring of glacier changes; however, such real-time platforms or stations are still very restricted worldwide, especially in the Qinghai–Tibet Plateau. Additionally, most current platforms have singular functions, generally divided into two categories: one is similar to the weather station to obtain meteorological parameters (Citterio and others, Reference Citterio, Diolaiuti, Smiraglia, Verza and Meraldi2007; Netto and Arigony-Neto, Reference Netto and Arigony-Neto2019), while the other is based on the GNSS to monitor the movement of the glacier (Ahlstrøm and others, Reference Ahlstrøm2013; Machío and others, Reference Machío, Rodríguez-Cielos, Navarro, Lapazaran and Otero2017). Although integrated glacier observation platforms have been established on the Greenland and Antarctic ice sheets for some time (Frezzotti and others, Reference Frezzotti, Capra and Vittuari1998; Fausto and others, Reference Fausto2021), these are still scarce on other glaciers (Filhol and others, Reference Filhol2023) and especially in High Mountain Asia. In response, attempts at deriving more information about the seasonal glacier change and meteorological conditions based on a new platform show great promise.
In light of the above background, we designed and built a new automated monitoring platform accompanied by the solar power supply, 4G, a GNSS receiver, an infrared temperature sensor, a laser ranger and a trail camera, aiming to quantify continuous glacier change in real-time. It is an integrated instrument and useful tool to obtain time series data on the status of the glacier and meteorological conditions, of which 4G is used for real-time data sending. The platform was installed on 23 July 2021 on the Baishui River Glacier No.1. The raw GNSS observables data were processed by double-differential GNSS post-processing. The collected laser ranger data were used to determine the ice surface height, which was then combined with the camera to record the ice melt and snow accumulation of the glacier in detail. The goals of the present work are (1) to introduce the real-time observational platform as a new means of glacier monitoring and (2) to understand the latest seasonal change on the Baishui River Glacier No.1 using the platform data available between July 2021 and April 2022.
2. Study area and field monitoring platform
2.1 Study area
Yulong Snow Mountain is a glacier geopark (26°59′–27°17′ N, 100°4′–100°15′ E) located in the southeast region of the Qinghai–Tibet Plateau, extending ~13 km east-west and ~35 km north-south. Geologically, the Yulong Snow Mountain massif is enclosed by active Quaternary faults, which have caused its uplift while simultaneously leading to the subsidence of the Lijiang Basin, and the Jinsha River has subsequently carved deep incisions in the surrounding terrain (Fig. 1a) (Kong and others, Reference Kong, Na, Fink, Zhao and Xiao2009). Due to its easy access near Lijiang city, Yulong Snow Mountain has gradually developed into the largest glacier tourist destination in China since 1996. The glacial region of Yulong Snow Mountain is the closest temperate glacier area in the Eurasian continent to the Equator (other than Indonesia's Chaya Peak), with the highest peak (Shanzidou) at 5596 m a.s.l. (Wang and others, Reference Wang, Che, Pang, Du and Zhang2020). There are 13 temperate glaciers existing with a total area of ~4.48 km2 in Yulong Snow Mountain, of which the Baishui River Glacier No.1 is the largest one with an area of ~1.32 km2 and an elevation ranging from 4395 to 5361 m a.s.l. (Fig. 1b). During the summer, the local climate is controlled by Indian and southeast Monsoons, whereas affected by the south branch of the westerly belt in the winter and spring (Yao and others, Reference Yao2012). The precipitation was mainly concentrated from June to September with ~950 mm over the past two decades, which accounted for 80–90% of the total annual precipitation (He and others, Reference He2004). The average air temperature is –3.67°C from October to May and becomes 5.08°C from June to September (Niu and others, Reference Niu2017).

Figure 1. (a) Yulong Snow Mountain and its location in Qinghai–Tibet Plateau. (b) Baishui River Glacier No.1 and the location of the real-time monitoring platform.
2.2 Real-time in situ observational platform
The deployment site of our observational platform is shown in Fig. 2a, which is located in the firn basin area of the Baishui River Glacier No.1 (27°6′17″ N, 100°11′28″ E). As the ice can melt up to ~2 m in the summer, we designed the observation platform with four legs, where each leg is a hollow iron round tube ~5 m long and 5 cm in diameter (Fig. 2b). The steam drill was used to insert the 5 m leg into the ice. Then, a horizontal steel plate is fixed and tied with the four legs, and the platform is fixed with the steel plate. Finally, the sensors were mounted on the top of the platform, and the GNSS antenna and solar panel were kept as high as possible to minimize the impact of heavy snow deposition on the equipment. Table 1 lists the specific instruments and sensors installed on the platform.
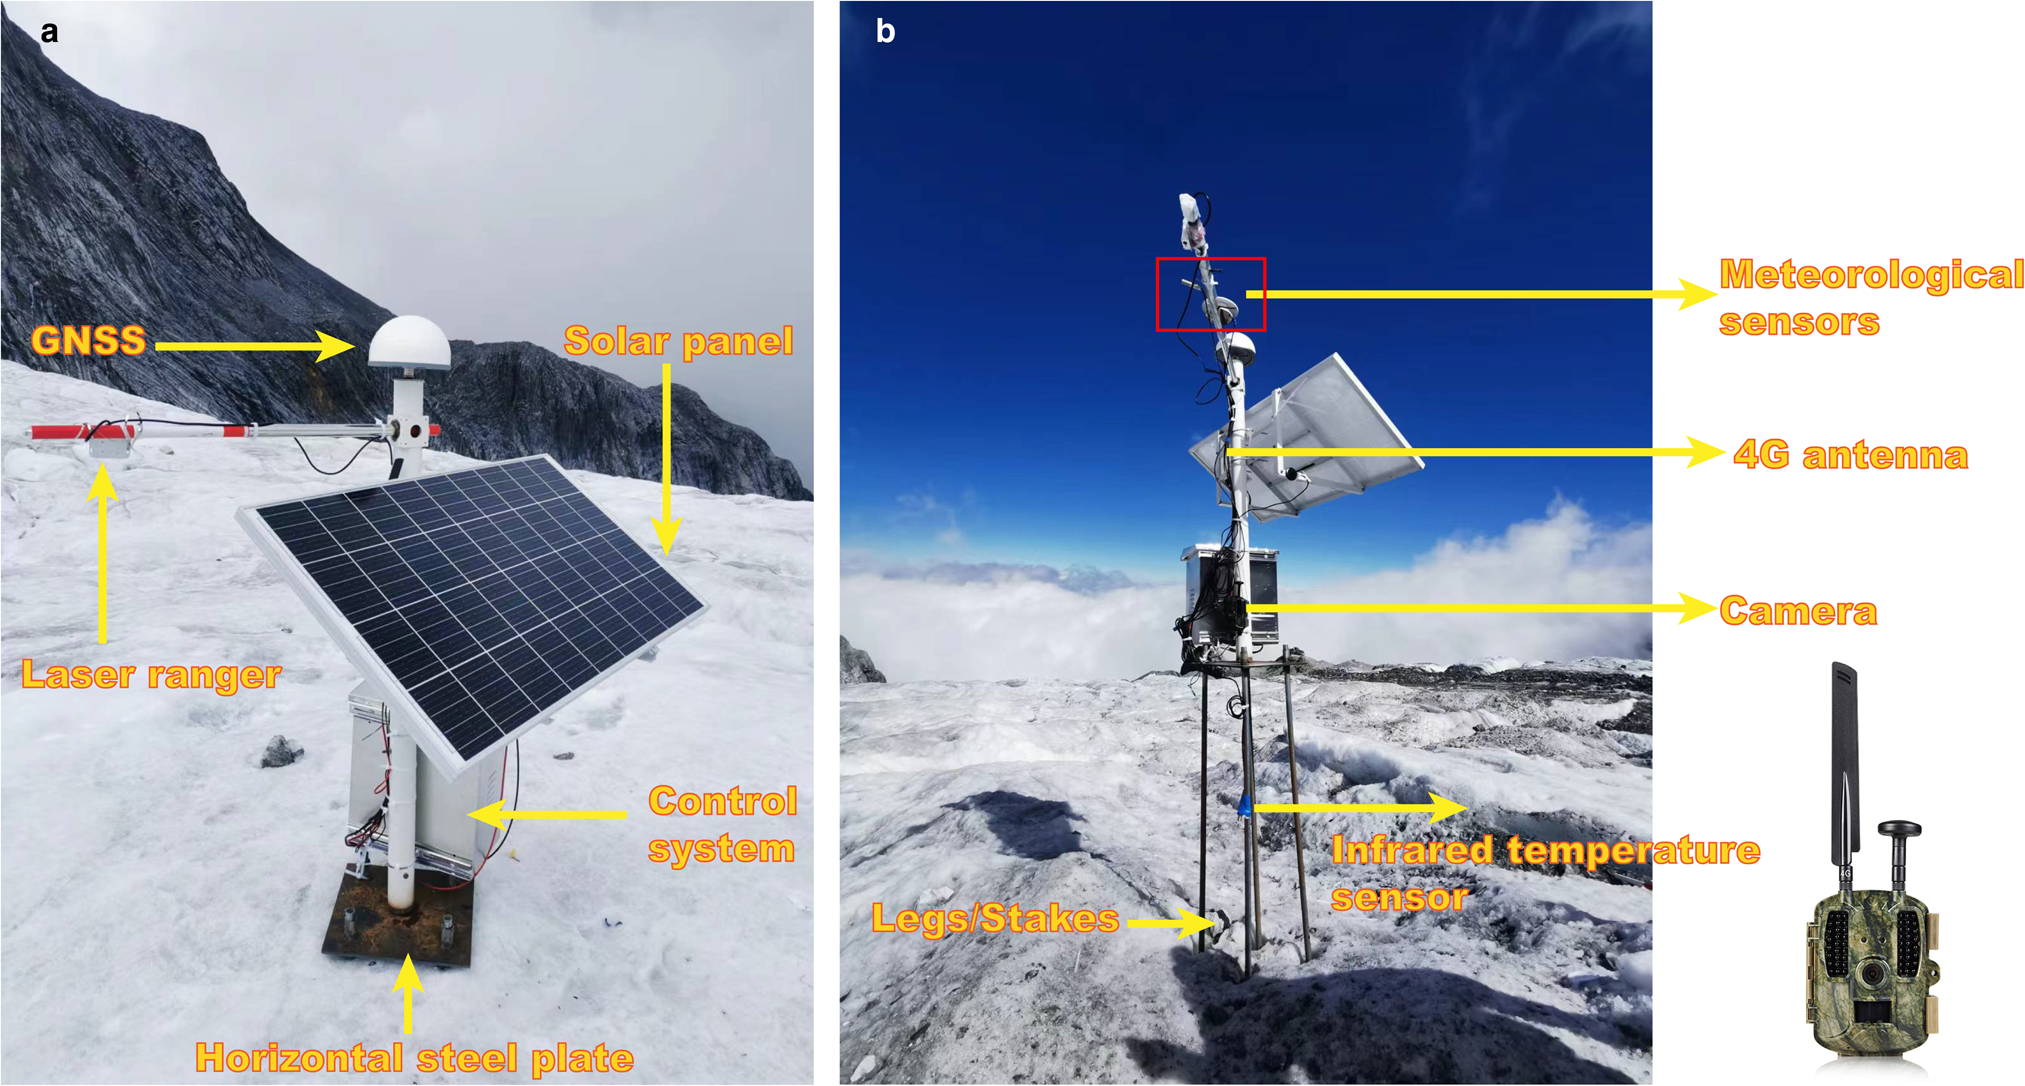
Figure 2. The automated monitoring platform used to obtain near-real-time estimates of glacier information. (a) Photo taken on 23 July 2021; (b) photo taken on 18 October 2021.
Table 1. List of instruments at the in situ equipment with their technical specifications

2.2.1 GNSS receiver
An in situ GNSS instrument was installed on the monitoring platform in order to record the ice flow movement of Baishui River Glacier No.1 continuously. The GNSS sensor is SinoGNSS A300 receiver, which is an integrated design with high-performance GNSS OEM board and antenna in one rugged housing. The A300 model is capable of tracking GPS L1, L2, BeiDou B1, B2, GLONASS L1, L2, Galileo E1, E5b and SBAS, and supports 4G/Bluetooth Communication/SD-card storage/maximum sampling rate 10 Hz with the IP68 waterproof. Moreover, the operating temperature and storage temperature is −40 to 75°C and −55 to 90°C, respectively. Hence, A300 model is capable of data transmission in near-real-time with the 4G signal. In order to reduce the necessary power consumption, e.g. when there is reduced solar radiation available for energy harvesting, the sample rate was set as 5 s.
2.2.2 Laser ranger
The laser ranger was designed to collect the real-time antenna height, which varies when the ice melts or snow accumulates. Then, the surface height changes can be used as a mass-balance parameter of the glacier. Few relevant data have been published in the literature, primarily from large-scale terrestrial laser scanning (Bauer and others, Reference Bauer, Paar and Kaufmann2003; Fischer and others, Reference Fischer, Huss, Kummert and Hoelzle2016), and there are hardly any ongoing in situ observations of temperate glaciers. The accuracy of the laser ranger is labelled up to 1 mm, with a maximum sampling rate 20 Hz and a maximum distance of 40 m. Its operating temperature is −20 to 70°C. A cross arm is perpendicular to and fixed in the GNSS mast. To obtain the antenna height, a laser ranger is fixed in the cross arm and close to the GNSS receiver. The sample rate of the laser ranger is set as 1 min. Of note, the first laser ranger failed on 3 September 2021 and we replaced it with a new laser ranger at the same position and height in the equipment update on 18 October 2021.
2.2.3 Camera
To aid the glacier monitoring, a 4G trail camera was attached to the GNSS mast. The camera is usually designed to photograph wild animals, with a full-size image of 16MP. The trigger speed is 0.3 s and the camera angle is ~120 degrees. It supports 4G LTE, 3G WCDMA and 2G GSM networks, sending short messages and images. Moreover, the operating temperature is −20 to 75°C, with the IP65 waterproof. The 32GB SD card is used to store the photos, and its photo rate is set as 1 h.
2.2.4 Infrared temperature sensor
On the platform, an infrared temperature sensor is used to measure the surface temperature of the glacier, which is fixed to one leg of the GNSS platform. It calculates and returns the temperature by measuring the intensity of infrared radiation emitted from the glacier surface with an accuracy of ~0.1°C and an operating temperature of −30 to 80°C. The sample rate of the infrared temperature sensor is set as 5 min.
2.2.5 Meteorological sensor
An integrated industrial meteorological sensor is used to monitor the meteorological conditions in the glacier environment, including air temperature, humidity and pressure. It is fixed to the cross arm of the platform. The measurement ranges of temperature, humidity and pressure are −40 to 80°C, 0–100% relative humidity, 0–1 MPa, respectively. The supply voltage of the sensor is 5–24 V, the power is <0.1 W, and the sampling rate is set as 5 min. Unfortunately, due to an error in the power supply system, the meteorological sensor became damaged and did not record the data successfully during the entire observation period.
2.2.6 Solar power system
The solar power system is mainly composed of solar panels, lithium batteries and a digital display controller. The solar panel on the platform is ~1 m in length and 0.6 m in width, with a power of 100 W, an operating voltage of 9.3–12.1 V, an operating temperature of −70 to 60°C and a waterproof of IP66. A 120Ah lithium battery and a 20A controller are used with the solar panel. When working, the solar panel converts light energy into solar energy stored in the battery, and the battery gives power to the electricity-using equipment. The whole process is automatically adjusted by the digital display controller to ensure a stable 12V DC voltage output.
2.3 Data storage and transmission
Our aim is to transmit and archive the observation data from each sensor in real time. As one of the famous tourist destinations, cellular network coverage in the Yulong Snow Mountain has been set up by several companies, and the standard 3G/4G modems were available here. For the GNSS and the trail camera, the data storage and 4G communication are integrated. For the laser ranger, the infrared temperature sensor and the meteorological sensor, their data control, data storage and data communication are implemented through a data transfer unit (DTU). To protect the device, the charge controller, the lithium battery and the DTU for the laser ranger, infrared temperature sensor and meteorological sensor were stored in the waterproof case. To reduce energy consumption, the data sample rate is limited.
As the sensors on the platform were modular installations in practice, the specific measuring time of each sensor was not completely the same. In addition, due to power supply problems and sometimes weak transmission signals, not all data were successfully saved during the observation time. The final data collection information for each sensor is shown in Fig. 3. From July 2021 to April 2022, the GNSS recorded a total of 204 d of data, while the laser ranger was 68 d, the infrared temperature sensor was 125 d and the camera was 104 d. The number of days of data collection varies for each sensor, which may be related to the differences in performance between sensors as well as data communication modes. It is evident that the GNSS had the most reliable data collection and continued to 11 April 2022, while data collection from all other sensors broke down in January 2022, which may be related to the damage of the DTU caused by heavy snow deposition. Due to the harsh glacier environment in January, we were unable to repair the DTU in time and the last record is dated 30 January 2022.

Figure 3. The data coverage of each sensor between July 2021 and April 2022. The blue bar indicates that the sensor successfully collected data during the corresponding time period.
3. Results
3.1 Glacier surface movement
Few studies have been carried out on the movement of the Baishui River Glacier No.1 in the winter season (November–April), mainly for the practical reason that human access to the glacier is restricted by the harsh environment after mid-October. In this study, the GNSS receiver was installed on 28 July 2021 and the measurement data records began on 31 July 2021 and continued until 11 April 2022. Due to problems with the power supply and poor transmission signal, only 3 d data were available in total for July–August 2021 and hence our study period began on 3 September 2021 for the seasonal glacier dynamics. The continuous daily movement of the platform location on the glacier is displayed in Fig. 4. Since the platform is attached to the glacier surface, the movement of the instrument represents the surface ice velocity of the glacier.

Figure 4. (a) Daily coordinate series in east, north and elevation of the in situ GNSS instruments between 3 September 2021 and 11 April 2022. The movement distance relative to the initial position was further calculated. (b) The daily ice velocity calculated by the movement distance; the dashed line shows the linear trend of ice velocity change.
The displacement monitoring was analyzed in three directions: longitude (E), latitude (N) and elevation, and we further calculated the distance of horizontal movement, shown in Fig. 4a. From the curves of cumulative offset to the north and east, a positive linear and steady trend was observed, indicating that the platform position was moving to the northeast continuously. The total movement for the monitoring period of 8 months was measured to be ~12.9 m, with 4.7 m to the north and 12 m to the east respectively. The daily surface velocities were calculated as taking the movement distance between the positions and dividing by the time interval (Fig. 4b). It was averaged ~0.06 ± 0.02 m d−1 for the whole observation period, with a maximum value of 0.12 m d−1 and a minimum value of 0.01 m d−1. However, there was no significant acceleration or deceleration of the horizontal velocity changes with time. Meanwhile, the elevation of the platform decreased by ~2.4 m from 4646.3 to 4643.9 m a.s.l. during the observation period (Fig. 4a). The elevation displacement of the platform reflected the change in the slope of the glacier surface with the horizontal movement. Two distinct phases of surface height change were identified from the elevation displacement curve. The first phase was from September to October 2021 at a faster change rate of about −0.02 m d−1, while the second was from November 2021 to April 2022 at a slower change rate of about −0.01 m d−1 (Fig. 4a). This shift may represent the undulation of the terrain as the platform moved, indicating steeper terrain in the first phase and gentler terrain in the second phase.
3.2 Glacier surface temperature variation
Based on the platform observations, we obtained a continuous time series of glacier surface temperatures in the Baishui River Glacier No.1 between September 2021 and January 2022 (Fig. 5). According to the meteorology of the glaciers in High Mountain Asia, four seasons usually be delineated: pre-monsoon (April–May), monsoon (June–September), post-monsoon (October–November) and winter (December–March) (Azam and others, Reference Azam2016; Heynen and others, Reference Heynen2016; Sunako and others, Reference Sunako, Fujita, Sakai and Kayastha2019). Thus, our observation period has mainly covered the late monsoon, full post-monsoon and the first half of winter. Figure 5 shows that the glacier surface temperatures were more stable and closer to the melting point during the monsoon, with an average of about −3.5°C. However, large fluctuations were found during the post-monsoon and winter seasons, with the higher −5 to −10°C and lower close to −20°C. What is noteworthy is that a new season could be characterized by a sudden change in the glacier surface temperature. For example, an evident inter-seasonal change was found between the monsoon and post-monsoon, distinguished on 23 October 2021, with a decrease of about 10.1°C in mean glacier surface temperature (Table 2). Similarly, a change was also found between the post-monsoon and winter, distinguished on 11 December 2021, and the mean glacier surface temperature decreased by ~4.6°C. In particular, the lowest glacier surface temperature was observed in December during the observation period and the glacier surface temperatures appeared to have risen slightly after mid-January, but this could not be further confirmed due to the break in the observational data record.

Figure 5. Glacier surface temperature and air temperature change between 14 September 2021 and 30 January 2022. The air temperature data are from the automatic weather station at 4800 m and modified to the corresponding position on the platform. Based on the data sampling interval, glacier surface temperature is plotted on a 5 min scale and air temperature is plotted on an hourly scale. The season period of monsoon, post-monsoon and winter in this study are shown in red, green and blue, respectively.
Table 2. Seasonal mean glacier surface temperature and air temperature during the observation period

The hourly air temperature data obtained from an automatic weather station (AWS) at 4800 m a.s.l. in the Baishui River Glacier No.1 was compared with that of the infrared temperature sensor (see Fig. 1). Since the elevation of our monitor platform is ~4650 m a.s.l., we simply modified the air temperatures according to the principle that the temperature decreases by 0.6°C per 100 m rise in altitude (Beckage and others, Reference Beckage2008), thus obtaining the time series of air temperature corresponding to the platform position. From Fig. 5, the variation of glacier surface temperature and air temperature presents a good consistency overall. Specifically, glacier surface temperature changed with air temperature but showed a slight lag. This slight lag may be a result of the geographical distance and difference in environment between the AWS and the platform. The curve of air temperature is as stable as that of the glacier surface temperature during the monsoon, with a mean value of ~5.7°C. Moreover, its fluctuations during the post-monsoon and winter also coincide well to the subsequent changes in glacier surface temperature, with the mean air temperature decreasing ~6.2°C from monsoon to post-monsoon, and 5.5°C from post-monsoon to winter (Table 2). Compared with air temperature, the glacier surface temperature showed a more dramatic change between monsoon and post-monsoon, which may be explained by the influence of meltwater and heat exchange (Du and others, Reference Du2013).
3.3 Surface ablation and snow accumulation at platform point
Figure 6a shows the distance variations observed at the platform point of the Baishui River Glacier No.1 during the whole period. According to the observed process of distance change, the glacier experienced three stages. The first stage was from 23 July 2021 to 23 August 2021, when the laser ranger distance continuously increased from 1.35 to 2.44 m, implying the surface height of the glacier decreased by ~1.09 m at a rate of ~0.03 m d−1 (point mass balance was −0.98 m w.e. using the density of 0.9 × 10³ kg m−3). However, the melting appeared to have stopped during the second stage from 24 August 2021 to 11 January 2022. Despite the lack of data recorded during this period, the distance before and after the two breaks did not change significantly: from 2.47 to 2.46 m between 3 September 2021 and 18 October 2021 (0.01 m w.e.), and from 2.27 to 2.35 m between 29 October 2021 and 8 January 2022 (−0.07 m w.e.), indicating that the glacier had neither melted nor accumulated much. Noteworthily, a small amount of snow accumulation occurred between 19 and 23 October 2021, as the observed distance showed a drop of ~0.2 m. The most rapid snow accumulation was in the third stage, which began on 12 January 2022, and reduced the distance from 2.35 to 1.43 m by 14 January 2022, with a 3 d accumulation of ~0.83 m w.e. While the snow melted slightly on 15 January 2022 (the distance picked up), the general trend of accumulation followed, with the distance further dropping to 0.84 m by 30 January, and the total point mass balance reached 1.36 m w.e. Overall, the three stages are essentially seasonally related, i.e. ablation occurs in the monsoon, accumulation occurs in winter and neither ablation nor accumulation is dominant in the post-monsoon.

Figure 6. Glacier ablation and snow accumulation (a) at the platform point between 23 July 2021 and 30 January 2022, (b) at the rock platform between 2 January 2022 and 29 January 2022. The red dashed line indicates the end of melt or the beginning of snow accumulation. The grey shaded area in panel a indicates the overlapping observations on the glacier and at the rock platform. (c) A site photo of the rock platform.
Another laser ranger was placed on the rock platform outside the glacier to monitor snowfall events (Fig. 6c). Coinciding with the observations on the glacier, it also observed snow accumulation on 12 January 2022, and the following snow melting on 15 January 2022 (Fig. 6b). The distance changes obtained from the rock platform can further be used as a reference to supplement the process of glacier mass change not recorded by the platform on the glacier, such as the data gap after 18 January 2022. As shown, an accelerated snow melting occurred from 22 to 23 January 2022, followed by a rapid accumulation on 24 January 2022.
4. Discussion
4.1 The seasonal dynamics of the Baishui River Glacier No.1
As a temperate glacier, the Baishui River Glacier No.1 has stronger accumulation and longer ablation than other types of glaciers, and has more intense ablation phases (Du and others, Reference Du2013; Wang and others, Reference Wang, Che and Yanqiang2021). Thus, the Baishui River Glacier No.1 is in a highly unstable state, as its equilibrium line altitude has risen by almost 200 m from 1982 to 2009, and the accumulation area ratio was close to 0 by 2009 (Du and others, Reference Du2013). From 1957 to 2017, the length of the Baishui River Glacier No.1 decreased by 12.5 m a−1 (Wang and others, Reference Wang, Che, Pang, Du and Zhang2020) and the glacier mass loss is accelerating with atmospheric changes (Yan and others, Reference Yan2021b). Surface change is one of the focus studies of the Baishui River Glacier No.1, which is usually determined by glacier dynamics and surface mass balance. However, most studies of the Baishui River Glacier No.1 are at larger spatial and temporal scales that can hardly reflect accurately the current seasonal dynamics.
The latest observations in this study showed that the average daily velocity of the Baishui River Glacier No.1 was ~0.06 ± 0.02 m d−1 at the platform position from September 2021 to April 2022. It was lower than that in the ablation period in 2018, which was reported to be 0.14 ± 0.05 m d−1 between May and September (Che and others, Reference Che, Wang, Yi, Wei and Cai2020). This difference can be explained by the different observation areas and periods, which makes the glacier conditions different. In addition, it is generally accepted that the main factor affecting variability in ice flow speed of Baishui River Glacier No.1 is basal sliding (Yan and others, Reference Yan2017). However, we found that there was no significant acceleration or deceleration of the horizontal velocity changes during our study period (Fig. 4b). This is probably due to the fact that September is at the end of the melt season and therefore the surface velocity has slowed down and levelled off. From the observations of the laser ranger, the Baishui River Glacier No.1 was in a constant state of ablation in July and August, with an ablation rate of ~0.03 m d−1, lower than the glacier front average 0.053 m d−1 during the 2018 melt season (Che and others, Reference Che, Wang, Yi, Wei and Cai2020). The ablation stopped in September, which is also shorter than the expected ablation period from mid-May to October (Du and others, Reference Du2013). Therefore, the weaker ablation of the Baishui River Glacier No.1 in 2021 may also be a reason for the slower surface movement compared to that in 2018. Moreover, the lack of significant changes in the inter-seasonal dynamics suggests that the seasonal mass balance of the Baishui River Glacier No.1 in 2021 is principally determined by the surface mass balance.
4.2 Surface mass-balance response to the seasonal change in meteorological conditions
Limited by the glacier environment, the seasonal mass-balance measurements on the Baishui River Glacier No.1 were generally made between June and October by using ablation stakes (Che and others, Reference Che, Wang, Yi, Wei and Cai2020; Yan and others, Reference Yan2021b), and the observations often could not be carried out on fixed dates. After October, the mass-balance studies of the Baishui River Glacier No.1 were largely unavailable, and only the snow pits could be used to estimate the accumulation in the non-monsoon period (Yan and others, Reference Yan2021b), with a long observation interval. While the above methods can be used to estimate the change of interannual mass balance, e.g. the cumulative mass losses of the Baishui River Glacier No.1 between 2008 and 2020 were ~18.57 ± 3.62 m w.e. (Yan and others, Reference Yan2021b), it does not capture the characteristics of interseasonal and short-term glacier mass balance. With the automated monitoring platform, we obtained more extended and continuous seasonal point mass-balance observations here, and these results may provide new insights into the seasonal change in the Baishui River Glacier No.1 compared to traditional glaciological measurements.
In order to understand the seasonal processes controlling the surface mass balance of the Baishui River Glacier No.1, three seasons were selected for comparisons in our study period, i.e. the monsoon, the post-monsoon and winter. As we described in section 3.3, the monsoon and winter were the ablation and accumulation seasons of the Baishui River Glacier No.1, respectively, while the post-monsoon was the equilibrium season, when the glacier was dominated by neither melting nor accumulation. Actually, a study of glacier energy balance at the Urumqi River Glacier No.1 showed that the surface mass balance of the glacier was closely related to the change in meteorological conditions (Che and others, Reference Che2019). It was found that the net annual mass balance of the Urumqi River Glacier No.1 decreased by 0.44 m w.e. when the air temperature increased by 1°C and increased by 0.30 m w.e. when the air temperature decreased by 1°C. Accordingly, we calculated the mean air temperature and point mass balance at the Baishui River Glacier No.1 for three seasons, shown in Table 3, where the specific window for each season is based on the available data. Clearly, the surface mass balance of the glacier does exhibit a response to the change in air temperature, as the seasonal net mass balance increases with the decrease in inter-seasonal air temperature. We also found that the change rate of inter-seasonal mass balance was accelerated as decreasing in air temperature. Specifically, from monsoon to post-monsoon, an average decrease of 1°C increased the point mass balance by 0.11 m w.e., while from post-monsoon to winter, an average decrease of 1°C increased the point mass balance by 0.22 m w.e. Although these results are based on the platform point scale, they still provide further evidence that temperature is an important driver of surface mass balance of the Baishui River Glacier No.1, and also demonstrate that the response of glacier surface mass balance to changes in meteorological conditions is non-linear.
Table 3. Seasonal mean air temperature and mass balance at platform location for three seasonal periods in 2021–22

4.3 Snowfall event on the Baishui River Glacier No.1 and its impact
Snowfall events are another important record from our platform observations, as snowfall not only implies an accumulation of glacier mass, but also may be an important form of heat exchange, which leads to glacier surface temperature change. The trail camera on the platform was used to record the actual glacier scene. It has recorded many snowfall processes, such as on 12 January (Fig. 7a), showing the flurry of snow particles and the accumulation. Moreover, the glacier landscape under several stages is shown in Fig. 7b. From the figure, the glacier field did not change significantly between 2 and 5 January 2022, corresponding to the stable period without snow accumulation in the early stage. By 22 January 2022, substantial snow accumulation had occurred, corresponding to ~50 cm at the platform (see Fig. 6), while by 23 January the snow had started to melt (Fig 6b). These results demonstrate the ability of the camera to monitor glacier melting and snow accumulation processes in detail and reliably, providing additional information in cases where laser ranging is not working.

Figure 7. (a) Snowfall process during the day of 12 January 2022 and (b) glacier changes from 2 to 23 January 2022, photographed by the trail camera.
Combining the observations from the camera and infrared temperature sensor, we found that the process of falling glacier surface temperatures was usually accompanied by snowfall events. As shown in Fig. 8, snow fell on 22 October 2021 and 23 November 2021 respectively, followed by a decrease in glacier surface temperature. This may be explained by the sudden change in glacier albedo (Azam and others, Reference Azam2014). Large areas of snowfall covering the whole glacier surface mean that the glacier albedo shifts from a low value to a high value as the ice surface changes to a snow surface. This reduces the amount of shortwave radiation absorbed by the glacier surface, which is normally the main source of heat for glaciers. As a result, the surface glacier surface temperature begins to decrease. In fact, the decrease in glacier surface temperature is slightly behind the snowfall event (Fig. 8), just as there is a lag between glacier surface temperature changes and air temperature changes that we have already described in section 3.2. So air temperature may still be the key role that ultimately controls such variation, because it controls the amount of rain versus snow received at the glacier surface, which in turn controls the albedo of the glacier and thus the change in glacier surface temperature.

Figure 8. Glacier surface temperature changes plotted on a 5 min scale and the photographed snowfall events. The red vertical line indicates the time of the snowfall event captured by the camera.
These records fill the lack of observations due to the difficulty in accessing the glacier field in winter and are crucial to our understanding of the seasonal characteristics of the Baishui River Glacier No.1. Moreover, the real-time comprehensive records facilitate seasonal characteristics of the glacier, and especially the impact of some events on it, such as snowfall events, which is not only reflected in the height of the laser ranger but are also photographed by the camera.
4.4 Advantages of the platform and planned work in the future
Most glacier monitoring techniques such as using optical very high resolution and synthetic aperture radar imagery from spaceborne platforms, photogrammetry from UAV and measuring traditional mass-balance stakes and snowpits in the field (Casagli and others, Reference Casagli2017; Che and others, Reference Che, Wang, Yi, Wei and Cai2020; Yan and others, Reference Yan2021b) are limited by the temporal resolution and accuracy of the data, and even require very heavy and laborious fieldwork. Our results illustrate the novelty and reliability of our platform in monitoring the glacier with significant advantages. Once the platform is installed, it could monitor the changes in various important parameters of the glacier automatically and return data in real time. The instruments on the platform are modular, thus additional sensors can be added according to the acquisition needs, and it is replenished by solar panel power, allowing for continuous long-term monitoring. This method allows for detailed information about glaciers compared to traditional field measurements or remote-sensing techniques and reduces repeated manual labor. Nevertheless, there are still some imperfections in the current monitoring: the platform will still need to be visited once a year for repairs, and, it only gives detailed information for one location on the glacier, whereas the glacier mass balance is spatially distributed. Hence, further work will be carried out.
Firstly, it is necessary to establish a glacier surface monitor network. The planned placement of the instruments varies according to the elevation gradient, both vertically and horizontally. This work is important because it contributes to our understanding of spatial characteristics of glacier change. In view of data transmission problems that may be caused by bad weather or weak signals, we have further designed data protection measures. Specifically, depending on the actual weather and communication environment at the monitoring point, the data will be transmitted back to the designated server in real time through 4G-DTU in the area covered by 4G signal. If there is no signal coverage in the monitoring area, the data will be transmitted back through Beidou short message module. The two data transmission modes can meet the needs of data transmission in any communication environment. In addition, a data transfer module with storage function is selected to automatically store all summary data to ensure that data will not be lost under extreme conditions. For example, 128 GB flash memory is configured in the wireless transmission device 4G-DTU and Beidou short message module. To provide a more stable power supply for the platform equipment, we have reoriented the solar panels in the latest platform layout so that they face south to maximize solar energy absorption and used more waterproof batteries. Finally, refining the temperature, humidity and pressure integrated sensor and adding a rain cylinder containing antifreeze on the platform is also the work we will consider.
5. Conclusion
The study of glacier seasonal change requires more accessible and effective observation tools to provide more continuous and detailed glacier information. Here we present an automated real-time monitor platform on the firn basin area of the Baishui River Glacier No.1, through which we measured the latest seasonal changes of the glacier, including the glacier movement, glacier surface temperature, glacier melting and snow accumulation processes. From September 2021 to April 2022, the platform moved northeastward by ~12.9 m with a rate of 0.06 ± 0.02 m d−1, while the elevation also decreased by ~2.4 m as the terrain changed during the movement. Glacier surface temperature of the Baishui River Glacier No.1 generally varied with air temperature, but its inter-seasonal variation is stronger. Specifically, the mean glacier surface temperature decreased 10.1°C from monsoon to post-monsoon and 4.6°C from post-monsoon to winter. During the monsoon, July and August were the main months of ablation for the glacier, while September was when ablation ceased. However, the Baishui River Glacier No.1 was in a more equilibrium state throughout the post-monsoon, with no significant ablation or accumulation overall, while obvious and rapid snow accumulation occurred in January of the winter season.
Compared with 2018, the ablation of the Baishui River Glacier No.1 in 2021 is weaker, which is manifested by slower glacier movement, smaller ablation rates and shorter ablation periods. No significant acceleration or deceleration of the horizontal velocities was found during our observational period, hence the seasonal mass balance of the Baishui River Glacier No.1 is principally determined by the surface mass balance. By analyzing the relationship between seasonal mean air temperature and mass balance at the platform point, we further highlight the response of the surface mass balance to changes in meteorological conditions. From monsoon to post-monsoon and from post-monsoon to winter, an average decrease of 1°C increased the point mass balance of the Baishui River Glacier No.1 by 0.11 and 0.22 m w.e., respectively. Moreover, we also found the impact of snowfall events on glacier surface temperature in conjunction with camera photos, i.e. snowfall causes the glacier surface conditions to change from ice to snow, which in turn leads to a decrease in glacier surface temperature, and air temperature is a driver of this process. Although these observational records are only representative of the glacier area in which the platform is located, they are still useful and important for understanding the current seasonal changes of the Baishui River Glacier No.1, and further long-time series analysis will be facilitated as the observation time of the platform increases.
Our study provides a new way into monitoring glaciers and new insights into the link between seasonal changes in glaciers and climate. The results demonstrate the reliability and novelty of the observational platform, which allow for more accurate and continuous monitoring of glacier changes than traditional methods, and reduce the workload and difficulty for field researchers. Further work is planned, for example, to install more observational platforms on the Baishui River Glacier No.1 to form a monitoring network, improve data transmission and protection measures and add sensors for monitoring meteorological parameters.
Acknowledgements
This study is funded by the National Natural Science Foundation of China (grant numbers 42076234, 42101135) and Science and Technology Research Project of Jiangxi Provincial Department of Education (No. GJJ2201708). We are grateful to the staff of the Yulong Snow Mountain Glacier and Environment Observation and Research Station for their help in setting up the platform.


 Open access