


1. Introduction
In recent decades, the governments of a number of developed countries have modified the parameters of their PAYGO pension system, without switching the financing mechanism toward the capitalization of social security contributions (OECD, 2016). These policies are equivalent to a selective restructuring of the existing implicit pension debt (Beltrametti, Reference Beltrametti1996; Holzman, Reference Holzman2004; Franco et al., Reference Franco, Zotteri and Marino2006). They are not neutral from a distributive point of view, as they reduce the internal rate of return of the pension program according to the retirement age, the date of birth, the productive category, gender, and to other demographic or economic characteristics of individuals belonging to the insured population. Palmer (Reference Palmer, Holzman and Palmer2006b) stresses also that they determine significant financial effects on the public budget, which also depend on the transition's design. Holzman (Reference Holzman2004) defines different concepts of pension liabilities and discusses measurement implications in an international context, while Kaier and Muller (Reference Kaier and Muller2015) document the size of the aggregate reduction of the implicit debt for policies that have revised pension rules in different countries over the past few decades, and show a significant effect on most of them.
Starting from 1996, the Italian social security system has gradually moved from a Defined Benefit (DB) to a Notional Defined Contribution (NDC) rule. In the theoretical literature, advocates of this approach highlight the capacity of NDC systems to link the internal rate of return of contributions to a financially sustainable value, thereby drastically reducing the tax passed on to future generations of workers or taxpayers and providing better incentives to economic agentsFootnote 1 (Kotlikoff, Reference Kotlikoff, Auerbach and Feldstein2004; Gronchi and Nisticò, Reference Gronchi, Nisticò, Holzman and Palmer2006; Palmer, Reference Palmer, Holzman and Palmer2006a; Settergreen and Mikula, Reference Settergreen, Mikula, Holzman and Palmer2006). However, moving to an NDC rule requires the design of a transitional phase, where the policymakers must choose between options, which have different redistributive and financial effects (Palmer, Reference Palmer, Holzman and Palmer2006b; Holzman and Jousten, Reference Holzman and Jousten2012). In order to explore the extent of these effects, it is crucial to distinguish how contributions paid in the past by individuals alive at the time of the reform's approval generate future pension rights. Palmer (Reference Palmer, Holzman and Palmer2006b) discusses two criteria: (i) acquired rights; (ii) contribution principle. According to the first criterion, the pension system recognizes the rights acquired under the old DB system. Consequently, future pension benefits of workers retiring during the transition phase will be a weighted average of the old and the new component. According to the second criterion, contributions paid under the old system should participate, together with current and future ones, in the accumulation of the notional capital used for the computation of the pension benefit according to the NDC rule.
While the first choice preserves the nature of the pension contract implicitly signed before the reform's approval, the second allows a faster transition and a more significant reduction of pension liabilities. Countries that have adopted an NDC system have followed different rules for their transitional paths (Palmer, Reference Palmer, Holzman and Palmer2006b). Among them, the Italian design is particularly generous toward workers already employed before the reform and, in general, it is inspired by a generous interpretation of the acquired rights principle (Franco and Sartor, Reference Franco, Sartor, Holzman and Palmer1998; Franco, Reference Franco, Feldstein and Siebert2002). This choice has undesirable financial implications since it exacerbates the length of the transition and the survival of a potentially unsustainable rule for many years.
The main aim of this paper is to investigate the financial and the distributive consequences deriving from the design of the transition to NDC in Italy. In fact, the analysis of the distributive and financial effects of the Italian transition was scarce. This paper tries to fill this gap. In the next subsection, we describe and discuss the Italian transition mechanism decided on in 1995 and subsequently modified in 2011. Then we introduce three different concepts of equity that are useful in assessing the fairness of the transition. The data of the empirical analysis were taken from three administrative archives of the Italian social security body, INPS. In the last part of the paper, we implement a procedure to evaluate the financial effects of the transition's design to NDC. We measure these effects in terms of extra pension liabilities consequent to the decision of limiting the pro-rata rule to young workers in 1995.
2. Three indicators to measure the distributive effects of the transition
The Italian Parliament introduced the NDC principle within the Italian pension system in 1995 (Law 335/95), applying a rather generous interpretation of acquired rights. The law divided workers into three different groups according to their seniority at work. Each group calculates old age pension benefits differently:
a. those entering the labor market after 1995 have their pension calculated in full according to the NDC standard;
b. those with fewer than 18 years of contributions in 1995 have their pension calculated according to a pro-rata formula in which only the contributions paid after 1995 accrue pension rights according to the NDC standard, while the former are considered in the context of the most generous DB rule;
c. those with more than 18 years of contributions in 1995 have their pension calculated according to a pro-rata formula in which only contributions paid after 2011 accrue pension rights according to the NDC standardFootnote 2, while the former are considered in the context of the most generous DB.
This political choice has had important consequences on the speed of the transition to the new regime. Workers who retired from 1996 onwards belong mainly to the third group and only to a small extent to the second one. The number of completely NDC pensioners is still negligible. Accordingly, the DB formula still decisively influences the current distributional characteristics of the Italian pension system. According to figures provided by the national pension body (INPS) in 2020, only 4.1% of current old age/seniority pensioners belong to the first group of individuals, i.e., those whose pension benefits are completely calculated under the NDC formula. At the same time, 12.8% of current pensioners belong to the second group and have their benefits calculated under the mixed formula, while the remaining 83.1% belong to the first group, the one substantially unaffected by the rule changes. With this empirical evidence in mind, we will study the following for the period 1995–2019:
(i) the yearly cross-sectional distribution of pension benefits;
(ii) the distribution of replacement rates, i.e., the ratio between an individual's first year pension benefit and their final earnings;
(iii) the distribution of Net Present Value Ratios, i.e., the ratio between the present value of pension benefits and the present value of social security contributions.
These three perspectives refer to different principles of equity during the transition from DB to NDC in Italy. By looking at the yearly cross-sectional distribution of pension benefits, we are able to test the distributional features of pension benefits in each single year. By measuring the distribution of replacement rates for new pensioners, we can assess the ability of the Italian pension system to maintain the living standard once the individual has retired from workingFootnote 3. Finally, by measuring the distribution of the Net Present Value Ratio for new pensioners, we analyze the intergenerational equity of the pension system.
We use the administrative data of the INPS archive. In particular, we restrict our analysis to the main Italian pension scheme, which covers private employees (Fondo Pensioni Lavoratori Dipendenti). Our choice has advantages and disadvantages. The administrative FPLD dataset is very reliable and provides almost complete information on the past earnings determining pension benefits. Moreover, the scheme still covers the relative majority of pensioners in Italy. On the other hand, we lose the possibility to obtain a complete description of distributive trends during the transition and are unable to analyze pension schemes that are, on average, more generous than the one analyzed. Unfortunately, data on the remaining Italian pension schemes are missing important information on the former occupational activities of pensioners, which significantly limits the potential of the analysis.
3. Data description
The INPS pension record contains information on all pension benefits provided from 1995 to 2019 by the Italian national social security scheme. In our research, we consider old age and seniority pension benefits of workers belonging to the main scheme for private employees (FPLD)Footnote 4. In order to have comparable measures of benefits in our dataset, we adjusted them for individuals who died or started to receive their pension during the course of a year. On average, this situation affects around 6% of our populationFootnote 5. Successively, we summed all old-age/seniority benefits belonging to a single individual and we removed from our sample pension benefits canceled for administrative reasons. We also removed observations where the amount of the yearly pension was under 100 Euros at 2019 rates. Finally, we excluded supplementary old-age pensions. After these adjustments, our sample contained more than 117 million observations. Table 1 shows the composition of the FPLD pensioner population for some years of the observed period.
Table 1. Composition of the FPLD pensioner population

Note: Old-age pensions correspond to benefits the payment of which accrues once the statutory retirement age is reached. Seniority pensions correspond to benefits for which payment accrues once a combination of age and years of contributions is fulfilled before the individual reaches the statutory retirement age. Early retirement corresponds to benefits earlier than the statutory retirement age thanks to agreements between employees and employers financially supported by the public budget.
Source: Data from the Archive of Pensioners (Casellario dei Pensionati), different years.
Table 1 describes both the composition of the FPLD old age/seniority pensioners' population and how it changes over time. The share of pensioners older than 75 has grown from 22.1% to 52.2%, while pensioners younger than 65 fell dramatically from 36.9% to 8%. Because of this rebalancing, the average age of pensioners has increased from 68.4 years to 75.4 years. Moving to seniority at retirement, it is worth noting that the share of pensioners retiring with more than 30 years' service was 36.4% in 1995, and has grown to 56.8% as of 2019. Old age pensions, the prevailing type of benefits in 1995, with a share of 73.0%, has decreased to 49.8% in 2019, while seniority pensions have grown from 19.4% in 1995 to 45.4% in 2019.
In summary, the data in the archive show that two important changes have taken place among FPLD pensioners. On the one hand, the analyzed population has aged significantly during the period under consideration. The reduction of mortality and the increase in the retirement age are the two main reasons able to explain such a trend. On the other hand, average seniority at retirement has also increased significantly.
Some data may be helpful to confirm these trends. According to Italian national statistics agency Istat data, the mortality rate at 65 years was equal to 14.7‰ in 1995; and had decreased to 7.8‰ by 2019. The average life expectancy at the same age was equal to 17.7 years in 1995; it had grown to 21.1 years by 2019. On average, the retirement age in the population of FPLD pensioners in 1995 was equal to 57.9 years in 1995. In 2019, the same figure was 59.0 years. On the other hand, the old DB system was maturing during the observed period. As for the average seniority at retirement, this was equal to 23.8 years in 1995, but reached 29 years in 2019Footnote 6. Furthermore, by looking at the share of benefits that gave rise to a social top up (integrazione al minimo), the share of these awards was 20.2% in 1995; it fell to 11.3% in 2019.
4. Cross-sectional distribution of old-age pension benefits
The value of the average FPLD pension benefit at constant prices increased by 47.6% from 1995 to 2019 as the Figure 1 shows. This is equivalent to a yearly real growth rate of 1.63%, a high value if compared with the growth rate of earnings, equal to 0.1% in the INPS archive of workers, during the same period. Because of this different dynamics, the ratio between the average pension benefit and the average wage has grown. It was equal to 54.8% in 1995; it became equal to 76.7% in 2019. Real growth of pension benefits was not, however, homogeneous among income groups: while percentiles in the rightmost part of the yearly distribution of pensions experienced a relatively sustained increase, the opposite is true for benefits situated in the left part. Interestingly, the pension benefits, which experienced the highest growth rate, were those in the central part of the distribution, even though the growth rate of higher percentiles were also above the mean.

Figure 1. Normalized values of old age pension benefits at constant 2019 prices for different percentiles of the pension benefits distribution.
Source: Author's elaborations on FPLD data in the Archive of Pensioners.
Figure 2 looks at changes to the distribution of pension benefits in greater detail. It gives, for each percentile of the pension distribution, the percentage change of the average value, measured at constant prices, which occurred from 1995 to 2019. Starting from the 40th percentile, the percentage changes are above the mean; the opposite is true for lower percentiles.

Figure 2. Percentage change in pension benefit, by all distribution percentiles. 2019 vs. 1995. All values in constant 2019 prices.
Source: Authors elaborations on the FPLD scheme data in the Archive of Pensioners.
Figure 3 reports the Gini index calculated on the yearly distribution of pension benefits from 1995 to 2019. Starting from a value of 33.2% in 1995, the Gini index increased continuously to a maximum value of 38.2% in 2011, remaining above 37% thereafter until the end of the observed period. The increasing value of the Gini index confirms the growing dispersion over time of pension benefits displayed by analysis of different percentiles presented in Figure 2.

Figure 3. Gini index for pension benefits. 1995–2019.
Source: Author's elaborations on FPLD data in the Archive of Pensioners.
Two mechanisms that are at work within the Italian pension system, higher seniority at retirement and lack of real indexation of pension benefits after the year 1992, are useful to explain the distributive trends described. Increasingly higher seniority at retirement has benefited pensioners who have retired more recently. Lack of indexation during the retirement period has increasingly penalized older pensioners while they age. Because of these two trends, we would therefore expect an increased dispersion along the age dimension of pension benefits. In order to assess the significance of these effects, Figure 4 breaks down the 2019 and the 1995 populations by age group and calculates the percentage change in the pension benefit during the period. While the growth rate of pension benefits was above the mean for pensioners under the age of 75, the opposite is true for older pensioners.

Figure 4. Percentage changes in pension benefits at different ages. 2019 vs. 1995. Values at constant 2019 prices.
Source: Author's elaborations on FPLD data in the Archive of Pensioners.
Figure 5 shows a breakdown of the Gini coefficient on pension benefits. We have divided the population of old-age/seniority pensioners into three age groups: under 65, 66 to 75, and over 75 years of age. In keeping with the previous results, this breakdown shows that inequality between groups increased almost threefold, especially in the first half of the observed period.

Figure 5. Gini decomposition of pension benefits. 1996–2019.
Source: Author's elaborations on FPLD data in the Archive of Pensioners.
5. Replacement rates distribution
The second indicator used in this study is the replacement rate, namely the ratio between the gross old age/seniority pension benefit received in the first year of retirement and the final gross pay. While this index is widely used to assess the adequacy of a pension scheme, its use does have some drawbacks, however. The replacement rate is an incomplete measure of adequacy since it gives an incomplete picture of disposable income before and after retirement (Alessie et al., Reference Alessie, Knoeff, Caminado, Geudswaard and Kalwij2014). Moreover, being a single-period index, the replacement rate at best approximates the adequacy of the pension system at the beginning of the retirement period. In fact, the replacement rate does not say anything about the ability of the pension system to maintain its adequacy over time, a topic much more related to the indexation rules adopted by the social security scheme. Another problem with the replacement rate has a more empirical basis: in a dataset of administrative data, final-year pay does not necessarily represent a reliable measure for the computation of the replacement rate. This may depend on the fact that the date of retirement occurs during the course of the year and/or on the possibility that the pensioner was unemployed and/or out of the labor force in the year before and after retirement. In all these cases, a raw measure of replacement rate can be misleading. In order to overcome this shortcoming, we define the replacement rate as the ratio between the first yearly annualized pension benefit and the yearly average value of positive earnings over the 5 years before retirement.
In order to obtain information on past wages of individuals who retired during the period of observation of our study, we linked the administrative record of old age/seniority pension benefits with the record of earnings. Through this procedure, we were able to obtain information on the past earnings situation of the large majority of workers who retired between 1995 and 2019. In particular, our population is composed of 2.93 million individuals. For each individual (i) of the selected population who retires in year (t), we define the replacement rate as:

where:
RRi ,t: is the replacement rate of an individual (i) retiring at time t = 1995, …., 2019;
Pi ,t: is the annualized value of the gross pension benefit of individual (i) in year (t);
Wi ,t−5: is the average value of annualized gross earnings of individual (i) in the 5 years preceding the year of retirement.
Figure 6 shows the distribution of replacement rates for the population of individuals who retired between 1996 and 2019. The very large majority of pensioners have reached a replacement rate in the range between 70% and 90%: this group constitutes 70% of the whole population analyzed. Only 17.8% of pensioners had a replacement rate below 70% and the remaining 12.2% had a replacement rate above 90%. Based on this measure, the degree of adequacy of the Italian FPLD pension scheme is very high both with respect to older pensioners and in international comparisons (OECD 2016).

Figure 6. Distribution of the replacement rate for workers retiring between 1996 and 2019. Source: Author's elaborations on FPLD data in the Archive of Pensioners. 2.93 million observations.
In the following Table 2, we compute the ‘average replacement rate’ for subgroups of the population. Each number in the table is the ratio of the sum of pension benefits and the sum of earnings before retirement calculated for the individuals in each group.
Table 2. Average value of the replacement rate by different categories of socio-economics groups

Data from the Archive of Pensioners (Casellario dei Pensionati) and from the Archive of Private ‘Dependent Workers’. 1995–2019. Replacement rate is the ratio between the annualized pension benefit in the first year of retirement and the average of last 5 years earnings of the same individual. Each value in the table is calculated as the sum of numerator divided by the sum of the denominator of the ratio.
Source: Author's elaborations on FPLD data in the Archive of Pensioners. 2.93 million observations.
While controlling by year of retirement and by gender does not significantly affect the average replacement rate, major differences emerge when looking at the retirement age. In this case, a clear inverse relationship arises from data, showing that a higher replacement rate is associated with a lower retirement ageFootnote 7. The average replacement rate increases with the number of years a worker contributes to the pension system. Seniority pensioners have a higher replacement rate with respect to old age pensioners. Finally, by dividing pre-retirement earnings into ten deciles, an inverse relation between the level of earnings and the replacement rate emerges. Different factors contribute in explaining this result. It is however important to notice that the first and the second decile are mainly composed of workers with a shorter contributive period and lower earnings. Most of them receive a top up transfer (integrazione al minimo) which in turn determines higher replacement rates. On the right part of the distribution, the decreasing value of the accrual in the DB formula is the main candidate in explaining the lower value for average replacement rate.
Figure 7 shows the calculation of the average replacement rate for each centile of the pre-retirement earnings distribution. It is interesting to note that, with the exception of the lowest and the highest part of the distribution, the levels of the average replacement rate are substantially constant. This depicts a pension system where the progressivity of the DB formula is concentrated only at the two extremes of the distribution of earnings.

Figure 7. Average replacement rate by centile of real wage before retirement. Workers retiring between 1996 and 2019. Source: Author's elaborations on FPLD data in the Archive of Pensioners. 2.93 million observations.
6. NPVR distribution
The third indicator used in the paper is the Net Present Value Ratio. The NDC philosophy rests on the idea that, in a completely phased-in pension system, equity requires a strict correspondence at the individual level between (the present value of) contributions paid during the working period and (the present value of) pension benefits received during retirement. A quick transition toward the NDC rule should allow a parallel fast convergence of the NPVR of new pensioners toward the long-term equilibrium value. This means that, if the discount rate used to compute the present value of pensions and benefits is equal to the internal rate of return of the pension plan for each cohort, NPVR in an NDC should always be equal to oneFootnote 8.
We define the NPVR for an individual (i) who retired at time (t) as:

The numerator and the denominator are, respectively, the present value of pension benefits and the present value of social security contributions that an individual expects to receive and to pay over their entire lifetime. More precisely in our dataset:


where:
aj and ai are the age of individual i when they started to work and when they retired, respectively;
Ei is the expected age of death when individual i retired;
r is a constant discount rate;
Pi ,k is the pension benefit of individual i at age k;
Ci ,k is the social security contribution rate of individual i at age k;
Yi ,k is the gross wage of individual i at age k.
The data used in previous subsections do not contain enough information on workers' past earnings. This negatively affects the possibility to track the lifetime profile of contributions. In order to overcome this difficulty, we use a different database, where information comes from a random extract from the INPS archive ‘Estratti Conto’. In particular, we selected from the entirety of INPS data a sample of 162,456 individuals not yet retired in 1995. For each individual in the sample, we have a complete set of information on contributions paid during their working lifetime. Once a worker in our sample retires in a year after 1995, we merge this unit with information on their pension benefits recorded in the pension record (Casellario dei pensionati). By considering the estimated value of the life expectancy available in the Istat archive for individuals distinguished by gender, year of birth, and age, we are able to calculate an estimated value both for equation (3) and equation (4). After controlling for discontinuities in the sample, we end up with a final sample of 98,250 observations. Figure 8 shows the distribution of the NPVR for this sample, where the discount rate is set at a value of 1.5%.

Figure 8. NPVR for individuals retiring from 1996 to 2019. Author's elaborations on FPLD data in the Archive of Pensioners. Discount rate at 1.5%. 162,456 observations.
The first important point to note is that the large majority of individuals, namely 92.6% in our sample, have an estimated NPVR >1. The histogram represents quite well the generosity of the Italian pension system during the transition to the NDC rule. A number of papers show that, once the NDC system is completely phased in, the estimated value of the NPVR will tend toward 1 or even lower values (Borella and Coda Moscarola, Reference Franco, Sartor, Holzman and Palmer2010; Maranoet al., Reference Marano, Mazzaferro and Morciano2012). The same works show that before the 1995 reform, NPVR was on average very similar to values estimated here: from this point of view, workers who retired during the transition can easily be equated to former DB pensioners. This means also that, from 1995 onwards, pension liabilities have increased. This in turn, giving the poor growth prospect of the Italian economy, put an additional burden on future generations and increasing intergenerational disparities between current and future retirees.
The relatively large share of the DB component in the formula used to calculate pension benefits during the transition period plays an important role in determining this result. It is, however, important to remember that before 1992, the contribution rate was lower with respect to the current value of 33% of gross wages. This adds further elements of advantage in the computation of the NPVR for workers in our sample. In order to check this hypothesis, we recomputed the NPVR on the basis that the contribution rate had always been equal to 33%. Figure 9 below compares the NPVR distribution in the base simulation against the constant 33% contribution rate hypothesis, allowing us to measure the role of this difference on the index of actuarial fairness used in the paper.

Figure 9. Sensitivity of NPVR to contribution rate.
Table 3 reports the average value of the NPVR controlling for subgroups of the population. The NPVR given in the table is calculated as the ratio between the sum of PVP and the sum of PVC over all individuals belonging to each subgroup.
Table 3. Average values for the NPVR, by different categories of socio-economic groups
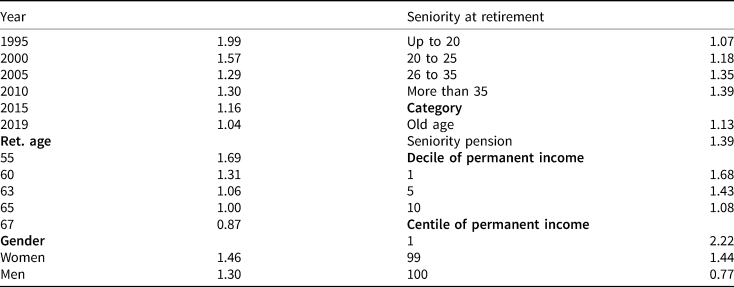
Author's elaborations from a random extract of active individuals in 1995 from the INPS archive (Estratti Conto). Number of observations: 98,250. Discount rate at 1.5%. 162,456 observations.
A differentiated picture emerges when looking at the results of the table above, even though for the large majority, the figures given in the table show that on average the present value of pension benefits is largely above the present value of contributions. As time passes, the NPVR displays a decreasing trend. Starting from an average value of 1.99, it finishes at an average of 1.04 for individuals retiring in 2019. This result is mainly due to the different shares of pension benefits computed under the more generous DB system and the average higher retirement age of individuals who have retired more recently. Retiring earlier has a significant impact on actuarial fairness: the estimated average NPVR is equal to 1.69 when the retirement age is 55. It decreases continuously, reaching the average value of 0.87 when the retirement age is 67. Again, the share of the DB pension benefit explains this result, since this computational rule pushes individuals to retire as soon as possible if the decision depends only on financial assessments. Women report, on average, a higher value for NPVR with respect to men. This is mainly because of their higher life expectancies at each age. The average NPVR increases with seniority at retirement. Seniority pensions reach higher values with respect to old age pensions. Usually they are paid earlier, considering the DB component in the pension benefit; this brings an advantage to the first group of individuals. Finally controlling for the position of individuals in the distribution of permanent income, defined as the present value of lifetime earnings and estimated from the same dataset, a progressivity structure emerges. As (lifetime) earnings increase, we saw that the DB formula becomes less generous and this determines the results shown in the table. On the other side of the distribution, the presence of a social assistance component in the pension benefit (integrazione al minimo, quattordicesima mensilità) explains the higher value for the NPVR.
Table 4 shows the sensitivity of NPVRs to different values of the discount rate. A discount rate of 1.5%, which is the one we used in our baseline, is consistent with the expected real growth rate of the Italian economy used by policymakers in the 1995's reform. Today's values for real expected growth are significantly below this value. We note from the results presented in the table that reducing the value of the discount rate increases the share of NPVRs that are above one. Lower discount rates are consistent with the idea that the economy, and therefore the implicit return that researchers should use when they search a ‘fair’ pension scheme, are also lower. Sharing this position, this would imply an even stronger intergenerational unbalance than the one emerging in our central scenario.
Table 4. Sensitivity of NPVR to the discount rate used to compute the present value of pensions and contributions
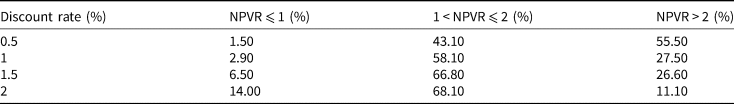
Author's elaborations from a random extract of active individuals in 1995 from the INPS archive (Estratti Conto). 162,456 observations.
7. Financial effects of the transition
Italy is the country, of those, which have moved their pension system toward an NDC formula that has chosen the slowest transition path (Franco and Sartor, Reference Franco, Sartor, Holzman and Palmer1998; Palmer, Reference Palmer, Holzman and Palmer2006a). The aim of this subsection is to estimate a measure of the consequent financial costs for the (intertemporal) public budget. Workers with an accrued seniority at work >18 years in 1995 are the biggest beneficiaries of the transition design. At the same time, they constitute the large majority of those who retired between 1996 and 2019. Their accrued pension rights are computed under the DB rule for the period 1996–2011. In order to estimate the financial costs of this choice, we recalculate these rights according to the NDC formula. This is equivalent to imposing a pro-rata rule for these individuals as well as for the remaining part of the employed population in 1995. We are aware that our financial estimation measures only the first-order effect. In particular, it is likely that, faced with a perspective reduction in the future level of pension benefits as a consequence of the adoption of a pro-rata rule, individuals may have reacted by modifying their retirement age. This in turn would have reduced the intertemporal gain of the DB component and would have raised the amount of pension benefit. Nevertheless, we think that such an approximation represents a first contribution to the measurement of the extra cost of the Italian transition.
We approximate the extra-amount of implicit liabilities created by the main Italian pension scheme, due to the transition design, starting from the difference between pension rights calculated according to the DB and NDC rule in the period 1996–2011 for those who retired during this period. The difference between these two variables is interpreted as a proxy of the yearly extra cost of the Italian transition's design. The left part of the Figure 10 shows the distribution of the yearly changes in the pension benefit that would have occurred with an application of the pro-rata rule to workers retired in the period 1996–2019. The right part of Figure 10 shows the distribution of the extra liabilities created by the very generous interpretation of acquired rights described at the beginning of the paper for workers with more than 18 years of contributions in 1995.

Figure 10. (a) Absolute amount of the reduction in the pension benefit deriving from the recalculation according to a pro-rata rule. 2019 Euro constant prices. Author's elaborations on FPLD data in the Archive of Pensioners. 2.93 million observations. (b) Absolute amount of the reduction in the pension debt deriving from the recalculation according to a pro-rata rule. 2019 Euro constant prices. Discount rate 1.5%. Author's elaborations on FPLD data in the Archive of Pensioners. 2.93 million observations.
The financial effects of the benefits recalculation in our exercise are increasing with time, as the number of years subject to the procedure of assignment of contributions to the NDC component increases. While at the beginning of the observed period, the reduction in benefits is negligible, it increases progressively up to an average reduction in the pension benefit of nearly 25% at the end of the period, in 2019. Figure 11 shows the yearly average cost of the transition design applied in Italy. The present value of these costs computed taking into account of the lifetime expectations of pensioners and applying a discount rate of 1.5% reaches an impressive amount of around 80 billion Euro or 5.5% of the Italian GDP.

Figure 11. Average yearly reduction in the pension benefits deriving from recalculation according to a pro-rata rule. Values at constant Euro 2019. Author's elaborations on FPLD data in the Archive of Pensioners. 2.93 million observations.
8. Conclusion
Moving the computation rule from a DB to an NDC one, while maintaining the PAYGO finance rule, has significant advantages both in efficiency and in redistributive terms. In particular, it makes the transition to the new pension system less painful for current generations since they will not pay a double burden, as in the case of the transition to a funded pension system. In spite of this, the design of the transitional phase is still crucial in order to determine the speed toward the new system and the burden's distribution of the selective restructuring of the implicit pension debt associated with the introduction of an actuarially fair system. No uniform evidence is available from the international experience of countries, which adopted an NDC formula within their pension system during the nineties.
Italian policymakers decided on a particularly generous transitional rule, especially with respect to individuals with more than 18 years of contributions in 1995. This choice, which is neither consistent with the ‘contribution principle’, nor with ‘acquired rights’ (Palmer, Reference Palmer, Holzman and Palmer2006b), was maintained up to 2011. This decision has had, and will continue to have, significant distributive and financial consequences. Using administrative data from different INPS archives, this paper tests the redistributive and the financial effects of this policy decision for the main Italian pension scheme (FPLD).
Two trends influenced the yearly distribution of pension benefits during the period 1996–2019. Workers who retired during this period benefitted from the generous DB rule and from longer seniority. As time passed, however, the lack of real indexation of pension benefits, coupled with the increasing proportion of older pensioners, led to a polarization along the age axis, increasing the disparity between pension benefits of older and younger pensioners.
Moving on to the adequacy of the system, the analysis shows that the large majority of pension benefits of workers who retired after 1995 have a replacement rate of between 70% and 90%. This is an unusually high value also in terms of international comparisons. Looking at the average value of the replacement rate, our estimations confirm the mild progressivity of the DB pension formula. The replacement rate has a positive correlation with seniority at retirement and with seniority pension benefits, while the correlation is negative with the retirement age and with the position in the distribution of pre-retirement earnings distribution.
The estimation of the NPVR distribution among workers retiring after 1995 shows that the concept of actuarial equity embedded in the NDC rule is still a chimera. Nearly all individuals who retired between 1996 and 2019 have an NPVR greater than one, meaning that they expect to receive in present value from the pension system more than they paid into it through social security contributions. This is due to the lower rate paid in the past for social security contributions and to the generous transition design. While the intertemporal advantage is common in the observed population, we find that the lower the retirement age and the higher the seniority at retirement, the higher this is. Unlike the replacement rate, the advantages increase with the year of retirement, while they decrease significantly with the distribution of permanent income.
Individuals' intertemporal gains are the other side of pension liabilities. By implementing a pension benefits recalculation process for individuals who retired under the main Italian pension scheme between 1996 and 2019, which brings the pension benefits closer to an actuarially fair value, we estimate that the decision to favor older workers in 1995 will cost 80 billion Euros in implicit pension liabilities. This amounts to 5.5% of the Italian Gdp.


 Open access