


In the last decade, an increasing number of countries around the world have implemented taxes on sweetened beverages(Reference Le Bodo, Etilé and Gagnon1). Attention for this measure can be related to the growing burden of nutrition-related chronic diseases and the scientific consensus regarding the detrimental effects of sweetened beverage consumption on multiple health outcomes: weight status and obesity(Reference Ruanpeng, Thongprayoon and Cheungpasitporn2,Reference Te Morenga, Mallard and Mann3) , diabetes(Reference Imamura, O’Connor and Ye4), non-alcoholic fatty liver disease(Reference Chhimwal, Patial and Padwad5), oral health(Reference Valenzuela, Waterhouse and Aggarwal6), cardiometabolic diseases and associated mortality(Reference Malik and Hu7). Scientists, health professionals and health organisations have called for implementing policies in order to decrease the consumption of sugar-sweetened beverages(8), ranging from public education, changes in the food environment including food labelling, restrictions on ads and specific taxation schemes(Reference Sinclair and Sing9).
In 2012, France became one of the first European countries to tax sweetened beverages (i.e. beverages containing either added sugar or an artificial sweetener) along with Finland, Hungary and Denmark. However, the newly implemented policy faced multiple challenges that may have limited its impact. The tax rate was flat and considered of low magnitude (0·076€ per litre), which is in contrast with recommendations from the WHO, which advocates for progressive taxation with taxation levels of at least 20 % of the final price(Reference Waqanivalu and Nederveen10). Although the government initially emphasised the health-related aspect of the measure, the focus was later changed to highlight the importance of the tax to balance the national public budget, which undermined the public health dimension of the measure(Reference Le Bodo, Etilé and Gagnon1).
In 2018, the French law was amended and several changes were made to the tax’s initial design. Its rate went from being flat to progressive, with a tier system depending on added sugar content (from 0·03€ to 0·24€ per litre). For a typical sugar-sweetened soda, this modification represented a substantial increase (for drinks with 12 g of added sugars per litre, the tax doubled). The revision also distinguished beverages sweetened with sugar from those sweetened with artificial sweeteners with the application of different tax rates depending on the type of sweetener used, unlike the first version of the tax. Lastly, advocates of the revised taxation scheme highlighted the public health dimension of the measure during the parliamentary debates. The measure was integrated into the 2018 Social Security Finance Bill, which is used to fund the French healthcare system, whereas the general Finance Bill was used for the 2012 version of the tax. A detailed comparison between the two versions of the tax is proposed in Supplemental Material 1. As a result, the tax was better aligned with its public health objectives following these modifications.
Although there is growing evidence of the overall effectiveness of sweetened beverage taxation to reduce consumption(Reference Niebylski, Redburn and Duhaney11,Reference Teng, Jones and Mizdrak12) , which is of importance when it comes to political decision-making, past research has also identified the key role of public acceptance in the design, the adoption and the implementation of such measures(Reference Wright, Smith and Hellowell13–Reference Diepeveen, Ling and Suhrcke15). More intrusive measures, such as taxes, are less accepted by the public than less intrusive ones (e.g. public education or labelling requirements), even though they tend to be more effective(Reference Diepeveen, Ling and Suhrcke15,Reference Mazzocchi, Cagnone and Bech-Larsen16) . Additionally, given the strong industry opposition(Reference Le Bodo, Paquette and Vallières17), it can be challenging to implement an adequately designed tax scheme. Favourable public opinion and acceptance are therefore critical to support such public health policies to modify health-related behaviours(Reference Burstein18).
Given modifications made to the French tax on sweetened beverages in 2018, perception and acceptance may have been impacted. We, therefore, investigated the knowledge, acceptance and perception of the tax on sweetened beverages in France after its revision in 2018. This study follows a previous study conducted after the initial implementation of the scheme in France in 2012(Reference Julia, Méjean and Vicari19). In addition, we explored individual characteristics that were associated with a favourable attitude regarding the tax on sweetened beverages.
Methods
Population
Participants were French volunteers – aged 18 years and older – who participate in the NutriNet-Santé Study, an online prospective, observational cohort which started in May 2009 and is still ongoing. The objectives of the NutriNet-Santé study are to investigate the associations between nutrition and health as well as to identify determinants of nutrition-related behaviours. Details regarding the design and the methods of the NutriNet-Santé study have been previously described(Reference Hercberg, Castetbon and Czernichow20).
Data collection
Tax knowledge, perception and acceptance
A questionnaire regarding knowledge, perception and acceptance of the tax on sweetened beverages was developed by a multidisciplinary research team based on a previous study conducted in 2012 pertaining to the first version of the French soda tax(Reference Julia, Méjean and Vicari19). The questionnaire was then administered to participants of the NutriNet-Santé cohort on a voluntary basis, from March 8th 2021 to June 28th 2021. Participants were informed by e-mail that a new questionnaire was available on the NutriNet-Santé platform. The title of the questionnaire and its introductory text were general on taxes and did not indicate to the participant that the questionnaire would focus on sweetened beverages. In addition, this online questionnaire was designed in such a way that the participant could not go back to modify his/her previous answers.
The first part of the questionnaire investigated the knowledge of respondents regarding the tax on sweetened beverages. Participants were first asked whether they knew about the existence of a specific tax on several products including both taxed and untaxed products (alcohol, tobacco, petrol, sweetened beverages – all of which have specific taxation systems; sugary foods (drinks were explicitly excluded), foods rich in fat, foods rich in salt, ultra-processed foods – all of which do not have specific taxation systems). Items were presented in random order. Participants could answer on a five-point Likert scale ranging from ‘Yes, for sure’ to ‘No, for sure’ and ‘I do not know’. Then, participants were informed that in 2018 the French law regulating the tax on sweetened beverages was amended and were asked about (1) the overall result of the revision process of the law in 2018, (2) products that are covered by the tax and (3) the design of the tax rate.
The perception and acceptance of the tax were then assessed through propositions to which participants could answer on a five-point Likert scale, from ‘strongly disagree’ to ‘strongly agree’, and ‘I do not know’. The following proposition was used to evaluate the overall acceptance of the tax: ‘I am in favour of taxing sodas and sweetened beverages’. Two additional propositions were added: ‘I am in favour of taxing sodas and sweetened beverages only if prices of healthy products go down (e.g. fresh produce)’ and ‘I am in favour of taxing sodas and sweetened beverages only if the revenue is used to improve our health system’. The perception of the potential impact of the tax on sweetened beverages was investigated with the following propositions: ‘A tax on sweetened beverages increases prices and reduces purchasing power’, ‘A tax on sweetened beverages is a useful measure to promote population health’, ‘A tax on sweetened beverages reduces the purchase of these products by the population in France’, ‘A tax on sweetened beverages increases the national budget (and/or reduces public debt)’ and ‘A tax on sweetened beverages is unfair because poor people will pay the same tax as rich people’. Items were presented in random order.
Finally, attitudes regarding sweetened beverages were collected with propositions regarding the impact on health: ‘Sweetened beverages are bad for your health’ or ‘Sweetened beverages are products of poor nutritional quality’; regarding the environment: ‘Producing sweetened beverages require a great quantity of pesticides’ or ‘Production of sweetened beverages consumes a significant amount of resources (water, arable soil)’. Answers were given with a five-point Likert scale, with items going from ‘strongly disagree’ to ‘strongly agree’, and ‘I do not know’.
Sweetened beverage consumption and evolutions
The questionnaire included a set of questions regarding the consumption of sugar-sweetened beverages, artificially sweetened beverages, fruit juices and the modification of the frequency of consumption in the last 12 months. Possible answers were the following: ‘strongly decreased’, ‘decreased’, ‘remained stable’, ‘increased’, ‘strongly increased’, ‘do not consume this kind of product’ and ‘do not know’. Participants were considered to be consumers of a given type of beverage if they reported a modification in consumption frequency (including ‘strongly decreased’, ‘decreased’, ‘remained stable’, ‘increased’ and ‘strongly increased’) and to be non-consumers if they reported not consuming that particular type of beverage.
Demographic and socio-economic data
Upon inclusion in the cohort, participants are asked to complete a set of five questionnaires regarding demographic and lifestyle characteristics, health status, dietary intake, physical activity and anthropometrics. These questionnaires are administered every 6 to 12 months during follow-up for an update.
The following data were retrieved for the present study: age, sex, educational level, household income, household composition including number and age of children living in the household, and weight and height of the respondent. As these questionnaires are repeated over time to update information regarding participants, we used data the closest from the time window of the study. Age was categorised into five groups: less than 30 years old, 30–45 years old, 45–55 years old, 55–65 years old and more than 65 years old. Educational level was categorised into three groups: no high school diploma, high school diploma and graduate degree. Income per consumption unit was calculated based on income and household composition, according to the definition provided by the National Institute of Statistics and Economic Studies (INSEE). The following categories of income were used: < 1300€, 1300€–2600€ and > 2600€/month/consumption unit. Household composition was categorised into four categories: no children, one or more children at home (aged 0–13 years), one or more adolescents at home (aged 14–18 years), and both children and adolescents at home. Finally, BMI was computed based on self-reported height and weight. It was categorised into four groups: < 18·5, 18·5–25, 25–30 and > 30 kg/m2. Self-reported anthropometrics in the NutriNet cohort can be considered valid, given that validity has been confirmed in the past after being compared with paper-anthropometrics questionnaires and face-to-face declarations.
Statistical analyses
Only fully completed and validated questionnaires were eligible for analysis. We excluded participants who did not live in mainland France or who had missing or incomplete demographic, socio-economic information or anthropometric data. Participants who systematically answered ‘I do not know’ to acceptance and tax knowledge questions were also excluded.
To allow better inferences on the general French population(Reference Andreeva, Salanave and Castetbon21), the final sample was weighted using the macro CALMAR and calibrated on the French population demographic and socio-economic structure, using data from the 2009 National Census from the National Institute of Statistics and Economic Studies (INSEE)(22). The following variables were used to adjust the sample: sex, age, educational level, occupation, region of residence, marital status and number of children.
Answers to perception and acceptance questions were grouped into three categories: ‘I disagree’, ‘I neither agree nor disagree’ and ‘I agree’.
Associations between tax acceptance and demographic variables were investigated with logistic regressions. Tax acceptance was modelled as a dependent variable, with the categories ‘I disagree’ grouped with ‘I neither agree nor disagree’ used as reference. Independent variables included in the model were the following: age, sex, educational level, income per consumption unit, household composition and BMI; sweetened beverage (sugar-sweetened and artificially sweetened distinguished) and fruit juice consumption; and items reflecting the attitude of the participant on sweetened beverages (one regarding health impact and one regarding the environmental impact). Participants declaring not knowing about their sweetened beverage consumption were excluded from the multivariable analysis.
We performed a sensitivity analysis for descriptive analyses on tax knowledge by conducting a similar analysis with only participants who knew about the existence of a specific tax on sweetened beverages (online Supplemental material 2).
Statistical analyses were conducted with SAS 9.4. All tests were two-sided and significance level was set at < 5 %.
Results
Study population
A total of 32 475 validated questionnaires were completed, and a total of 28 344 participants met the inclusion criteria (i.e. lived in mainland France, had no missing or incomplete information and did not answer systematically ‘I do not know’). For multivariable analyses, sample size was further reduced to 26 690 participants after exclusion of participants who answered ‘I do not know’ when asked if they were in favour of taxing sweetened beverages and those who did not report their sweetened beverages consumption. A detailed flowchart is proposed in Supplemental Material 3. Individual characteristics of included participants are presented in Table 1. Overall, our final sample was composed of 52·4 % women and 47·6 % men. Participants ranged in age from 18 to 85 years (mean = 52·5 + 13·8 years).
Table 1 Individual characteristics of included participants (n 28 344) (weighted data), NutriNet-Santé cohort, France, 2021

Tax awareness and knowledge
Overall, a majority of participants (63·4 %, Table 2) were aware of the existence of a tax on sodas and sweetened beverages. Other taxes, which have been enforced for a longer time and regularly covered by news media, such as tobacco, petrol and alcoholic drinks, showed higher levels of knowledge as expected, with between 86·6 % and 93·5 % of participants identifying that they were subject to specific taxes. By contrast, non-existent taxes were identified as existing taxes by a steady proportion of participants (from 26·6 % to 32·5 % of participants except for sugary foods, with 43·5 % of participants answering that this category was specifically taxed).
Table 2 Global knowledge of the existence of taxes in France among participants from the NutriNet-Santé cohort (n 28 344), France, 2021

* Items in italics correspond to categories of product that are specifically targeted by a taxation scheme.
When focusing more specifically on the tax on sweetened beverages, almost two participants out of three (63·3 %, Table 3) reported not knowing about the revision of the tax in 2018. Only 13·9 % of participants gave a correct answer regarding the result of the revision as it resulted in changes in the mode of calculation going from a flat-rate tax to a progressive tax based on added sugar content, thus modifying the amount of taxation on most products.
Table 3 Knowledge regarding the 2018 revision of the tax on sweetened beverages among participants from the NutriNet-Santé cohort (n 28 344), France, 2021
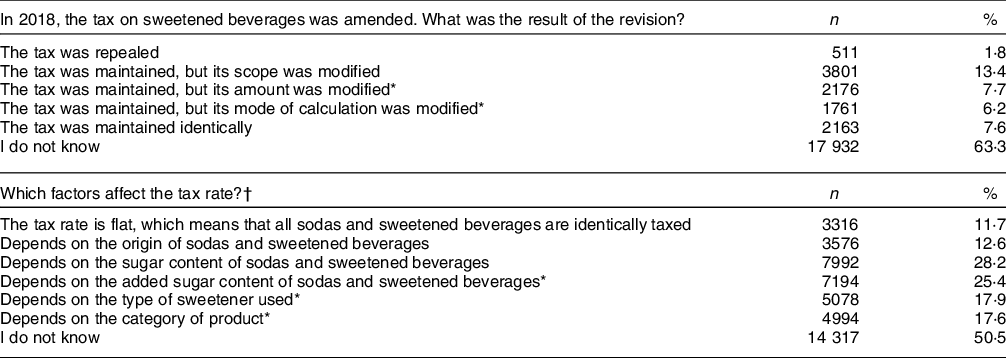
* Items in italics were considered to be correct answers.
† Several answers were possible for this question.
Similarly, half of the participants declared not knowing the specific calculation of the tax and factors which influence the level of taxation. Only a quarter of participants answered correctly that the tax was calculated based on the amount of sugar added to the beverage and less than a fifth, that the tax rate depended on the type of sweetener used or the category of the product.
When looking at the perceived scope of the tax (Table 4), sugar-sweetened sodas were the category of product the most identified as covered by the tax with 75·9 % of participants giving a correct answer. While also covered by the tax, beverages with artificial sweeteners were systematically less identified as being covered than their sugar-sweetened equivalents (respectively 61·0 % v. 75·9 % for sodas; 33·9 % v. 42·9 % for teas and infusions; 24·8 % v. 31·7 % for flavoured water). Regarding fruit juices, fresh fruit juices were correctly the least reported category as covered by the tax (15·9 %). However, results show that participants distinguished between fresh fruit juices and fruit juices obtained from concentrate (respectively 15·9 % v. 32·7 %), even though both products are not covered by the tax as they do not contain any added sugar unlike fruit nectars (35·3 %).
Table 4 Knowledge regarding the scope of the tax on sweetened beverages among participants from the NutriNet-Santé cohort (n 28 344), France, 2021
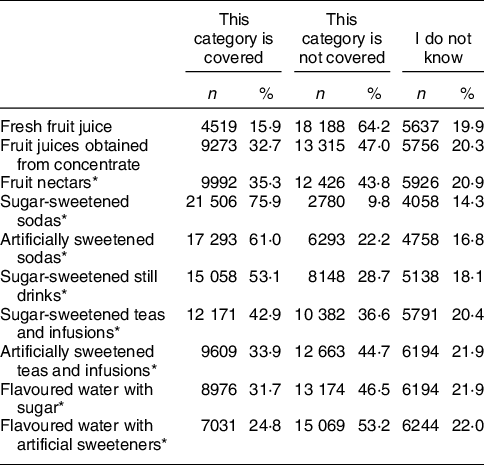
* Items in italics corresponds to categories targeted by the sweetened beverage tax.
Tax acceptance and perception
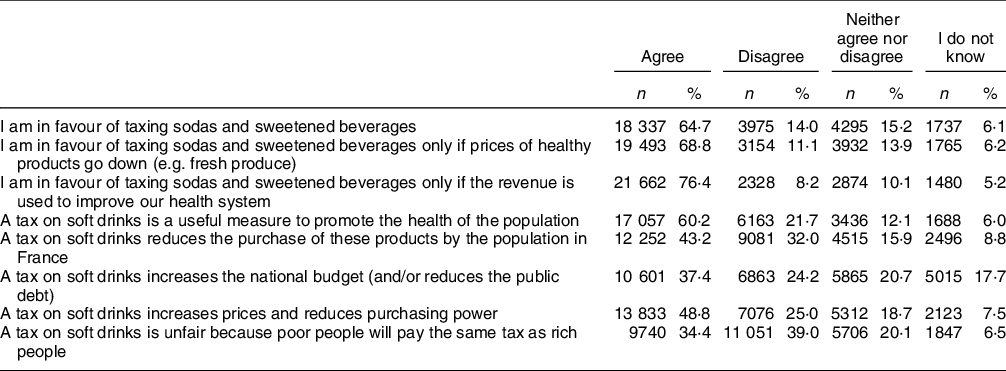
The tax on sweetened beverages was supported by a majority of participants (64·7 %. Table 5). The adhesion to the measure increased when tax revenues were proposed to be directly used to fund health-promoting initiatives (68·8 % for a reduction in prices of healthy products and 76·4 % for reinvesting the tax in the health system). Moreover, the tax was perceived as useful to promote the health of the population (60·2 %). By contrast, the only item with more opponents than supporters regarded the regressive nature of the tax and its unfairness (respectively 34·4 % who agreed v. 39·0 % who disagreed).
Table 5 Tax acceptance and perception among participants from the NutriNet-Santé cohort (n 28 344), France, 2021
Factors associated with tax acceptance
Multivariable analyses showed that tax acceptance varied among subgroups of the population (Table 6). Participants older than 45–55 years of age were more likely to hold a favourable position concerning the tax (OR = 1·14 (1·04, 1·25) for participants aged 55–65 years and OR = 1·38 (1·26, 1·52) for participants aged over 65 years v. 45–55 years; P < 0·001). Participants with higher household income and educational level were more likely to support the tax (respectively OR = 1·13 (1·04, 1·23) for participants with more than 2600€/month/CU v. 1300€–2600€/month/CU; P < 0·001; OR = 1·81 (1·70, 1·94) for participants holding a graduate degree v. those with a high school diploma; P < 0·001). Being a woman or the presence of one or more children less than 13 years was associated with less support for the tax (OR = 0·58 (0·55, 0·62) for women v. men; P < 0·001; OR = 0·85 (0·80, 0·92) for participants with one or more children v. those without children; P < 0·001). Participants with higher BMI were less likely to be in favour of the tax and by contrast, underweight participants were more likely to support the tax (OR = 1·33 (1·15, 1·54) for participants who are underweighted; OR = 0·87 (0·81, 0·93) for those who are overweighed; OR = 0·55 (0·51, 0·60) for those who are obese v. those of normal weight; P < 0·001). Consumers of sugar-sweetened sodas were less likely to support the tax scheme (OR = 0·57 (0·52, 0·61) for consumers v. non-consumers; P < 0·001), whereas consumers, respectively, of fruit juices and artificially sweetened sodas showed a similar level of adhesion when compared to non-consumers. Finally, having a negative attitude towards sweetened beverages, on either their health or environmental impact, was found to be associated with higher support of the tax (OR = 2·32 (2·11, 2·54) for participants with a negative attitude regarding the health impact v. those who do not have any attitude; P < 0·001; OR = 1·78 (1·67, 1·89) for participants with a negative attitude regarding the environmental impact v. those who do not have an attitude; P < 0·001).
Table 6 Multivariable analysis between tax acceptance, demographic and socio-economic characteristics and individual behaviours and attitudes towards sweetened beverages among participants from the NutriNet-Santé cohort (n 26 690), France, 2021

95 % CI, 95 % confidence interval; CU, consumption unit.
Results were obtained using a logistic regression model. All variables were included simultaneously in the model.
Discussion
Results presented in this study show the extent to which the French tax on sweetened beverages is known, perceived and supported by the French population in 2021, 3 years after its revision and 9 years after its initial implementation. Overall, a majority of respondents knew about the existence of the tax, although few of them had specific knowledge regarding the 2018 revision. The overall perception of the tax on sweetened beverages was favourable, particularly in regard to its ability to improve the health of the population. Support for the measure was high with almost two-thirds of respondents being in favour of it. Finally, multivariable analysis showed that support for the tax varied among subgroups of the population.
Overall, awareness of the tax on sweetened beverages among the population was high, with 63·4 % of respondents identifying the tax as existing, in line with the international literature on the subject. Several studies have focused on the awareness of similar taxes – one in the municipality of Berkeley (USA)(Reference Falbe, Thompson and Becker23), one in the municipality of Oakland and Berkeley (USA)(Reference Altman, Madsen and Schmidt24) and one in Mexico(Reference Álvarez-Sánchez, Contento and Jiménez-Aguilar25) – and have found mixed results (varying from 39 % in Oakland (immediately after its implementation), 65·2 % in Mexico (3 years after) to 68·2 % (1 year after), and 70 % (3 years after) in Berkeley). Local context plays an important role in making people aware of taxation schemes(Reference Claudy, Doyle and Marriott26), especially due to varying media coverage and communication campaign from public authorities or private actors. Additionally, one study(Reference Falbe, Thompson and Becker23) found that tax awareness increased over time, which may further explain the variability in results. Very high levels of awareness obtained for other taxes, such as taxes on petrol or tobacco, tend to be in line with these elements as these taxes have been enforced for a longer time and have been covered extensively by the media. In contrast, non-existing taxes were incorrectly cited by a substantial and steady proportion of the respondents (about 30 %). Nevertheless, achieving higher rates of awareness is of importance as tax policies have a ‘signalling effect’, which may contribute to raising consumers’ awareness about the health consequences of consuming the taxed products(Reference Barigozzi and Villeneuve27). In Mexico, this effect led to a greater reduction in sweetened beverage consumption in groups aware of the tax(Reference Álvarez-Sánchez, Contento and Jiménez-Aguilar25). Additionally, it appeared that in our study, respondents had poor knowledge of the modifications made in 2018 and also of the calculation method. However, given that the questionnaire was administered 3 years after the revision of the tax and that specific knowledge questions required to be aware of technical details, it is not surprising that very few participants were able to answer correctly to these items. Furthermore, the French government, during the 2018 parliamentary debates, made clear that the main purpose of the revision of the tax was to incentivise food manufacturers to reformulate their recipes and thus reduce the sugar content in sodas. In this regard, the use of a progressive tax rate was indeed adequate as the lower the sugar content is, the lower the tax rate will be. Since consumer behaviour was not directly targeted with this revision, the lack of specific knowledge should not be regarded as a limit.
The perceived scope of the tax provided interesting insights into the different perceptions of beverage categories. For drinks containing added sugar (with the exception of fruit nectars), we observed a gradient according to the added sugar content with products containing the highest added sugar content (sodas and to a lesser extent still drinks) being the most reported as covered by the tax. These perceptions suggest that products with the greatest added sugar content were more frequently identified as sweetened beverages and thus are covered by the tax, whereas products such as flavoured waters or teas which contain in comparison less sugar were less often considered to be part of the scope of the tax. Interestingly, artificially sweetened beverages were identified as covered by the tax in somewhat similar proportions than sugary beverages. This result suggests that artificial sweeteners are perceived by a majority of the public in beverages as having somewhat similar effects as sugar, even though international recommendations mainly focus on the reduction of sugar-sweetened beverage consumption according to nutritional criteria(8). Finally, fruit-based beverages, and especially fresh fruit juices, were among the less identified as being targeted by the tax as they tend to be considered as healthy(Reference Coelho28). Remarkably, fresh fruit juices and fruit juices from concentrates appeared with differing perceptions, while neither are targeted by the taxation scheme.
Public support for the taxation scheme in this study was relatively high when compared with previously reported data. A French study performed in 2015 in the NutriNet-Santé cohort found that 48·5 % of the population was in favour of the tax implementation following the launch of the tax in 2012(Reference Julia, Méjean and Vicari19). More globally, a recent systematic review(Reference Eykelenboom, van Stralen and Olthof14) found an overall 42 % (CI 95 % = 39 %, 47 %) of the public supporting the implementation of a tax on sugar-sweetened beverages with great disparities between studies/countries (ranging from 27 % to 55 % of public acceptance). However, as pointed out by the authors, most studies were conducted in the USA, Australia and in the UK, which may make difficult to extrapolate these results to others countries as local context is of importance. In addition, very few studies in the systematic review were conducted after the implementation of a tax which may further make our results difficult to compare. Consistently with the body of literature, our findings also indicate that allocating tax revenues to specific health-promoting initiatives impacted positively the acceptance of the taxation scheme(Reference Eykelenboom, van Stralen and Olthof14). Unlike other jurisdictions which already implemented a tax on sweetened beverages(Reference Hagenaars, Jeurissen and Klazinga29), tax revenues of the French version of the tax are not dedicated to specific actions but rather to the overall healthcare system. In this regard, the French public health agency – HCSP – recommended using tax revenues to create targeted measures to incentivise consumers (e.g. through coupons or direct help) and food manufacturers (e.g. through subsidies) to adopt more sustainable practices(30). Additionally, our results indicate a clear rise in acceptance over time which has been supported by changes in perception. When comparing with the 2015 French study, we observed a slight increase in the proportion of the population who perceived the measure as useful (57·7 % in 2015 v. 60·2 % in 2021) and an important decrease in the proportion of the population who qualified the tax as unfair (49·3 % in 2015 v. 34·4 % in 2021). Perceived effectiveness and perceived fairness have been found to be positively associated with public acceptance(Reference Gunarathne, Spiller and Risius31). The 2018 revision of the tax appeared to be an opportunity for the government to reframe the policy as a public health measure, and these changes may have further led to an increase in acceptance(Reference Le Bodo, Etile and Julia32).
The policy development and media coverage of the tax on sweetened beverages may have also played a role in its perception. Indeed, the literature suggests that the social acceptance of taxes, such as soda taxes, is influenced by public debate and the political context. For example, in the UK, the soft drink industry levy – among other measures – gained traction as the ‘Responsibility Deal’ was found inadequate to solve nutritional issues(Reference Elliott-Green, Hyseni and Lloyd-Williams33). In France, although the 2012 version of the tax was adopted after fierce parliamentary debates(Reference Le Bodo, Etilé and Gagnon1) and other nutritional policies are continuously considered(34), the implementation of food taxes continued to arouse the interest of stakeholders as shown by several parliamentary reports(Reference Le Bodo, Etile and Julia32). It should also be noted that when the bill was voted in 2017, the vote of the members of parliament was rather consensual and several factors may have played a role. First, this revision was an opportunity to clearly reframe the policy as a public health measure(Reference Le Bodo, Etile and Julia32). Then, in 2016, in the framework of the revision of national food-based dietary guidelines, the French National Agency for Food Safety published reports underlining the association between sugar-sweetened beverages consumption with weight gain and comorbidities(35). Finally, analyses showed that in 2017 media coverage was less intense and more favourable towards the measure when compared with the extensive coverage in 2011(Reference Le Bodo36). Private stakeholders, including the beverage industry, appeared to not be as opposed to a revision of the tax(Reference Le Bodo, Etile and Julia32), which may have contributed to a less heated debate. These elements may further contribute to explain the rise in acceptance and the overall better perception of the tax observed in the study.
The associations between tax acceptance and demographic characteristics highlighted disparities among subgroups of the population. We found that being a man increased the likelihood of supporting the taxation scheme. This result is surprising as numerous previous research suggested that there was no association with sex(Reference Eykelenboom, van Stralen and Olthof37–Reference Petrescu, Hollands and Couturier40). However, despite the lack of association reported in the past study conducted in the NutriNet-Santé cohort study in 2015(Reference Julia, Méjean and Vicari19), in univariate analysis, men were found to be significantly more prone to be in favour of the taxation scheme. Thus, the observed effect may be caused by residual confounding and it needs to be further explored in other studies on the French population. Then, the odds of supporting the tax were greater for respondents older than 45–55 years of age and lower for respondents younger than 45–55 years of age when compared with respondents aged 45–55 y/o. This could be interpreted by the fact that older individuals tend to be more health-conscious(Reference Kearney, Gibney and Livingstone41) and thus would be more supportive of health prevention initiatives or by the fact that they tend to consume less sweetened beverages(42) or have greater financial resources(43) and thus would feel less affected by this kind of measure than younger individuals. Lastly, having at least one or more young children at home was associated with less acceptance of the tax, which was already highlighted in the previous study in the NutriNet-Santé cohort(Reference Julia, Méjean and Vicari19). However, in the Netherlands, among a representative sample of the Dutch population, no significant association between tax acceptance and household composition was found(Reference Eykelenboom, van Stralen and Olthof37). An explanation of these results could be that parents of young children engage less in health-promoting behaviours. Indeed, studies found that young parents (between 25 and 44 years old) spent less time doing physical activity(Reference Corder, Winpenny and Foubister44,Reference Pot and Keizer45) . For diet, results are mixed with studies finding higher energy and saturated fat intake as well as higher BMI(Reference Corder, Winpenny and Foubister44,Reference Rattay and von der Lippe46) in young parents v. non-parents and other studies finding no significant differences(Reference Laroche, Wallace and Snetselaar47,Reference Smith, McNaughton and Gall48) . Finally, older parents (over 45 years old) appeared to engage more in behaviours favourable to health(Reference Rattay and von der Lippe46), which could explain why parents of adolescents in the study, which were on average older, were as likely as individuals without children to support the tax scheme, unlike younger parents. However, this hypothesis needs to be further explored as intended health behaviours may differ widely from actual behaviour, and both may interact in the acceptance of public health policies such as taxation.
Socio-economic variables also appeared to be important factors associated with tax support. Adults with a higher level of education were found to be more likely to be in favour of the tax scheme. It has been reported consistently in past research that taxes on sweetened beverages are more heavily supported by individuals with higher educational level(Reference Julia, Méjean and Vicari19,Reference Eykelenboom, van Stralen and Olthof37,Reference Miller, Dono and Wakefield38,Reference Gollust, Barry and Niederdeppe49) . An explanation may be that education is associated with a higher level of nutrition knowledge(Reference De Vriendt, Matthys and Verbeke50) and thus awareness of nutritional-related health issues. Additionally, greater income was associated with a higher level of support. Individuals with greater disposable resources were found to be less sensitive to price increases(Reference Muhammad, Meade and Marquardt51), whereas others may fear a reduction in their purchasing power with the implementation of new taxes. In turn, people who were overweight or obese tended to be less supportive of the tax than those with a BMI between 18 and 25 kg/m². Current body of literature has found inconsistent results with studies reporting no associations between weight status and tax acceptance(Reference Petrescu, Hollands and Couturier40,Reference Gollust, Barry and Niederdeppe49,Reference Sainsbury, Hendy and Magnusson52) and other studies showing the decreased likelihood of support for overweight or obese people(Reference Eykelenboom, van Stralen and Olthof37,Reference Rivard, Smith and McCann53) . Lower support for individuals with higher BMI observed in the study could be partly explained by the fact that the consumption was only assessed through a qualitative aspect. In other words, we did not make a distinction between low and high consumers, and BMI could have been a proxy for this dimension. A systemic assessment of beverage consumption in the world found that greater BMI was associated with greater sugar-sweetened beverage consumption(Reference Singh, Micha and Khatibzadeh54). All other things being equal, individuals with greater BMI would be more financially affected by the tax and thus potentially less supportive of the measure.
Consumption of sugar-sweetened sodas was found to be associated with less support for the tax. On the other hand, no significant effects were detected for artificially sweetened beverages or fruit juice consumption. Regarding the association between sugar-sweetened soda consumption and tax acceptance, several studies have identified a similar effect(Reference Eykelenboom, van Stralen and Olthof37,Reference Donaldson, Cohen and Rutkow55,Reference Richardson, Yanada and Watters56) even though in the 2015 study in France, only sociodemographic factors played a role in tax acceptance. Artificially sweetened beverage and fruit juice consumption was rarely explored in the past as potential factors influencing tax support. As expected, individuals with a negative attitude towards sweetened beverages whether in regard to health or the environment were more favourable to a taxation scheme. The importance of personal opinion and perceived detrimental effects especially on health have been consistently shown in previous studies(Reference Miller, Dono and Wakefield38,Reference Pell, Penney and Hammond39) . This finding reinforces the importance of public campaigns to raise awareness regarding the impact of consuming sugar-sweetened beverages, especially in regard to health, as these factors were found to have a higher OR than demographic or socio-economic determinants.
To our knowledge, this study is the first to explore public acceptance and perception since the 2015 study in the NutriNet-Santé cohort in a country that has already been enforcing a tax on sweetened beverages. In addition, we explored multiple dimensions (i.e. awareness, knowledge, perception and acceptance) which allowed us to identify important stakes when advocating in favour of a food tax. Several limitations should also be acknowledged. Given that the questionnaire was available for a limited amount of time (4 months) and that answering the questionnaire was optional, we aimed to collect at least 30 000 questionnaires before closing access. This procedure selected the more active members of the cohort, considering that the cohort is already voluntary. Thus, respondents were more likely to have a higher socio-economic status and educational level and to engage in health-conscious behaviours than the general population. In addition, to assess the representativeness of the final weighted sample, we compared sodas and juices consumption in the study with the national representative consumption study INCA 3(42). According to INCA 3, 41·1 % of the population consumed non-alcoholic soft drinks in 2017 which includes any sugar-sweetened beverages except fruit juices (v. 31·2 % for equivalent products in our study (weighted data)), and 50·3 % consumed fruit juices (v. 52·2 % in our study (weighted data)). Furthermore, the questionnaire was administered 3 years after the tax revision. Knowledge and perception may have been altered over time. Finally, as respondents were more likely to be aware of nutritional issues, answers may have been subject to social desirability bias, and we may have overestimated tax acceptance. Another concern might be that a self-reported online questionnaire with knowledge items could incentivise respondents to search for the correct answer on the Internet. However, we observed very high percentages of non-correct answers in questions regarding knowledge, which suggest that respondents answered spontaneously, as expressly asked by the instructions. We further limited the possibility of correction of wrong answers by preventing returns to previous questions.
Conclusion
In conclusion, the French tax on sweetened beverages appeared to be supported by almost two-thirds of the public. In accordance with a recent meta-analysis(Reference Eykelenboom, van Stralen and Olthof14), our results tend to confirm the elements of success of the 2018 revision of the French soda tax in regard to its impact on public acceptance, as (i) revenues were used to fund health-related measures rather than the general budget and (ii) the true purpose of the tax was clearly communicated. Overall, the tax was more heavily supported by subgroups of the population that were less affected by the measure (i.e. subgroups with greater financial resources, with fewer consumption of sugar-sweetened beverages and with greater awareness of the impact of consuming covered products). Such elements are of interest when developing and implementing novel public health measures, especially food taxes which tend to be less accepted by the public.
Acknowledgements
Acknowledgements: The authors also thank the following individuals for their technical contribution to the NutriNet-Santé cohort: Thi Hong Van Duong, Régis Gatibelza, Jagatjit Mohinder and Aladi Timera (computer scientists); Fabien Szabo de Edelenyi, PhD (data management supervisor); Nathalie Arnault, Julien Allegre and Laurent Bourhis (data managers/statisticians); Cédric Agaesse (dietitian); Younes Esseddik (IT supervisor); and Nathalie Druesne-Pecollo, (operational coordinator). Finally, the authors thank all volunteers in the NutriNet-Santé cohort. Financial support: The NutriNet-Santé study is supported by the French Ministry of Solidarity and Health, the National Agency for Public Health (Santé Publique France), the National Institute for Health and Medical Research (INSERM), the National Research Institute for Agriculture, Food and Environment (INRAE), the National Conservatory of Arts and Crafts (CNAM), the Centre for Epidemiological Research and Statistics (CRESS), and Sorbonne Paris Nord University. In addition, this study is part of the Soda-Tax research project (2019–2023), co-funded by the French League against cancer (Convention n° RI/Fj/02) through the 2018 General Grant Cycle of the prevention and health promotion section of the Institute for Public Health Research (IReSP) (LI-JABOT-AAP18-PREV-006). The funders had no role: in the design of the study; in the collection, analyses, or interpretation of data; in the writing of the manuscript, or in the decision to publish the results. Authorship: All researchers had access to all the data. B.S. wrote the statistical analysis plan, analysed and interpreted the data, drafted, and revised the paper. He is the guarantor. C.J. developed the questionnaire, supervised data analysis, contributed to data interpretation and revised the paper for important intellectual content. C.D., E.C., S.P., Y.L.B. and M.T. developed the questionnaire, contributed to data interpretation and critically revised the paper for important intellectual content. S.H. designed the data collection tools, monitored data collection for the whole study, contributed to data interpretation and critically revised the paper for important intellectual content. All authors approved the final version of the manuscript. Ethics of human subject participation: The NutriNet-Santé study is conducted in accordance with the Declaration of Helsinki, and all procedures were approved by the Institutional Review Board of the French Institute for Health and Medical Research (IRB Inserm 94 0000388FWA00005831) and the Commission Nationale de l’Informatique et des Libertés (CNIL 95 908450 and 909216). The protocol is registered at clinicaltrials.gov as NCT03335644. All participants provided informed consent with an electronic signature.
Conflict of interest:
There are no conflicts of interest.
Supplementary material
For supplementary material/s referred to in this article, please visit https://doi.org/10.1017/S1368980022001665


 Open access