A global economic crisis broke out following a food crisis in 2008. Based on a report from the FAO, the number of people suffering from starvation reached over 1 billion globally( 1 , 2 ). It is estimated that the rate of malnutrition declined in the 1990s, but the trends reversed in 2008 with 642 million people suffering from poor nutrition in Asia( Reference Chen, He and Wang 3 ). Children can be particularly vulnerable to economic crises because they are more susceptible to undernourishment as a result of increasing prices, scarcity of food and reduced household income( Reference Darnton-Hill and Cogill 4 ). Malnutrition can put children at higher risk of infectious diseases, as well as lead to adverse pregnancy outcomes such as maternal mortality, delivery complications, preterm birth and intra-uterine growth retardation( Reference Han, Mulla and Beyene 5 , Reference Black, Victora and Walker 6 ).
The WHO estimated that the global prevalence of underweight, wasting and stunting was respectively 15·7 % (101 million), 8·0 % (52 million) and 25·7 % (165 million) for children aged <5 years in 2011 using 639 national surveys from 142 countries( Reference Black, Victora and Walker 6 , Reference de Onis, Blossner and Borghi 7 ). Jaacks et al.( Reference Jaacks, Slining and Popkin 8 ) found that the highest prevalence of underweight occurred in Asia, with an annual increase of 0·66 % in rural areas in South Asia, using national data collected from fifty-three low- and middle-income countries. In China, malnutrition in children aged <5 years has always been higher in rural areas due to lower socio-economic status (SES) in rural areas( Reference Yu, Zhao and Yang 9 ). However, globally not all countries display the same patterns and some such as the USA, Brazil and Russia have a different pattern with a higher burden in urban areas( Reference Wang, Monteiro and Popkin 10 ).
Recent changes in the urban–rural disparity in childhood malnutrition in China at national and subnational levels have not been reported to date, especially since the 2008 global economic crisis. Analysing the subnational distribution and reporting the changes in childhood malnutrition over time may help to identify variation in at-risk groups within the provinces.
Compared with children aged <5 years, few studies of malnutrition in primary-school children are available. The nutritional status of children of primary-school age is important as it directly affects their physical fitness and health during and after puberty( Reference Marcovecchio and Chiarelli 11 ). Due to the Chinese policy of nine years of compulsory education (usually from age 7 to 16 years), all children aged 7–12 years are in primary schools, which provides an environment where nutritional status may be more amenable to policy intervention( Reference Amini, Djazayery and Majdzadeh 12 – Reference Chada, Prusa and Bronsky 14 ). The present study uses the 2014 and 2010 data from the Chinese National Survey on Students’ Constitution and Health (CNSSCH), two nationally representative cross-sectional surveys completed post the economic crisis.
The objectives of our study were to: (i) assess the recent changes in malnutrition, including stunting and wasting, among primary-school-aged children at ages 7 to 12 years; (ii) assess the changes in urban–rural disparity from 2010 to 2014; and (iii) estimate subnational geographic variation for urban–rural disparity in the prevalence of stunting, wasting and malnutrition during the post-crisis period.
Methods
Participants
Data were obtained from the 2010 and 2014 CNSSCH, the largest nationally representative survey of school-aged children designed to investigate their health status in China. The CNSSCH included the thirty-one mainland provinces and excluded Hong Kong, Macao and Taiwan. Data were collected from the Han ethnicity group in all provinces except Tibet where the Han ethnic group is a minority, so data were collected from Tibetan children only in Tibet. The participants were primary-school students aged between 7 and 12 years. The sampling procedures have previously been described in detail elsewhere( Reference Ji and Chen 15 ). Briefly, in each province, a multistage, stratified, random cluster sampling was conducted to select participants and yielded equal numbers at three SES groups or prefecture-level cities (i.e. upper, moderate, low) within each province, defined by regional gross domestic product, total yearly income per capita, average food consumption per capita, natural growth rate of population and the regional social welfare index. First, the primary schools with children aged 7–12 years were randomly selected in each prefecture-level city within provinces. Then, grades and classes were selected randomly in the schools. Data were collected within the same schools in 2010 and 2014. This procedure was used to select both the urban and rural schools, except in Tibet where only urban Tibetan children in Lasa were surveyed for feasibility reasons. Participants were involved in the study if they and their parents had lived in the local areas for longer than 1 year. All eligible participants underwent a medical examination before data collection to ensure that they had no other overt physical or mental disorders.
Our sample for these analyses included 107 741 children in 2010 and 107 473 children in 2014, Five hundred and seventy-five (286 in 2010 and 289 in 2014) participants with missing data on weight and height were excluded from our analyses. The surveys were conducted according to the Declaration of Helsinki guidelines and were approved by six ministries within China, including the Ministry of Education, the General Administration of Sport, the Ministry of Health, the State Ethnic Affairs Commission, the Ministry of Science and Technology, and the Ministry of Finance.
Measures and definition
Height and weight were measured to the nearest 0·1 cm and 0·1 kg with a portable wall-mounted stadiometer and standardized scale, respectively, taking the mean values of three measurements, using a protocol from the 2006 WHO Child Growth Standards( 16 ). Measurements were conducted by a team of trained field professionals who were required to pass a training course in anthropometric measurements. Participants were required to wear only light clothing and stand straight, barefoot and at ease while being measured. All measurement instruments were calibrated before use and standardized instruments were used for the measurements at all survey sites.
The definition of stunting, wasting and malnutrition followed the national screening standard for malnutrition in Chinese school-aged children and adolescents (WS/T456-2014)( 17 ), which is based on the age- and sex-specific BMI and the height reference standard for Chinese children. BMI (kg/m2) was calculated as body weight (in kilograms) divided by the square of height (in metres). Wasting was defined as BMI less than age- and sex-specific percentiles, whereas stunting was defined as height less than the corresponding age- and sex-specific percentiles. Malnutrition was defined as either stunting or wasting for each individual child. The thirty-one mainland Chinese provinces were analysed in our study and were divided into three regions, East, Central and West, according to the geographical standard division from the Chinese National Bureau of Statistics( 18 ). The geographical standard division and sample size for 2010 and 2014 in each province are presented in the online supplementary material, Fig. S1. The classification of urban and rural for these surveys was defined in 1985, so some rural areas may have experienced urbanization but still been classified as rural. The possible impact of urbanization on the survey data has been previously evaluated and suggested no effect on the analysis( Reference Song, Ma and Wang 19 ).
Statistical analysis
We have summarized prevalence estimates for stunting, wasting and malnutrition in 2010 and 2014 by urban and rural areas. Continuous (anthropometric) and categorical variables were compared between the survey years of 2010 and 2014 using t tests and χ 2 tests, respectively. The geographical distribution of stunting, wasting and malnutrition was compared for the provinces (excluding Hong Kong, Macau and Taiwan) between urban and rural areas using Spmap in Stata. The prevalence gap between urban and rural areas (defined for this purpose as the prevalence in a rural area minus the prevalence in an urban area in the same province) at the provincial level for the two survey years has been presented using descriptive statistics. Logistic regression was used to estimate the prevalence odds ratio (POR) for stunting, wasting and malnutrition in rural v. urban data adjusted for age, sex and province-level SES status and to assess urban–rural disparities between the two survey years. The same calculation of POR was also conducted for the East, Central and West regions of China. All analyses were performed using the statistical software package Stata version 12.0. Two-sided P<0·05 was considered significant.
Results
Characteristics of the study sample
As shown in Table 1, a total of 215 214 (107 741 in 2010 and 107 473 in 2014) Chinese children participated in the study. The distributions for sex, age and urban/rural children between the two survey years were quite similar. The prevalence of stunting, wasting and malnutrition was 1·9 (95 % CI 1·8, 2·0) %, 12·3 (95 % CI 12·1, 12·5) % and 13·7 (95 % CI 13·5, 13·9) %, respectively, in 2010, which decreased to 1·0 (95 % CI 0·9, 1·1) %, 9·4 (95 % CI 9·3, 9·6) % and 10·2 (95 % CI 10·0, 10·4) %, respectively, in 2014.
Table 1 Basic information of the 7- to 12-year-old Chinese children included in the Chinese National Survey on Students’ Constitution and Health in 2010 and 2014

* The χ 2 test and the t test were used to compare categorical and continuous variables between survey years of 2010 and 2014, respectively.
Urban–rural disparity in stunting, wasting and malnutrition by age group
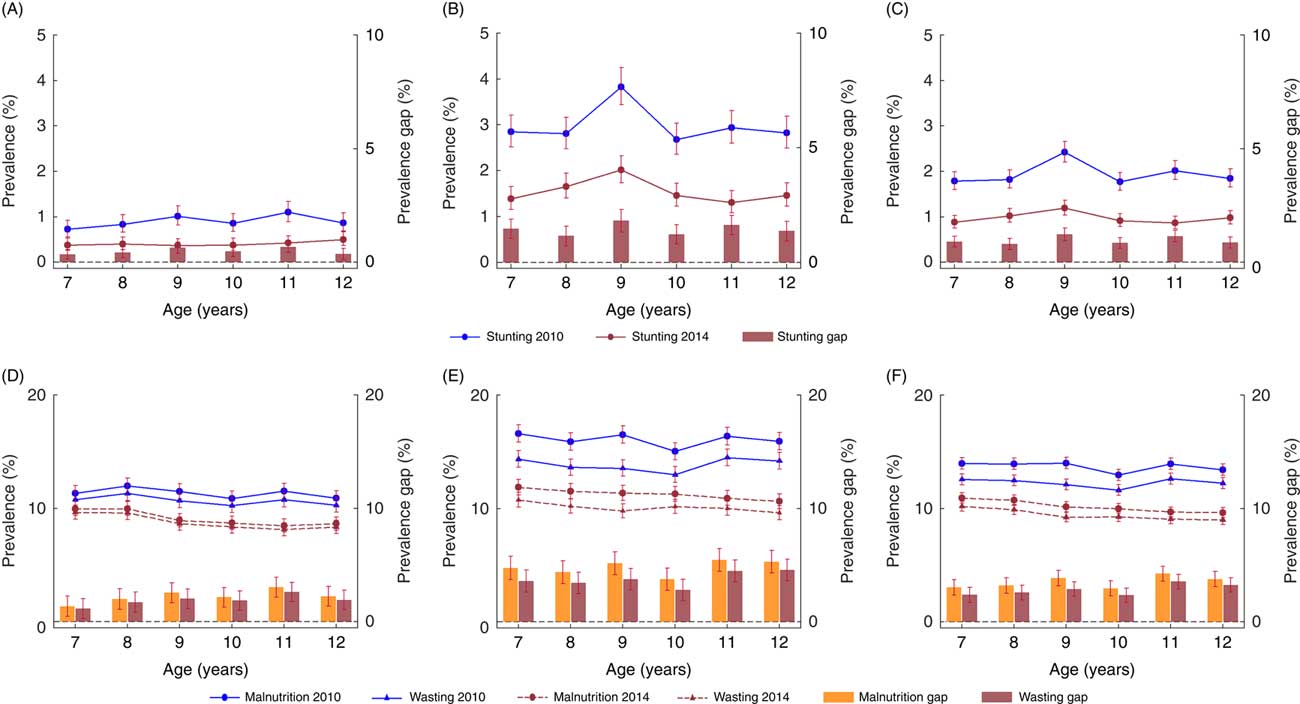
The prevalence of stunting, wasting and malnutrition was stable across the age bands from 7 to 12 years in both survey years (2010 and 2014), except for age 9 years where there was a notable increase in stunting in rural children within both survey years. Prevalence of stunting, wasting and malnutrition decreased in all age groups between 2010 and 2014. The prevalence of stunting, wasting and malnutrition was higher in rural children than in their urban peers. Further, the decreases seen were higher in rural areas than those seen in urban areas for corresponding ages (Fig. 1 and online supplementary material, Table S1). For example, the average decrease in malnutrition in rural areas was 4·8 %, compared with 2·2 % in urban areas.

Fig. 1 Comparison of stunting, wasting and malnutrition prevalence in 7- to 12-year-old urban and rural Chinese children between 2010 and 2014, with 95 % CI indicated by vertical bars: stunting in urban (A), rural (B) and total (C); malnutrition and wasting in urban (D), rural (E) and total (F)
Changes in the prevalence of stunting, wasting and malnutrition at the provincial level
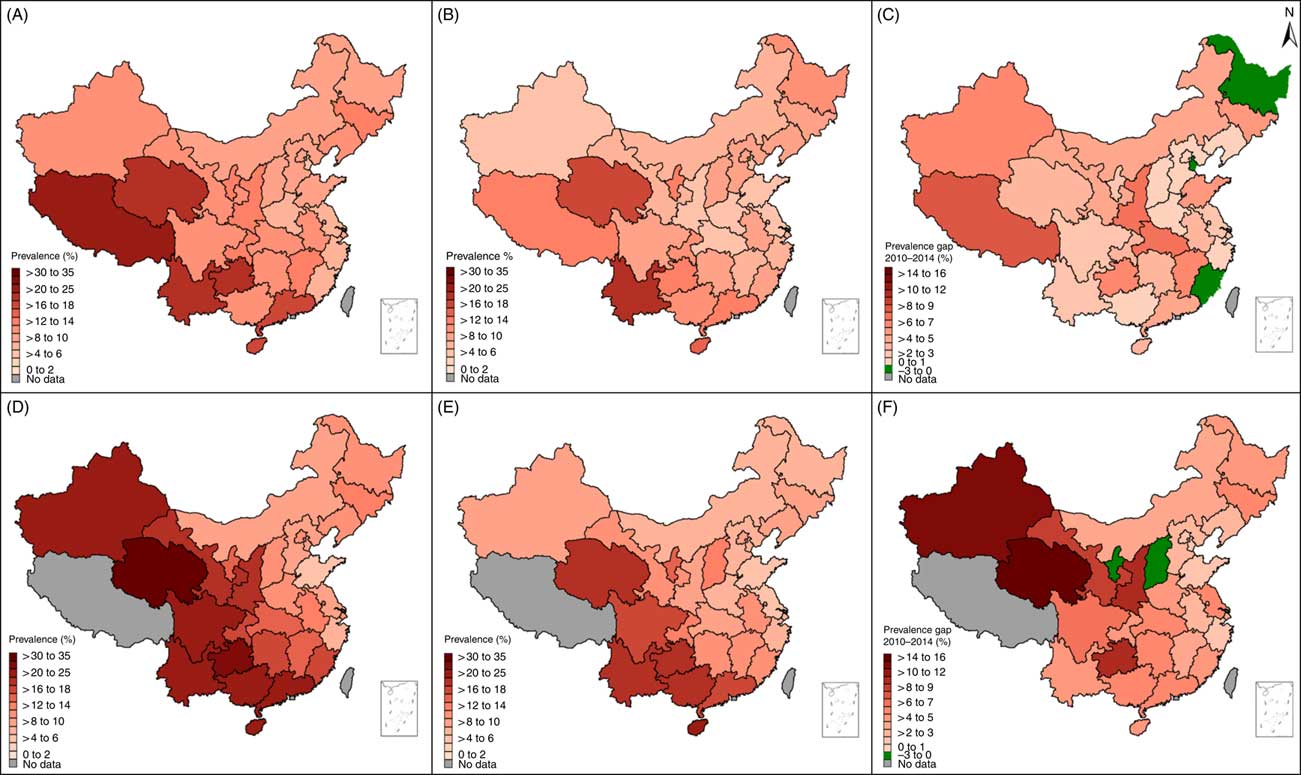
Figure 2 shows higher prevalence of stunting, wasting and malnutrition to be distributed mainly in the western and south-western provinces (including Qinghai, Guizhou and Tibet province), with similar distributions in 2010 and 2014. However, the rate of change was also higher in the western provinces, where larger decreases in stunting, wasting and malnutrition were seen; for example, Xinjiang with the largest decrease of 9·1 %. Geographically we can see that the prevalence of stunting, wasting and malnutrition decreases as one moves from the west of China to the east of China.
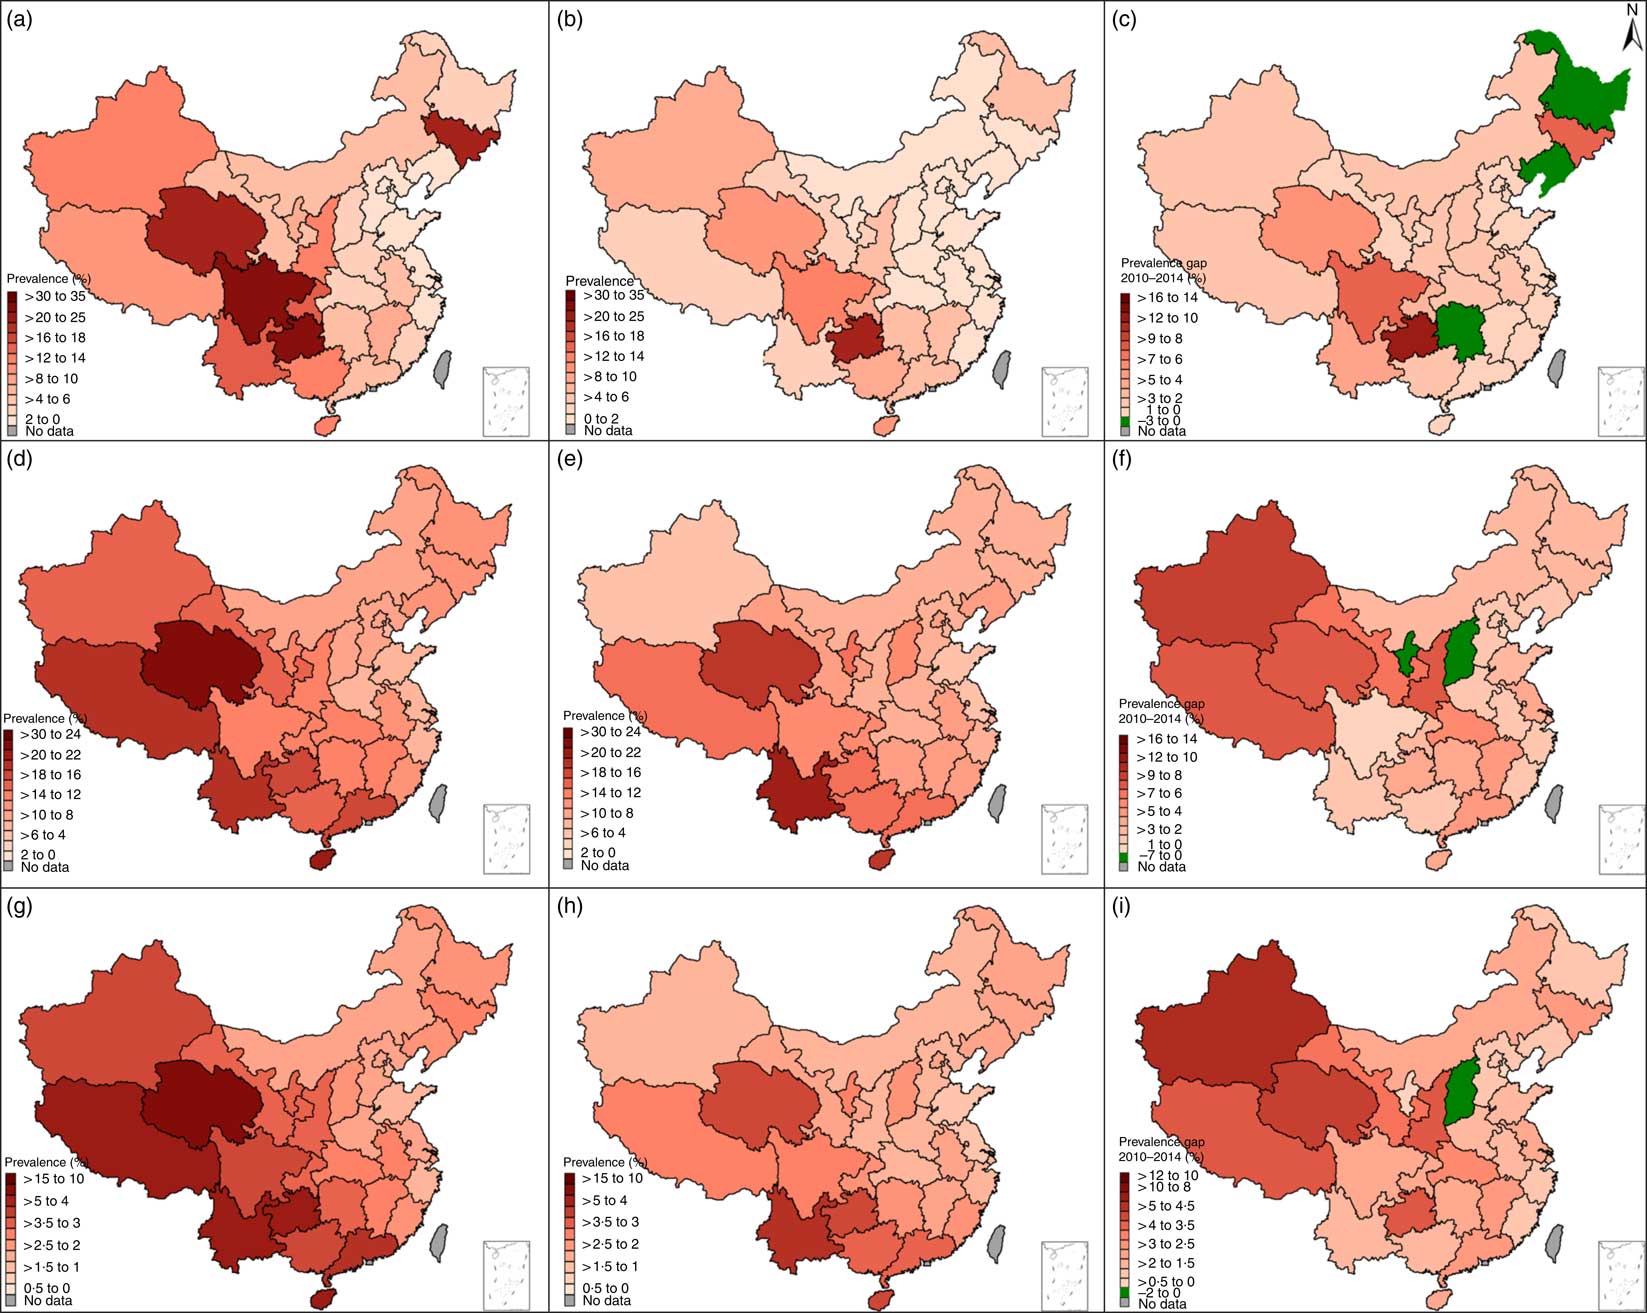
Fig. 2 The distribution and change in prevalence of stunting, wasting and malnutrition in 7- to 12-year-old children in different Chinese provinces between 2010 and 2014: (A) stunting 2010; (B) stunting 2014; (C) change in stunting between 2010 and 2014; (D) wasting 2010; (E) wasting 2014; (F) change in wasting between 2010 and 2014; (G) malnutrition 2010; (E) malnutrition 2014; (F) change in malnutrition between 2010 and 2014
Notably, several provinces presented an increase in prevalence from 2010 to 2014, such as Heilongjiang, Liaoning and Hunan for stunting, Ningxia and Shanxi for wasting, and Shanxi for malnutrition (see online supplementary material, Tables S2, S3 and S4).
Changes in urban–rural disparity for stunting, wasting and malnutrition at the provincial level
Figure 3 presents a further analysis of subnational distribution for the prevalence of malnutrition in urban and rural areas between 2010 and 2014. The majority of provinces showed a drop in prevalence between 2010 and 2014 in both urban and rural populations; again the provinces with higher malnutrition prevalence are found mainly in the south-west regions of China. For the provinces with the largest decreases in malnutrition between 2010 and 2014 the changes were more marked in the rural children than in the urban children, and again are mainly distributed in the western regions, such as Qinghai, Xinjiang, Gansu, Guizhou and Shaanxi. In addition, three provinces (Heilongjiang, Tianjin and Fujian) presented changes that are in opposition to the main findings, with increased malnutrition found in urban children during this period. Two provinces (Ningxia and Shanxi) showed increased malnutrition for rural children. Similar trends were also observed for stunting and wasting prevalence (see online supplementary material, Fig. S2, Fig. S3 and Table S3, Table S4).

Fig. 3 The distribution and change in prevalence of malnutrition in 7- to 12-year-old urban and rural children in different Chinese provinces between 2010 and 2014: (A) urban malnutrition 2010; (B) urban malnutrition 2014; (C) change in urban malnutrition between 2010 and 2014; (D) rural malnutrition 2010; (E) rural malnutrition 2014; (F) change in rural malnutrition between 2010 and 2014
Figure 4 shows the prevalence gap between urban and rural areas in 2010 and 2014. Overall, the prevalence gap for stunting, wasting and malnutrition between rural and urban areas in 2014 shrank compared with the corresponding prevalence gap recorded in 2010. In both 2010 and 2014, the prevalence gaps between rural and urban were larger in the western and south-western provinces compared with the eastern provinces, such as Xinjiang, Qinghai, Gansu, Sichuan, Guizhou and Guangxi. Notably, in some provinces the prevalence in urban areas was higher than in rural areas, and this gap increased between 2010 and 2014. For example, Shandong province presented a reverse gap for stunting, wasting and malnutrition and Inner Mongolia for wasting in 2010. In 2014 this expanded to a further six provinces for malnutrition and nine provinces for wasting (see online supplementary material, Table S5).

Fig. 4 The change in prevalence gap for stunting, wasting and malnutrition in 7- to 12-year-old children, in rural v. urban areas, in different Chinese provinces between 2010 and 2014: (A) stunting gap (rural v. urban) 2010; (B) stunting gap (rural v. urban) 2014; (C) wasting gap (rural v. urban) 2010; (D) wasting gap (rural v. urban) 2014; (E) malnutrition gap (rural v. urban) 2010; (F) malnutrition gap (rural v. urban) 2014
Prevalence odds ratios of urban v. rural children for stunting, wasting and malnutrition
The POR of rural v. urban children for wasting and malnutrition decreased significantly from 2010 to 2014 (P<0·001). The POR for stunting increased slightly but were not statistically significant (P=0·196). A similar decrease in POR was also observed in the East, Central and West regions. The increase in POR that is seen as a gradient from the east to west geographically suggests a larger urban–rural disparity in the west compared with the east of China. For example, the POR of rural v. urban children for malnutrition in 2014 in the East, Central and West regions were 1·11 (95 % CI 1·04, 1·19), 1·23 (95 % CI 1·13, 1·33) and 1·42 (95 % CI 1·34, 1·51), respectively, lower than the corresponding regional POR in 2010 of 1·32 (95 % CI 1·24, 1·41), 1·33 (95 % CI 1·24, 1·43) and 1·75 (95 % CI 1·66, 1·84), respectively, demonstrating both the decreases overall and the geographic differences (Table 2).
Table 2 Prevalence odds ratios (POR) and 95 % CI for stunting, wasting and malnutrition in 7- to 12-year-old children, in rural v. urban areas, in different Chinese regions between 2010 and 2014

POR adjusted for sex, age and socio-economic status. P values were used to compare the differences in POR between survey years of 2010 and 2014.
Discussion
The present study is the first looking at the available data on national and subnational trends in malnutrition after the 2008 global economic crisis in China. As the economic situation improves so does children’s nutritional status( Reference McGovern, Krishna and Aguayo 20 , Reference Vollmer, Harttgen and Subramanyam 21 ). As such, assessing children and young people’s nutritional status post the global economic crisis in China is crucial. Based on over 100 000 children aged 7–12 years in China surveyed in 2010 and 2014, we found that the prevalence of malnutrition, including stunting and wasting, decreased between 2010 and 2014. Despite the global economic crisis, the measured malnutrition in Chinese primary-school children in our study decreased between 2010 and 2014, and the urban–rural disparity decreased over the same time period due largely to a decrease in malnutrition prevalence in rural areas, suggesting that the global economic crisis appears to have had little effect on the nutritional status of Chinese children.
Several factors could have protected Chinese children from the nutritional consequences of the economic crisis. First, agriculture policies implemented by the Chinese Government over the last 20 years included measures such as the removal of agricultural taxes, slaughtering taxes and changes to other production policies, price protection policies and more favourable policies for farmers. These changes have ensured the continuous growth of food production and stable prices, which guaranteed access to food sources( Reference Guo, Popkin and Mroz 22 , Reference Fan and Cohen 23 ). Second, the nutritional policies for students such as ‘the standard amount of nutritional supply for a student’s lunch’ (1998)( 24 ), ‘the nutrition improvement programme among rural compulsory education students’ (2011)( Reference Zhang, Hu and Tian 25 ) and ‘free compulsory education in rural areas’ (2006)( 26 ) implemented by the Chinese Government might be the driver that is improving Chinese children’s nutritional status overall and the shrinking urban–rural disparity. Third, the Chinese Government’s combined social security and development policies, such as the Rural Cooperative Medical Scheme and the New Farmers’ Social Security System, have increased public investment in farming communities and reduced financial burden in rural families, which has left more money available for food( Reference Babiarz, Miller and Yi 27 ). The combination of agricultural production policies, education improvement policies, social security and medical policies has enabled China to overcome the 2008–2009 crisis and sustain nutritional improvement with a narrowing in urban–rural disparity. Data from the National Bureau of Statistics of China on the Engel’s coefficients, the proportion of family income that is spent on food( Reference Binnendijk, Dror and Gerelle 28 ), for urban and rural residents supports the effects of these policies: 37·9 and 43·7 % in 2010 dropped to 35·6 and 37·9 % in 2014 for urban and rural residents, respectively( 29 ). Of note, the disparity between urban and rural income spent on food has also decreased while at the same time malnutrition has decreased.
Worldwide, the hunger problem increased after the global economic crisis and the subsequent food crisis in the second half of 2008( Reference Grebmer, Nestorova and Quisumbing 30 ). China’s patterns of malnutrition from 2010 to 2014 appear quite different from patterns that have emerged from other countries during and after the crisis. Urban–rural disparity increased in East Asia, the Pacific and South Asia, while it decreased in sub-Saharan Africa( Reference Jaacks, Slining and Popkin 8 ). Our results provide important insights into what happened to Chinese children’s nutritional status during this critical period. Previous studies from the National Food and Nutrition Surveillance System in China showed consistent findings that the prevalence of underweight and stunting in children aged <5 years decreased from 1990 to 2010( Reference Chen, He and Wang 3 ). Wu and Qi( Reference Wu and Qi 31 ) used the data from nine Chinese provinces and found that the urban–rural gap in stunting within these populations reduced dramatically from 1991 to 2009. Several other studies( Reference Zhang, Wang and Eldridge 32 , Reference Liu, Fang and Zhao 33 ) showed a reduced urban–rural disparity in total energy intake and in the consumption of meat and meat products, suggesting that the convergence of diet between urban and rural populations might partly explain the shrinking gap between urban and rural malnutrition.
For the first time ever, our results have shown a new phenomenon of a reversal in the national and provincial urban–rural disparity in childhood malnutrition: the prevalence of malnutrition in urban areas surpassed that in rural areas in several provinces. Descriptive analysis has shown that the improvement in nutritional status was more prominent in rural areas than in urban areas in many provinces.
The present study shows geographic disparities. The prevalence of malnutrition for both urban and rural children was higher in the western provinces, especially in south-western regions, and lower in the eastern provinces, especially in north-eastern regions. The diminishing disparity in malnutrition appears to be due to faster improvement in rural areas compared with urban areas. Additionally, it might be that the changes in disparity are associated with the SES of the areas, i.e. areas of higher SES (eastern China) had lower differences than areas of low SES (west China). Inequality in SES occurs in different Chinese provinces, with eastern provinces being the most economically developed, followed by the central and the western provinces( 34 ). Prior studies found that provincial disparity in nutritional status was associated with economic growth, and thus improving economic status can improve the nutritional conditions of the children in poor families( Reference Wu and Qi 31 ). In other developing countries such as Brazil, India and Mexico, a higher burden of underweight in rural areas is experienced compared with urban areas, and these countries underwent an increase in the urban–rural differences in childhood underweight( Reference Jaacks, Slining and Popkin 8 , Reference Wang, Monteiro and Popkin 10 , Reference Subramanyam, Kawachi and Berkman 35 ). Similar trends were observed in some other middle-income countries in Eastern Europe and Central Asia( Reference Jaacks, Slining and Popkin 8 ). Different patterns were observed in developed countries. For example, one study in the USA found that while children from rural areas had a higher risk of being underweight compared with urban children during 1971 to 1974, a reversal occurred from 1988 when the prevalence of underweight in urban children surpassed that of rural children( Reference Wang, Monteiro and Popkin 10 ).
Some provinces with a higher SES had a higher prevalence of malnutrition in urban children compared with their rural peers, such as Shandong, Jiangsu and Zhejiang, whose per capita gross domestic product ranked top in the thirty-one national provinces, respectively( 36 ). As China’s economy continues to develop, this kind of reversal pattern might be expected in all Chinese provinces. Other developing countries might face the same urban–rural reversal in nutritional status in the future and our provincial results might provide a useful reference for countries in developing effective interventions. While more resources aimed at improving childhood malnutrition should continue to be focused on rural areas, the disparities in SES within urban areas should also be considered when designing programmes and policies addressing malnutrition( Reference Kennedy, Nantel and Brouwer 37 ).
The present study has the following limitations. First, because we used data from two cross-sectional surveys, the data cannot be used to infer causality. However, the CNSSCH is a nationally representative data set with a large sample size, and the prevalence estimated in the 2010 and 2014 surveys met our requirements for a descriptive analysis looking at both provincial-level data and the urban–rural divide. Second, our study adopted the standard Chinese definition for malnutrition, including wasting and stunting, and did not use the WHO or International Obesity Task Force thinness definition. This standard is one of most appropriate that was not only suitable for Chinese children but consistent with the Eastern Asia ethnic characteristics of body fatness growth, which could eliminate the influence of different populations with different growth pattern and fat accumulation( Reference Dong, Zou and Yang 38 , Reference Ji 39 ). Third, for Tibet, only urban children of Tibetan ethnic background were included, therefore these data were excluded from the urban–rural comparison analyses. The difference between these two groups was not explored, but when excluded from the analyses it did not change the results.
Conclusion
In summary, the prevalence of malnutrition, including stunting and wasting, in children aged 7–12 years decreased between 2010 and 2014. Prevalence of malnutrition for both urban and rural children was higher in the western provinces, especially in south-west regions, and lower in the eastern provinces, especially in north-east regions. Although malnutrition prevalence in rural areas was higher than in urban areas, it reduced more in rural areas and the urban–rural disparity shrank over this period as a result. A reversal in urban–rural disparity was seen in a few high-SES provinces where the malnutrition prevalence in urban areas surpassed rural areas. The shrinking urban–rural disparity for malnutrition prevalence appears to be driven by the SES of the provinces. Region-specific policies and interventions are warranted to sustainably improve the nutritional status of Chinese children.
Acknowledgements
Acknowledgements: The authors would like to acknowledge the support from all the team members and the participating students, teachers, parents and local education and health staff in the programmes. Financial support: This study was supported by a grant from the National Natural Science Foundation awarded to J.M. (grant numbers 81302442 and 81673192). The National Natural Science Foundation had no role in the design, analysis or writing of this article. Conflict of interest: The authors declared no conflict of interest. Contribution: Y.D., Y.S. and Y.M. conceptualized and designed the study; Y.D. completed the statistical analyses, drafted the initial manuscript, reviewed and revised the manuscript; J.M. and Y.S. designed the study and collected the data; K.B. and C.J. synthesized the results and critically revised the manuscript; B.D., Z.Z., P.H., Z.W., Z.Y., X.W., R.X., Y.L. and B.W. assisted with the statistical analyses and critically reviewed and revised the manuscript; all authors were involved in writing the paper and had final approval of the submitted and published versions. Ethics of human subject participation: This study was conducted according to the guidelines laid down in the Declaration of Helsinki and all procedures involving students were approved by the Medical Research Ethics Committee of the Peking University Health Science Center (IRB00001052-18002). Verbal informed consent was obtained from all students and their parents. Verbal consent was witnessed and formally recorded.
Supplementary material
To view supplementary material for this article, please visit https://doi.org/10.1017/S1368980019000235