


The Mediterranean diet (MedDiet) is characterized by the consumption of high amounts of vegetables, cereals (mostly unrefined), legumes, nuts and olive oil as the main source of fats, moderate intakes of fish and dairy products, low quantities of meat and meat products, and an optional moderate wine consumption( Reference Bach-Faig, Berry and Lairon 1 – Reference Willett, Sacks and Trichopoulou 3 ). Epidemiological studies have associated the MedDiet with a higher nutrient adequacy( Reference Sanchez-Tainta, Zazpe and Bes-Rastrollo 4 , Reference Serra-Majem, Bes-Rastrollo and Roman-Vinas 5 ) and several investigations confirm its role in prevention of chronic diseases( Reference Bosetti, Pelucchi and La Vecchia 6 – Reference Trichopoulou, Martinez-Gonzalez and Tong 13 ). Moreover, this pattern should not be considered like a set of foods only, but also as a cultural model. The United Nations Educational, Scientific and Cultural Organization acknowledged it as an Intangible Cultural Heritage of Humanity, stating that: ‘The Mediterranean diet involves a set of skills, knowledge, rituals, symbols and traditions concerning crops, harvesting, fishing, animal husbandry, conservation, processing, cooking, and particularly the sharing and consumption of food’( 14 ).
Beyond the prevention of chronic diseases in the present generation, there are further potential future advantages for next generations by increasing population adherence to a healthy dietary model. The way food is produced, processed, distributed and consumed has consequences not only for human health but also for ecosystems( Reference Donini, Dernini and Lairon 15 , Reference Gussow and Clancy 16 ). Environmental footprints are caused by resource consumption (such as land, water and energy) and greenhouse gas (GHG) emission, among others. The impact on the environment differs among food items( Reference Carlsson-Kanyama and Gonzalez 17 ); for example, vegetable-based foods have lower environmental impact compared with foods coming from animals( Reference Baroni, Cenci and Tettamanti 18 – Reference Reijnders and Soret 20 ). Sustainable diets have been defined as ‘those diets with low environmental impacts which contribute to food and nutrition security and to healthy life for present and future generations. Sustainable diets are protective and respectful of biodiversity and ecosystems, culturally acceptable, accessible, economically fair and affordable; nutritionally adequate, safe and healthy; while optimizing natural and human resources’( Reference Burlingame and Dernini 21 ).
In the 1990s, Gussow started studying the MedDiet according to its impact on the environment( Reference Gussow 22 ), and in 2009, the MedDiet was declared a sustainable dietary model due to its nutritional, environmental, economic and sociocultural dimensions( Reference Burlingame and Dernini 23 – Reference Germani, Vitiello and Giusti 25 ). From then on, the new version of the Mediterranean diet pyramid, for the first time, included not only the main characteristic foods but also biodiversity and eco-friendly products( Reference Bach-Faig, Berry and Lairon 1 ). Some economic and sociocultural factors, like lifestyle changes and food globalization, are responsible for the current decreasing adherence to the MedDiet, as is happening in the Spanish population( Reference Leon-Munoz, Guallar-Castillon and Graciani 26 – Reference Varela-Moreiras, Avila and Cuadrado 28 ).
Thus, our objective was to evaluate the impact on resource (land, water and energy) use and GHG emission of a Mediterranean Spanish cohort according to adherence to the Mediterranean diet( Reference Trichopoulou, Costacou and Bamia 29 ).
Methods
Study population
The Spanish project Seguimiento Universidad de Navarra (University of Navarra Follow-up; SUN) is an ongoing, multipurpose, dynamic cohort of university graduates conducted in Spain. It started in December 1999, and the recruitment of participants is permanently open. When participants are invited to enter the study, they receive the baseline questionnaire and a letter which explains all information about the SUN cohort, including how to withdraw from the study. Voluntary completion of the baseline questionnaire implies the informed consent. Every two years, information from participants is collected by mailed or emailed questionnaires. Further details of the study design and methods have been published elsewhere( Reference Martinez-Gonzalez, Sanchez-Villegas and De Irala 30 – Reference Segui-Gomez, de la Fuente and Vazquez 32 ).
Up to December 2015, 22 476 participants were recruited. Among them, we excluded 2113 with total energy intake outside predefined limits (<3347 and 2092 kJ/d (<800 and <500 kcal/d) or >16 736 and >14 644 kJ/d (>4000 and >3500 kcal/d) for men and women, respectively)( Reference Willett 33 ). Therefore, the final number of participants for the current analysis was 20 363.
Exposure assessment
Dietary intake was recorded using a semi-quantitative FFQ (136 food items) completed at baseline. On it, food items were classified into the following groups: dairy products; eggs and meat; fish and seafood; vegetables; fruits; legumes; cereals; fats and oils; pastries; drinks; and others. The validity and reproducibility of this questionnaire were previously reported( Reference Martin-Moreno, Boyle and Gorgojo 34 ) and recently re-evaluated( Reference de la Fuente-Arrillaga, Ruiz and Bes-Rastrollo 35 , Reference Fernandez-Ballart, Pinol and Zazpe 36 ). For example, it showed reasonably good validity for assessing the different food groups (intraclass correlation coefficients v. four 3 d food records ranged from 0·40 to 0·84). Of all food items, we did not assess honey or honey-derived products such as nougat, due to the difficulties of getting objectively quantified values. Processed products were assessed according to their ingredients; most of the recipes for bakery and other products came from a Spanish recipe book( Reference Bustos 37 ).
To measure the adherence of each participant to the Mediterranean pattern, we used the nine-item MedDiet index (vegetables, legumes, fruits and nuts, cereals, fish, meat and meat products, whole-fat dairy products, alcohol and fat (as the ratio of monounsaturated to saturated fat intakes)) proposed by Trichopoulou et al.( Reference Trichopoulou, Costacou and Bamia 29 ). A score of 0 or 1 point was given to each of these nine components, with the use of the sex-specific medians as the cut-offs. For the presumed beneficial components (vegetables, legumes, fruits and nuts, cereals, fish and fat ratio), those participants who consumed that food group below their sex-specific median were assigned a value of 0, and participants whose consumption was at or above the median were assigned 1 point. On the contrary, for detrimental items such as meat and meat products and whole-fat dairy products, consumption below the median was assigned 1 point, and at or above the median was scored as 0. For ethanol, a value of 1 was assigned if the intake was between 10 and 50 g/d or 5 and 25 g/d for men or women, respectively. The total score ranged from 0 to 9 points (minimal to maximal adherence to MedDiet). We established four major categories of MedDiet score: ≤2 points (low adherence; reference), 3–4 points, 5–6 points and ≥7 points (high adherence).
Outcome assessment
We estimated the impact of each food item on land, water and energy use and GHG emission. We assessed the impact of food item production and processing only (except for land use, which included crops and livestock production, but not land related to food processing) and just conventional agriculture processes. For that purpose, we used several information sources of secondary data (see the online supplementary material for the main ones).
The specific value that a serving of each item had in relation to resource use or GHG emission was multiplied by the number of servings of that item consumed per day by each participant, obtaining the daily impact of each food item on the four outcomes. We summed the values of all food items, obtaining the impact on the water, land and energy use and GHG emission of the daily diet of each participant. Apart from assessing these four outcomes on their own, we also proposed a sustainability score based on the total environmental footprint. As in Trichopoulou et al.’s score, 0 or 1 point was given to each of these four components, using the sex-specific medians as the cut-offs. This time, a use/emission below or at the median was assigned 1 point, and otherwise it was scored as 0. The total score ranged from 0 to 4 points; the higher the score, the eco-friendlier the dietary pattern.
Some general considerations should be borne in mind: liver was considered derived from pork and beef, 50 % each of them; entrails from pork, beef and lamb, 33 % of each one; sausages, foie gras, meatballs and other meat products from pork; hamburgers from beef; fish was considered from aquaculture and fresh; ‘white fish’ included hake, seabream and sole; ‘blue fish’ included sardines, tuna and salmon; vegetables, fruits and legumes were assessed as not having processing (with the exception of fruit in syrup or in their own juice, dry fruits and French fries); if an item gathered two or more food products (e.g. apple and pear appeared as only one item), we considered the outcome value of that item as the mean value of all the foods that it contained. Although we obtained information for the majority of food items, for a few of them we did not have available data on their environmental sustainability characteristics. In those cases, we assigned to that item the value of the most similar one (as is the case for energy data of some vegetables).
The data sets generated and/or analysed during the current study are available from the corresponding author upon request.
Statistical analyses
Linear regression models were used to assess the relationship between the four categories of adherence to the MedDiet (≤2; 3–4; 5–6; ≥7 points) and land use, water and energy consumption and GHG emission, separately. The first category (≤2 points) was used as the reference category and three dummy variables were included for the three upper categories of adherence to the MedDiet. Moreover, we performed the same analyses for the total sustainability score. We estimated means and their 95 % CI for each of the categories of the MedDiet, adjusting for energy as a potential confounder. Linear trends were analysed by introducing the Mediterranean score as a continuous variable in the models.
To calculate the contribution of each item to the between-person variability in outcomes, we conducted nested regression analyses after a stepwise selection algorithm. The contribution of each item is shown in the cumulative R 2 change. Furthermore, we estimated the contribution of each item in relation to environmental footprints, dividing its value by total use/emission of the measured outcome (%), for land use, water consumption, energy consumption and GHG emission, separately. We repeated the percentage contribution analysis gathering the items into food groups based on those presented in the baseline FFQ.
All P values presented are two-tailed; P<0·05 was considered statistically significant. Analyses were performed using the statistical software package STATA/SE version 12.1.
Results
Our analysis included a total of 20 363 participants (8098 men and 12 265 women). The principal baseline characteristics of participants across categories of MedDiet adherence are presented in Table 1. Participants with better adherence to the MedDiet compared with those in the poorest adherence category were more likely to have higher total energy intake. On average, they consumed more non-fat/low-fat dairy products, but less total and whole-fat dairy. They consumed more fish and seafood, vegetables, fruits, legumes, cereals and beverages (especially water, red wine and other alcoholic beverage, but less sugar-sweetened sodas). The consumption of pastries, eggs and meat (any kind) was lower in the categories of higher adherence to the MedDiet. According to nutrient intakes, participants with better MedDiet adherence consumed fewer fats, especially SFA, although a higher quantity of olive oil. Their intakes of carbohydrates, dietary fibre and alcohol were higher. They were more prone to be older, married, former smokers and attained a higher level of university education.
Table 1 Distribution of baseline characteristics according to adherence to the Mediterranean diet (MedDiet) among 20 363 participants in the Seguimiento Universidad de Navarra (SUN) cohort, 1999–2015
Values are presented as mean and sd, unless indicated otherwise.
* According to Trichopoulou et al.’s score( Reference Trichopoulou, Costacou and Bamia 29 ).
Analysing land use, higher adherence to the MedDiet was associated with lower land use with multivariable-adjusted differences of −0·13 (95 % CI −0·17, −0·09) m2/d, −0·39 (95 % CI −0·44, −0·35) m2/d and −0·71 (95 % CI −0·76, −0·66) m2/d for MedDiet adherence of 3–4, 5–6 and ≥7 points, respectively, compared with the reference category of lowest adherence (≤2 points; P for trend <0·001; Fig. 1(a)).
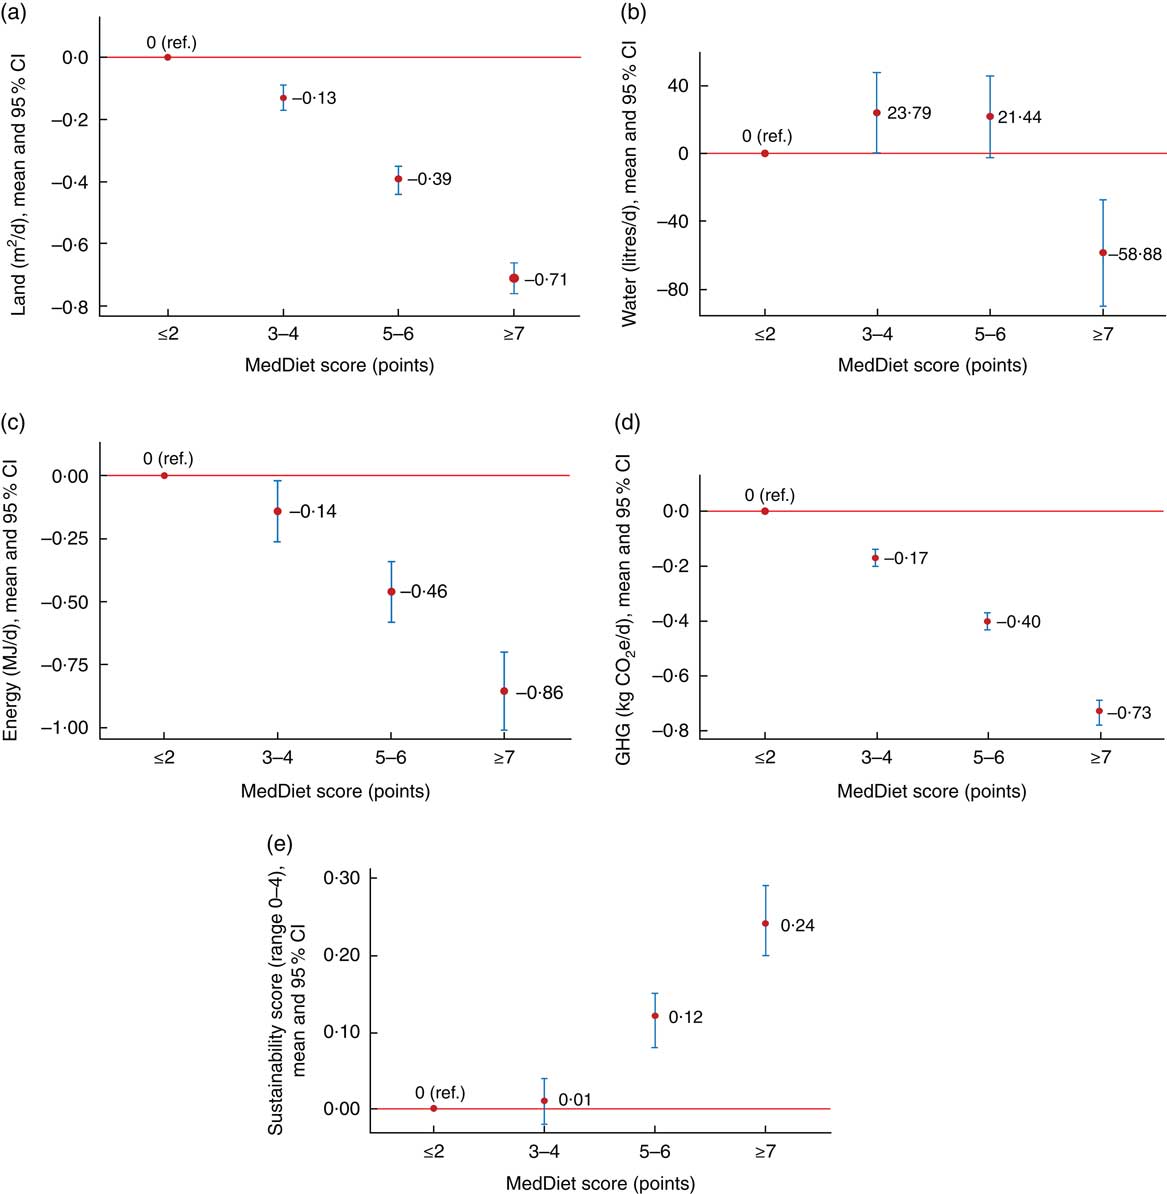
Fig. 1 (colour online) Land use (a), water consumption (b), energy consumption (c), greenhouse gas (GHG) emission (d) and sustainability score (e) according to adherence to the Mediterranean diet (MedDiet) among 20363 participants in the Seguimiento Universidad de Navarra (SUN) cohort, 1999–2015. Red circles represent relative means with respect to the reference (ref.) and vertical bars represent their 95 % CI. MedDiet adherence calculated according to Trichopoulou et al.’s score( Reference Trichopoulou, Costacou and Bamia 29 ) and outcomes adjusted for total energy intake. (a) P trend<0·001; (b) P trend=0·009; (c) P trend<0·001; (d) P trend < 0·001; (e) P trend<0·001
An inverse association between water use and adherence to the MedDiet was also observed when comparing the highest category (≥7 points) v. ≤2 points (−58·88 (95 % CI −90·12, −27·64) litres/d). There was a statistically significant linear trend for all the categories (P for trend=0·009), although the second category (3–4 points) showed higher water use than the reference category (+23·79 (95 % CI +0·07, +47·51) litres/d), while the third category showed no relationship (+21·44 (95 % CI −2·69, +45·47) litres/d) with respect to the lowest adherence (≤2 points) category (Fig. 1(b)).
Energy use decreased as MedDiet adherence increased: −0·14 (95 % CI −0·26, −0·02) MJ/d, −0·46 (95 % CI −0·58, −0·34) MJ/d and −0·86 (95 % CI −1·01, −0·70) MJ/d for 3–4, 5–6 and ≥7 points of adherence to the MedDiet, respectively, compared with the reference (≤2 points; P for trend<0·001; Fig. 1(c)).
The same impact was observed for GHG emission. Less GHG were emitted as the adherence to the MedDiet increased (−0·17 (95 % CI −0·20, −0·14) kg CO2e/d, −0·40 (95 % CI −0·43, −0·37) kg CO2e/d and −0·73 (95 % CI −0·78, −0·69) kg CO2e/d, for MedDiet adherence of 3–4, 5–6 and ≥7 points compared with the reference (≤2 points), respectively; P for trend<0·001; Fig. 1(d)).
Finally, when we analysed all environmental aspects together in a combined sustainability score (Fig. 1(e)), we observed a statistically significant linear trend across all categories of adherence to the MedDiet (P for trend <0·001). This means that the higher the adherence to the MedDiet, the eco-friendlier were the nutritional options. A statistically positive association was reported for the highest (≥7 points) and third (5–6 points) category with respect to the lowest one (0·24 (95 % CI 0·20, 0·29) points and 0·12 (95 % CI 0·08, 0·15) points, respectively), but there was no significant difference between the second category (3–4 points) and the lowest (≤2 points) category (0·01 (95 % CI −0·02, 0·04) points).
After analysing the main sources of variability in the four studied environmental footprints, we concluded that: beef meat, chocolate cookies, old cheese, regular coffee and French fries were the most representative items influencing our results for the land-use analysis (all together: R 2=0·47); beef meat, olive oil, pork meat, cured ham and asparagus, for water consumption (all together: R 2=0·50); beef meat, old cheese, white fish, pork meat and blue fish, in the case of energy consumption (all together: R 2=0·36); and beef meat, old cheese, pork meat, lamb meat and fresh cheese, for GHG emission (all together: R 2=0·64; Table 2).
Table 2 Sources of variability (cumulative R 2) in total land use, water and energy consumption, and greenhouse gas (GHG) emission among 20363 participants in the Seguimiento Universidad de Navarra (SUN) cohort, 1999–2015
* ‘White fish’ includes hake, seabream and sole.
† ‘Blue fish’ includes sardines, tuna and salmon.
As shown in Fig. 2, eggs and meat and dairy products were the groups which contributed the most in all analysed outcomes: land use (22 and 19 %, respectively), water consumption (39 and 14 %, respectively), energy consumption (26 and 18 %, respectively) and GHG emission (46 and 19 %, respectively). Assessing the percentage contribution of specific items in the footprints, we showed that the most relevant for all of them was beef meat (9·4, 14·9, 6·4 and 18·6 %, for land, water and energy use, and GHG emission, respectively), followed by regular coffee (6·1 %) in land use, olive oil (5·9 %) in water consumption, blue fish (5·6 %) in energy consumption and old cheese (5·3 %) in GHG emission.
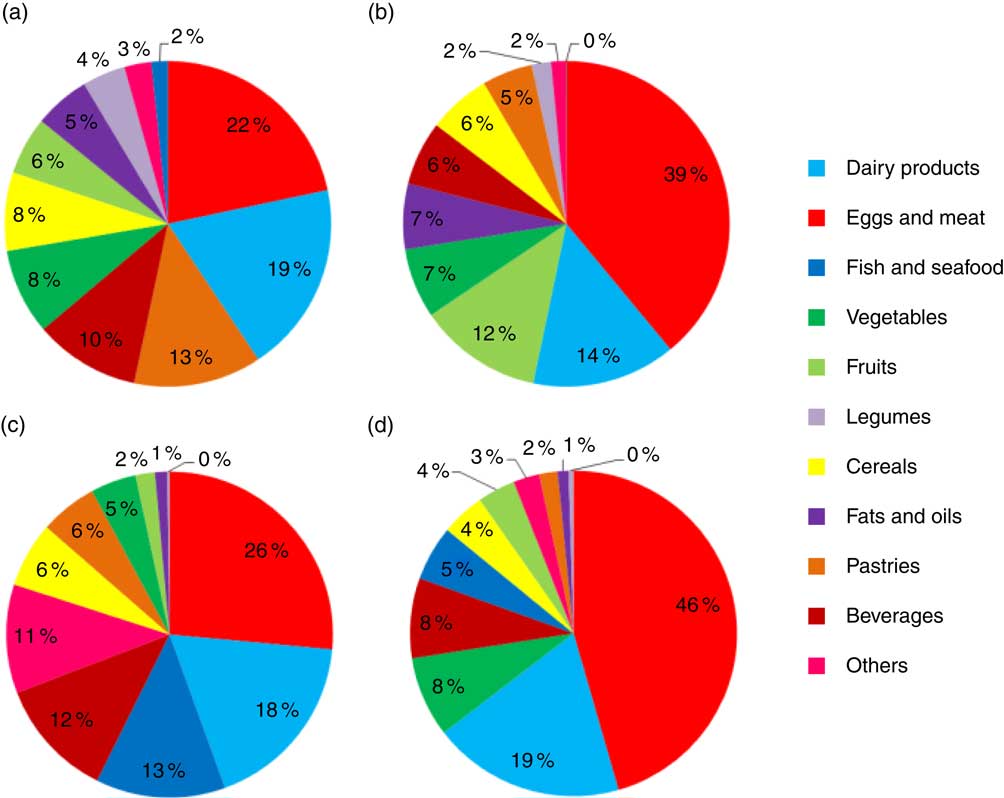
Fig. 2 Percentage of contribution of food groups to land use (a), water consumption (b), energy consumption (c) and greenhouse gas emission (d) among 20363 participants in the Seguimiento Universidad de Navarra (SUN) cohort, 1999–2015
Discussion
In the present study we observed that the better the adherence of our Spanish cohort to the MedDiet, the lower was the land, water and energy use and GHG emission in the production of the foods for these diets. Our findings indicate that high adherence to the MedDiet is an eco-friendly option. Eggs, meat and dairy products were the food groups which most heavily contributed to a detrimental environmental impact in all analysed outcomes and the highest contributive item of all of them by far was beef meat.
Traditionally, professionals of nutrition used to assess diets exclusively according to their nutritional quality, ignoring their environmental consequences. In 1986, Gussow and Clancy started studying diets focusing not only on health but also on the environment footprints( Reference Gussow and Clancy 16 ), and in the last few years, a body of analysis has been carried out in relation to both aspects of diets. According to the present study, the MedDiet could be suggested as a healthy and eco-friendly example of a diet by a nutritionist giving dietary advice. From 1960, food production all around the world has increased in parallel with its population( Reference Pretty 38 ). Moreover, the global population is predicted to increase to about 9 billion people by 2050( 39 ). This increased size of the global population, in conjunction with changes in diet patterns and lifestyles, represents an impact on resource use and biodiversity loss( Reference Johnston, Fanzo and Cogill 40 , Reference Galli, Iha and Halle 41 ). The limitation of Earth’s biophysical capacity may be kept in mind to adequately ponder the health consequences of the adoption of environmentally adverse dietary patterns.
The main environmental issues are loss of biodiversity, climate change, N and P cycle disruption, ozone depletion, acidification, global freshwater use and land use( Reference Rockstrom, Steffen and Noone 42 ). Most of the environmental footprint analyses have been assessed focusing on GHG emission, because it could be considered a good indicator for total environmental impact. Nevertheless, more studies are needed in relation to other aspects, such as resource or chemical use, or food wastage( Reference Heller, Keoleian and Willett 43 , Reference Sabate, Harwatt and Soret 44 ). In the current study we assessed not only GHG emission but also resource exploitation, because energy use, like GHG emission, is evocative of all environmental impacts and footprints( Reference Dutilh and Krammer 45 ), land use is a good proxy for loss of biodiversity( Reference Pereira, Leadley and Proenca 46 ) and water consumption is representative of freshwater loss and water pollution by agrochemicals. Thus, a macro perspective of the intertwined threats was carried out.
Current food production is the leading cause of deforestation, land-use change, water pollution and biodiversity loss. It is during the production stage when the greatest impacts occur, although the whole food chain contributes to these problems. In fact, food production accounts for 20–30 % of anthropogenic GHG emissions and contributes to 70 % of all human water use( Reference Edenhofer, Pichs-Madruga and Sokona 47 , Reference Johnson, Runge and Senauer 48 ). Production of crops for livestock supposes a large environmental cost. For example, the rearing of livestock for meat, eggs and milk generates some 14·5 % of total global GHG emissions and uses 70 % of agricultural land, being the main driver of deforestation, biodiversity loss and land degradation( Reference Gerber, Steinfeld and Henderson 49 ). This is also applicable to foods coming from water, because unsustainable fishing techniques disrupt the marine environment, depleting the species we consume.
The most relevant dietary distinctions in terms of environmental footprints are those between animal-based v. plant-based diets( Reference Sabate and Soret 50 ). The MedDiet is mainly a plant-centred food pattern, although moderate to low amounts of animal foods are admitted. The fact that better adherence of participants in our cohort to the MedDiet was associated with decreased environmental pressures in all assessed dimensions confirms other previous investigations that concluded that a shift towards a MedDiet would reduce GHG emission and resource use( Reference Sabate and Soret 50 – Reference Saez-Almendros, Obrador and Bach-Faig 52 ). We used the index of adherence to the MedDiet proposed by Trichopoulou et al.( Reference Trichopoulou, Costacou and Bamia 29 ) because it is largely used in nutritional public health studies and because its validity has been previously checked( Reference Bach, Serra-Majem and Carrasco 53 , Reference Mila-Villarroel, Bach-Faig and Puig 54 ). It has been reported that a vegetarian or vegan diet could be more environmentally advantageous than other diets which include animal products( Reference Reijnders and Soret 20 , Reference Marlow, Harwatt and Soret 55 ) and that a reduction in meat consumption would ease pressure on footprints( Reference Tilman and Clark 56 ). Thus, a shift, even a gentle and moderate shift to less animal-based and more plant-based diets, like the MedDiet or the pro-vegetarian diet, may be positive not only for reducing all-cause mortality( Reference Martinez-Gonzalez, Sanchez-Tainta and Corella 57 ) but also for the environment( Reference Carlsson-Kanyama and Gonzalez 17 , Reference Baroni, Cenci and Tettamanti 18 , Reference Reijnders and Soret 20 ). For example, legumes are stated as alternatives to animal-protein foods( Reference Carlsson-Kanyama and Gonzalez 17 ) because production of 1 kg of protein from beef supposes eighteen, ten and nine times more land, water and fuel use, respectively, than production of the same quantity of protein from beans( Reference Sranacharoenpong, Soret and Harwatt 58 ). Our results showed, in accordance with other previous studies, that animal-based foods, especially eggs, meat and dairy products, showed a remarkable environmental footprint in all the analysed outcomes, with also a large contribution of fish in the case of energy consumption. Nevertheless, it should be noticed that the increases in land use over time have depended not only on meat consumption, but also on the consumption of beverages like beer, wine or coffee, whose origins are vegetal( Reference Gerbens-Leenes and Nonhebel 59 ).
From a health point of view, moving to diets with fewer animal-based foods would be beneficial( Reference Marlow, Harwatt and Soret 55 , Reference Le and Sabate 60 – Reference Springmann, Godfray and Rayner 63 ). However, some have suggested that diets based exclusively on plant products are not as healthy as others that include small amounts of animal foods, like the Mediterranean( Reference van Dooren, Marinussen and Blonk 64 ). Replacing red meat with white meat could reduce environmental impact (i.e. according to our data, substituting one serving of beef meat by one of chicken supposes a reduction of 2·16 m2 of land, 1664·5 litres of water, 1·911 MJ of energy and 2·013 kg of CO2e; and replacing a serving of pork meat by one of chicken 0·48 m2 of land, 249·45 litres of water, 1·254 MJ of energy and 0·276 kg of CO2e) and from a general health point of view, the latter is more favourable( Reference Becerra-Tomas, Babio and Martinez-Gonzalez 65 ). Fish consumption two or three times weekly is highly recommendable from a health point of view( Reference Calder 66 – 68 ), although this recommendation might be ecologically detrimental. It is necessary, therefore, to reinforce its consumption from recognized sustainable sources, and in the case of wild-caught fish, from species that are not being overfished. Because of that, bearing in mind both aspects of health and environment repercussion, the MedDiet might be one of the healthiest dietary patterns with a relatively low environmental impact( Reference van Dooren, Marinussen and Blonk 64 , Reference Duchin 69 , Reference Nelson, Hamm and Hu 70 ).
New priorities for the public health agenda will be required for the health–environment–diet trilemma( Reference Tilman and Clark 56 ). Global dietary patterns have changed in the last years, and the population tends more and more to consume foods with negative impacts on health and the environment, such as red meats or processed foods( Reference Johnston, Fanzo and Cogill 40 ). Dietary changes are important for promoting improved public health; at the same time healthier diets can reduce the pressures of the agricultural and food systems on the environment( Reference van Dooren, Marinussen and Blonk 64 , Reference Ruini, Ciati and Pratesi 71 ).
Innovative strategies are required to comprehensively assess food systems, which should take account of the health, nutritional and environmental aspects of foods. The environment and public health communities are in a position to reinforce each other’s efforts for working with the general public, governments and corporations. Globally, interest is growing in the scope for designing guidelines that advise on dietary patterns that align health and environmental objectives. However, few dietary guidelines incorporate all these aspects nowadays( Reference Gonzalez and Garnett 72 ). So, more efforts are needed to foster food-choice trends into an eco-friendlier direction.
The major novelty of the current study is that it investigated the relationship between the MedDiet and environmental footprints in a large sample of people from a Mediterranean setting, using the actual habits of consumption. The self-reported dietary information provides a better estimate of the diet than other Spanish analysis based on food balance sheets and household consumption surveys( Reference Saez-Almendros, Obrador and Bach-Faig 52 ). The present study is the first (or one of the very first) direct investigations on the actual environmental impact of the MedDiet measured within a population sample (even though not representative of the general population). Other strengths of our study include the previous validation of the questionnaires used, the high number of food items assessed, the use of a wide range of outcome measures and a relatively large sample size.
Limitations of the study are that the data used to assess environmental footprint have not been recently published and some came from different countries and with different methodologies; furthermore, data for every food on the questionnaire in every analysis were not available. The current investigation studied the effect of diet on the environment according to food production and processing. Other phases of the food chain like packaging, transportation, retailing, cooking and waste disposal go beyond the scope of the present paper. We only took account of conventional agriculture processes and no other alternative ways. Moreover, we analysed resource use and GHG emission only, and no other damaging inputs (like pesticide and fertilizer usage) or outputs (such as waste disposal). For a more comprehensive assessment of the environmental impacts of the diet, these impact categories should also be included in future studies.
Conclusions
Our study found that a better adherence to the MedDiet was an eco-friendly option, associated with less environmental footprints, including lower land, water and energy use and GHG emission. The amount of animal-based foods in the diet, particularly meat and dairy products, was the most significant contributor to the harms for the environment and to a suboptimal sustainability, with beef meat consumption having relevant interest. Nevertheless, to advance this work, better available information must be developed. Other studies based on actual individual food consumption are required to confirm our results. As diet influences positively not only our health but also the environment, a nutritionist giving dietary advice may take the environmental impact of diet into account, and enhanced adherence to a MedDiet is likely to be an important target to be fostered in our society.
Acknowledgements
Acknowledgements: The authors are thankful to Peter Scarborough for his comments on an early version of this manuscript, as well as to the participants of the SUN cohort for their continuous involvement in the project and all members of the SUN study for their support and collaboration. Financial support: The Seguimiento Universidad de Navarra (SUN) Project has received funding from the Spanish Government, Instituto de Salud Carlos III and the European Regional Development Fund (M.-A.M.-G., grant numbers FEDER, CIBER-OBN, G03/140), (M.B.-R., grant numbers PI10/02293, PI13/00615, PI14/01668); the Navarra Regional Government (M.B.-R., grant numbers 45/2011, 122/2014); and the University of Navarra. None of the funders had any role in the design, analysis or writing of this article. Conflict of interest: None. Authorship: Conception and design: U.F. and M.B.-R. Acquisition, analysis and interpretation of data: U.F. and M.B.-R. Statistical analysis: U.F. Drafting of the manuscript: U.F. Critical revision of the manuscript for important intellectual content: J.S., M.-A.M.-G. and M.B.-R. Obtaining funding: M.-A.M.-G. and M.B.-R. Supervision: M.B.-R. Ethics of human subject participation: All procedures performed in studies involving human participants were in accordance with the ethical standards of the Institutional Review Board Research Ethics Committee of the University of Navarra and with the 1964 Helsinki Declaration and its later amendments or comparable ethical standards. Informed consent was obtained from all individual participants included in the study.
Supplementary material
To view supplementary material for this article, please visit https://doi.org/10.1017/S1368980017003986


