


Studies suggest that the cost of food helps explain social inequalities in nutrition( Reference James, Nelson and Ralph 1 – Reference Darmon and Drewnowski 3 ), partly due to the direct relationship between diet quality and diet cost( Reference Andrieu, Darmon and Drewnowski 4 , Reference Townsend, Aaron and Monsivais 5 ). Energy-dense nutrient-poor foods are often the cheapest sources of energy( Reference Maillot, Darmon and Darmon 6 ), making it more difficult for a person with a very limited budget to get a balanced diet( Reference Darmon, Ferguson and Briend 7 , Reference Darmon, Ferguson and Briend 8 ). However, eating healthily at low cost is achievable by making nutritionally optimal choices that target affordable nutrient-rich foods( Reference Cooper and Nelson 9 – Reference Drewnowski 13 ). Diet modelling approaches on French data showed that it is possible to get a balanced food basket with a modest budget of at least €3·50/person per d( Reference Darmon, Ferguson and Briend 8 , Reference Darmon 14 ) on the condition that foods with good nutritional quality for price (NQP) – assessed as the relationship between nutrient profile and average national price – are selected( Reference Maillot, Ferguson and Drewnowski 12 ). In short, getting a balanced diet on a small budget is difficult, but not impossible. But is this realistic, and how do we translate theory into practice? To find out, the Opticourses intervention (www.opticourses.fr) was launched in 2012 in the northern neighbourhoods of Marseille (France) following two pilot actions conducted in 2010 and 2011. Within the framework of a multi-partner, territorial–community participative approach, the Opticourses project featured supply-side and demand-side strands, both aimed at increasing purchases of good-NQP foods by financially struggling households. The demand side of the intervention involved workshops on diet and budget attended on a voluntary basis by local inhabitants responsible for their household’s food purchases( Reference Marty, Dubois and Gaubard 15 ). The supply side was based on a social marketing intervention that aimed to make good-NQP foods accessible, visible and attractive in shops in the target neighbourhoods( Reference Gamburzew, Darcel and Gazan 16 ).
Consistent with the existing literature, early exploration of the factors driving food purchases in the Opticourses population revealed that price was a major concern( Reference Gamburzew, Darcel and Gazan 16 ) and that participants expressed a strong desire to know the ‘good price’ for foods. This popular notion referred to an affordable price, given a low food budget, within the range of market prices( Reference Lee, Mhurchu and Sacks 17 ). The research team thus made it its goal to operationalize this popular notion by co-constructing an educational tool called the ‘Good Price Booklet’, designed to help participants make sound combined nutritional and budgetary choices at the time of purchase.
The aim of the present paper is to describe the methodology used to produce the Good Price Booklet and to provide quantitative and qualitative assessments of its applicability, perception and use by the target public.
Materials and methods
Study design and population
Details and characteristics of the Opticourses nutrition intervention (2012–2014) have been described elsewhere( Reference Marty, Dubois and Gaubard 15 ). Participants facing financial problems and willing to participate in the ‘demand’ strand of the intervention were asked to provide a detailed record of foods entering their household over a 1-month period. In-depth interviews were also conducted to understand the factors driving food purchases in this population( Reference Gamburzew, Darcel and Gazan 16 ).
Methodology to create the Good Price Booklet
Food composition and price databases
The INCA2 food composition table covering 1343 foods declared as having been consumed over one week by a representative sample of 2624 adults who participated in the French national INCA2 survey in 2006–2007 was used. In addition to energy content and about thirty nutritional components, the composition table included two variables obtained during a previous study( Reference Bocquier, Vieux and Lioret 18 ): one column for added sugars and one column for average national prices (calculated on the basis of purchases made by the 2006 Kantar consumer panel). The food composition table gives nutritional values for foods as consumed and average national prices are expressed in €/100 g of food as consumed. However, here we needed to determine the price of foods as purchased, as this is the only relevant information to communicate to participants. We therefore used correction coefficients enabling us to move from price of food consumed to price of purchase (e.g. the average price of 100 g of cooked pasta was multiplied by a coefficient of 3 to obtain the average price of 100 g of raw pasta).
SAIN and LIM calculations
SAIN and LIM are indicators that estimate foods’ positive and negative aspects, respectively( Reference Darmon, Vieux and Maillot 19 ). SAIN estimates the adequacy, per 418 kJ (100 kcal) of food, of the recommended daily intake of protein, vitamin C, fibre, Ca and Fe. LIM estimates the average excess, per 100 g of food, of Na, SFA and added simple sugars. The ratio SAIN:LIM gives a single indicator of nutritional quality: the higher the ratio of a food, the better its nutritional quality( Reference Maillot, Ferguson and Drewnowski 12 ). In the specific case of a food having a LIM of less than 1, we consider that the SAIN:LIM is equal to the food’s SAIN. SAIN:LIM was calculated for all foods in the INCA2 composition table.
Definition of foods with good nutritional quality
The next stage of the analysis was carried out on a reduced composition table covering all the foods of the INCA2 table including fortified foods and foods described as ‘generic’ (e.g. ‘non-specified fruit’ or ‘non-specified cheese’) but excluding ready-made meals (due to their huge variability in composition), alcoholic beverages and non-caloric beverages. Foods whose SAIN:LIM was higher than the median calculated in this reduced table were considered to be of good nutritional quality.
Determination of the good prices for foods of good nutritional quality
Each food of good nutritional quality was then attributed a good price, defined as the price below which the food can be considered relatively inexpensive. To determine this price, two variables were used: (i) the average national price of the food as purchased; and (ii) its ‘limit price’, defined as equal to the value of the first price tertile of the group to which it belongs. For each food, the average national price was then compared against the limit price and the following rule was applied: when average national price was below limit price, then average national price was selected as the good price; if not, limit price was chosen instead.
Selection and grouping of foods of good nutritional quality and price for the Good Price Booklet
Based on the calculations described above, a list of foods with good nutritional quality and price was established to be communicated to workshop participants in the form of an educational tool called the Good Price Booklet. To avoid communicating prices that were unrealistic (too low regarding marketplace reality), it was decided to present only those foods whose average national price was no more than 2·5 times higher than the limit price. The ratio of 2·5 was chosen because it is the average ratio observed between the price of ‘brand-name’ foods and the price of the cheapest foods sold under the same name( Reference Cooper and Nelson 9 , Reference Darmon, Caillavet and Joly 10 ).
An expert appraised the list of foods to avoid potential repetitions in the composition table (e.g. baked potato and boiled or steamed potato) and to group together similar foods under a single designation in accordance with their purchased form (e.g. potato). In that case, the good price indicated in the booklet was the average of good prices of the different foods that have been grouped together.
The selected foods were classified according to supermarket shelves. For some foods, booklet price was calculated by unit as sold in stores (e.g. for one grapefruit or one lettuce).
Assessment
Quantitative assessement of the in-booklet prices
Opticourses participants (n 91) were asked to collect all food-purchase receipts for their household over a 1-month period. Purchase-receipt protocol training and data collection were previously described by Marty et al. ( Reference Marty, Dubois and Gaubard 15 ). For each food item, information from receipts (i.e. date of purchase, corresponding INCA2 food name and code, quantity and price) were entered into a food purchases database. The validity of the food prices listed in the booklet was assessed by quantifying the percentage of purchases bought at a price lower than the in-booklet price, by supermarket shelf category and for the whole food list.
Qualitative assessment of the Good Price Booklet
As part of the effort to evaluate the Opticourses intervention, nineteen semi-structured interviews were conducted with participants after the workshops by an external evaluator. The interview guide contained questions on the tools used during the workshops, particularly the Good Price Booklet.
Results
Opticourses households: descriptive characteristics
Sociodemographic characteristics of the Opticourses households are given in Table 1. Mean household size was 3·41 (range: 1–8), including two children on average (range: 0–6). Almost half of the households (48·2 %) were in a precarious financial situation and one-third (36·5 %) declared severe financial difficulties. Each household shopped at an average of five different stores while collecting receipts, and price was reported as the most important determinant of food purchases.
Table 1 Sociodemographic characteristics of Opticourses households (n 91) from socio-economically disadvantaged neighbourhoods of Marseille, France, 2012–2014
List of foods featuring in the Good Price Booklet
The different stages in the process of identifying the foods with good nutritional quality and price are summarized in Fig. 1. The reduced INCA2 table with ready-made meals and alcoholic and non-caloric beverages pre-eliminated contained 1054 foods. The median SAIN:LIM was then calculated on this reduced table, and foods with SAIN:LIM lower than this median were discarded, resulting in a list of 527 foods of high nutritional quality. Then foods with an average national price 2·5 times greater than their limit price were eliminated (mostly expensive foods such as shellfish, game meat, berries and nuts). Among the remaining foods (n 404), similar items were then grouped together under the same designation, resulting in 153 foods classified according to supermarket shelf. Table 2 presents the list of foods with good nutritional quality and price selected and included in the booklet. For example, for generic foods, the in-booklet price is €1·94/kg for fresh vegetables, €2·42/kg for tinned or frozen vegetables, €1·80/kg for fresh fruits, €2·35/kg for pasta and rice, €4·34/kg for legumes, €2·07/kg for dairy products and €9·56/kg for meat and fish (Table 2).
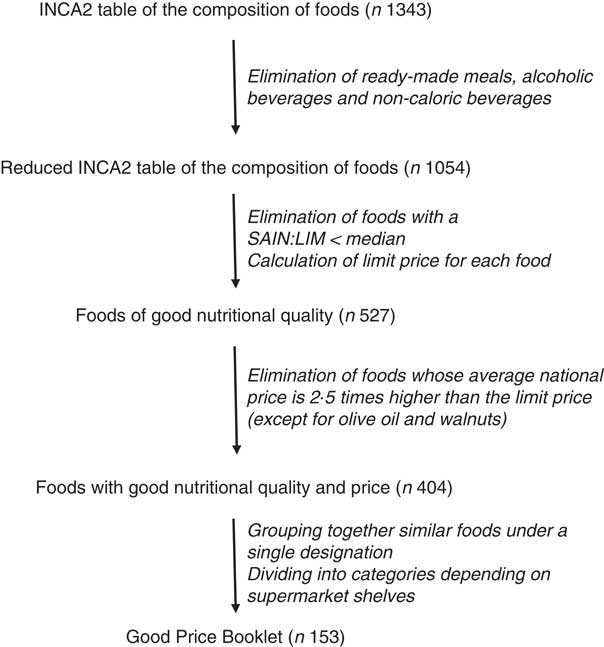
Fig. 1 Flowchart showing how foods were selected for the Good Price Booklet (INCA2, second French national cross-sectional dietary study; SAIN, indicator that estimates foods’ positive aspects; LIM, indicator that estimates foods’ negative aspects; limit price for a given food corresponds to the first tertile of the mean prices of foods in the group to which that food belongs)
Table 2 List of foods with good nutritional quality presented in the Good Price Booklet with their ‘good price’ (€/kg or €/article), Opticourses intervention research project conducted in socio-economically disadvantaged neighbourhoods of Marseille, France, 2012–2014
In bold are foods whose ‘good price’ is based on the limit price rather than average national price.
* Green, white, Brussels sprouts, red, cauliflower.
† Lettuce, escarole, lamb’s lettuce, curly endive.
‡ Apricot, banana, date, prune, fig.
§ ‘Although expensive, moderate consumption is good for your health’.
║ Joint, beefsteak.
¶ For bourguignon, stews or braising.
** Chunks for braising, cutlet, joint.
†† Wholemeal or wholegrain.
‡‡ Good price/unit (€/article).
§§ Tinned or fresh.
║║ Yoghurts, fromage blanc, petits suisses.
Creation of the Good Price Booklet
The Good Price Booklet was created in collaboration with a graphic designer (Fig. 2). This educational tool is presented in the form of a small brochure in payment-card format. It was distributed to participants during the Opticourses intervention workshops to help them spot foods and their corresponding good prices when shopping for groceries.
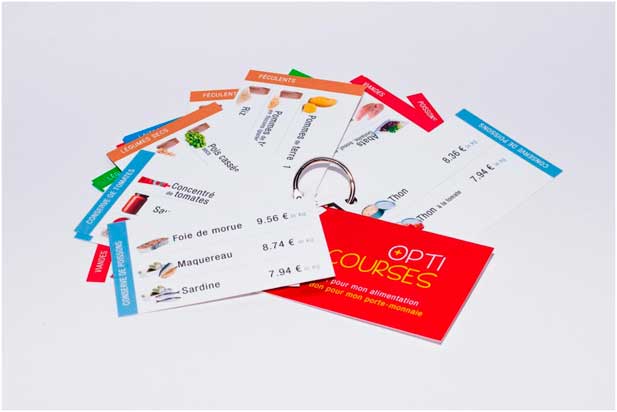
Fig. 2 Good Price Booklet distributed during Opticourses workshops (photo credits: Cédric Dubois)
The flyleaf of the booklet carries the slogan ‘Good for my health and good for my wallet’. The second page carries the statement: ‘All these foods are of good nutritional quality. If you find them cheaper than the price indicated, it’s a bargain for eating healthily and cheaply. If you find them at a price higher than the price indicated, you can buy them anyway as they are all of good nutritional quality’. Olive oil and walnuts are present in the booklet given their widely established health benefits( Reference Estruch, Ros and Salas-Salvado 20 ), even though they were not strictly foods of good nutritional quality and price (olive oil has SAIN:LIM lower than the median SAIN:LIM value of the table and walnuts have an average price over 2·5 times higher than the limit price of their group). Therefore, for these two foods, the booklet did not give a price but instead stated ‘Although expensive, moderate consumption is good for your health’. It was not possible to include foods specific to certain culinary cultures in the booklet (e.g. plantain, sorghum, etc.), as average national prices in mainland France are often high. It was noted at the end of the booklet that ‘Traditional basic foods from your culture are usually of good nutritional quality, and you probably know where to buy them at a good price’.
Quantitative assessment of the relevance of in-booklet price
Several trials were conducted and compared to test the suitability of the proposed method. It emerged that the choice of the median SAIN:LIM to identify foods of good nutritional quality in the table and the choice of the price tertile of each group to estimate in-booklet prices was the most suitable method to have a sufficient number of foods in each group as well as a realistic price value regarding prices observed on supermarket shelves. The tool was tested by the team and workshop participants. During the Opticourses intervention, 2386 purchases of foods with good nutritional quality and price were registered, of which 67·1 % were bought at a price lower than the in-booklet price (Table 3). When separately analysing foods as categorized by supermarket shelf, over half of the purchases made were below prices displayed in the booklet, except for processed meats (46·5 %), breads (8·3 %), and oils and fats (25·3 %). Note, however, that the booklet counted only a few foods in these three categories (due to their relatively low nutritional quality), resulting in few related purchases. None of the breakfast cereals listed in the booklet were purchased by the participants, and so we could not assess the relevance of the in-booklet price for this category. Percentages of purchases below prices displayed in the booklet were higher for foods for which the booklet prices were based on average national price rather than on limit price (i.e. up to 2·5 times cheaper than the average national price), suggesting that it was easier to find the former than the latter.
Table 3 Proportion, by supermarket-shelf category, of purchases of the Good Price Booklet’s foods bought at a price below the booklet price by Opticourses participants from socio-economically disadvantaged neighbourhoods of Marseille, France, 2012–2014
IQR, interquartile range.
* Not purchased by Opticourses participants.
Applicability of the Good Price Booklet within the framework of the Opticourses intervention
One of the workshop’s aims was to share experiences for buying food at lower prices. Participants exchanged useful tips, with some of them knowing where to buy at unbeatable prices (flea markets, stock clearance stores, the fish market at the end of the morning, etc.). These discussions gave contributors the opportunity to highlight several strategies such as substitutions between different food groups (e.g. purchasing less meat and more vegetables), intragroup substitutions (e.g. purchasing cheaper meats of higher nutritional quality) and ‘price hunting’ (e.g. for a given food, preferring low-cost foods over their brand-name equivalents). Thanks to the Good Price Booklet, the notion of ‘good price’ was no longer theoretical. As the Good Price Booklet was designed to be easily transportable in a handbag, it can be used directly in purchase situations: if the price displayed in the shop is below the booklet price for a given food, it is a bargain!
Qualitative assessment of the Good Price Booklet
All participants appreciated the quality of the discussions during the workshops. This was facilitated by the insight it gave into participants’ concerns about the relationship between nutritional quality and food budget. The Good Price Booklet was praised by all participants interviewed (except for one person with reading difficulties), as well as by professionals. The tool, co-constructed with the workshop participants, was greatly appreciated and continued to be used more than a month after the workshops. Verbatim accounts recorded during interviews one month after the workshops include, for example:
‘I use this tool [Good Price Booklet] when I go shopping, it’s always in my bag. I buy products when they’re cheaper than the price listed here. I mostly use it for vegetables when I go to Noailles [a popular fresh foods market, in the centre of Marseille] at the end of the market, as it’s cheaper.’
‘I do my shopping with the keyring [Good Price Booklet] and I buy when it’s below the price listed, otherwise I buy something else.’
‘I use this tool, it’s handy. I buy a lot of bargains.’
‘This month my husband had more time for shopping, so this tool helped him a bit.’
‘I compare purchases with the Good Price Booklet, and I manage to find shops with cheaper prices. But I’ve always looked at prices – now I’ve got this tool, it motivates me to shop better.’
One participant did not use the booklet but explained that her financial constraints were less limiting:
‘I prefer quality to a good price now that there are only two of us at home. The children don’t live with us anymore so it’s different, we can afford to choose quality.’
Discussion
The Good Price Booklet, designed to help recognize foods with good nutritional quality and price when grocery shopping, resulted from a co-construction using the desire of people with financial difficulties to have information on the ‘good price’ for foods and the theoretical work of the research team on the notion of foods with a good NQP( Reference Maillot, Ferguson and Drewnowski 12 ).
Two indicators – SAIN and LIM – were used to appreciate the nutritional quality of foods based on a limited number of nutrients (five qualifying nutrients and three disqualifying nutrients). This selection reflected a balance between the need to include nutrients that are of importance to public health and nutrient markers of other essential nutrients( Reference Tharrey, Maillot and Braesco 21 ). When implemented, the SAIN,LIM system was found to adequately discriminate foods according to their contribution to nutritionally adequate diets( Reference Darmon, Vieux and Maillot 19 , Reference Maillot, Drewnowski and Vieux 22 ). Several studies show that price is a major criterion in terms of food choices, and this is particularly true for people with a limited budget( Reference Wiig and Smith 23 , Reference Waterlander, de Mul and Schuit 24 ). Managing a small food budget effectively requires a sound understanding of food choices. It is true that the foods we are advised to consume more of to protect our health, such as fruit, vegetables and fish, are more expensive sources of energy, whereas carbohydrates and high-fat and high-sugar foods are cheap sources of energy( Reference Darmon and Drewnowski 3 ). Nevertheless, while studies on the cost of a balanced diet unequivocally show that it is more difficult to get a balanced diet with a small budget( Reference Darmon, Ferguson and Briend 7 , Reference Drewnowski, Darmon and Briend 25 ), they also show that it is not impossible on the condition that food groups and good-NQP foods are chosen( Reference Maillot, Ferguson and Drewnowski 12 ). The nutritional quality of foods correlates positively with food prices (expressed in €/418 kJ (100 kcal) based on average national prices)( Reference Darmon, Darmon and Maillot 26 ). This indicates that price structure is generally negative for nutritional balance, because the most expensive foods are often the most nutrient-dense. However, there is strong dispersion around this correlation line, which shows the existence of foods with higher NQP than others: for the same price, one can find foods of high and lower nutritional quality. In particular, legumes, vegetable oils, wholemeal cereal products, milk, plain yoghurt, eggs, poultry and some seafood (e.g. tinned sardines) have a higher NQP ‘in absolute terms’. Conversely, other animal products and most fruits and vegetables (with exceptions, such as carrots, orange juice, etc.) emerge as too expensive to have a good NQP( Reference Maillot, Darmon and Darmon 6 , Reference Drewnowski 11 , Reference Maillot, Ferguson and Drewnowski 12 ). Giving priority to foods with a good NQP ‘in absolute terms’ makes it possible to create a nutritionally optimal diet for €3·50/d( Reference Maillot, Ferguson and Drewnowski 12 ).
Many studies have jointly addressed the notions of diet cost and diet quality( Reference Darmon and Drewnowski 3 ). Some have found that eating healthily does not necessarily cost more when foods with higher nutritional quality for their price are selected( Reference Darmon, Ferguson and Briend 8 , Reference Maillot, Ferguson and Drewnowski 12 ). Above all, they highhlight that achieving higher-quality diets does not entail major changes in habitual dietary patterns but rather optimal choices in each food group (e.g. by preferring low-cost foods to their brand-name equivalents, or canned products to fresh ones)( Reference Cooper and Nelson 9 , Reference Darmon, Caillavet and Joly 10 ). However, any effort to encourage a balanced diet for underprivileged populations mainly by promoting foods with good NQP ‘in absolute terms’ is potentially contentious: not only because many of them are rarely consumed and therefore not socially acceptable for everyone (as is the case for tinned sardines and giblets, for example)( Reference Maillot, Darmon and Drewnowski 27 ) but also because, given the variability of prices, it is highly theoretical to claim categorically that a food has higher nutritional quality for its price in absolute terms. In this regard, during the Opticourses workshops, the theoretical list of foods with good NQP ‘in absolute terms’ quickly proved ill-adapted to the reality in the field. For example, participants challenged the relevance of the list because peppers were not included. The average national price of bell pepper is too high for it to qualify as a food with good NQP ‘in absolute terms’, but the fact is that many participants managed to find this highly nutritious food far cheaper than the average national price. Basing its work on these observations and discussions over food prices, the research team was able to develop the notion of a food’s good price.
The Good Price Booklet was produced in a dynamic two-way interaction between research and fieldwork. Co-construction is recognized as a factor for success in actions to promote health( 28 , Reference Molleman, Peters and Hommels 29 ). When they are developed in interaction with the public for which they are designed, educational tools have a better chance of being adapted to people’s real situation and thus getting used. This is the case for the Good Price Booklet, since the qualitative assessment showed that the tool was appropriated by participants who knew how to use it. Most participants appreciated the tool and continued to use it more than a month after the intervention, thus demonstrating that the tool meets participants’ expectation to find foods of good nutritional quality at an affordable price relative to their food budget. Considering the socio-economically disadvantged situation of the study population, these results suggest that prices displayed in the booklet may remain appropriate for any other population, notwithstanding the fact that ‘good price’ is a budget-dependent concept. Scaling up effective implementation of this education tool requires adapting the methodology to the target population. The booklet must notably integrate specific food patterns and dietary habits which may vary according to population or country considered. In particular, the Opticourses intervention targeted a financially struggling population with diverse cultural backgrounds, which may have resulted in specific dietary habits. Booklet prices must also be adapted to domestic food prices and currency.
This tool has several limitations. First, it uses average national prices dating from 2006, well before the Opticourses intervention began. It would be desirable to frequently update the in-booklet prices. However, collecting robust average national prices of foods is still a challenge( Reference Gamburzew, Darcel and Gazan 16 ). In France, researchers estimated average national prices to match with consumption data from the two national dietary surveys, i.e. INCA1 (1998–1999) and INCA2 (2006–2007). Furthermore, previous analyses carried out as part of the Opticourses intervention showed that participants purchased food at prices significantly lower than the 2006 average national prices( Reference Marty, Dubois and Gaubard 15 ), which thus remain relevant within the framework of our intervention. Second, national prices may not directly reflect local prices which are influenced by many factors such as local markets or policies( Reference Gamburzew, Darcel and Gazan 16 ). Third, exposure to food contaminants, a growing health concern( Reference Hussain 30 ), is not captured by the SAIN,LIM calculation. Fourth, the definition of good nutritional quality in the current study – based on the median of foods’ SAIN:LIM – is relative and depends on the number and type of foods included in the table. If the composition table contained more fruit and vegetables, for example, then the median SAIN:LIM value would increase and thus modify the foods of good nutritional quality selected. Groups of foods high in fat and/or sugar would be less represented. An analysis based on the medians of the SAIN:LIM of each group would allow for the selection of more foods in certain groups, but this choice was rejected here as since median values were hugely disparate depending on the group, some foods with high nutritional quality would be eliminated (e.g. certain fruits and vegetables) while others with lower nutritional quality would be selected (e.g. foods high in fats and sugars) due to the differences in nutritional quality of the groups to which they belong. To overcome these problems, one solution would be to adopt a non-relative definition of nutritional quality, such as its classification within the SAIN,LIM nutrient profiling system, which depends exclusively on the nutritional composition of each food, independent of the food group to which it belongs( Reference Darmon, Vieux and Maillot 19 ). A final limitation concerns the methodology used to produce the booklet’s prices, which could itself be considered arbitrary. However, several trials were conducted to test the realism of the findings obtained by means of the method adopted, and they confirmed the possibility of finding the foods presented in the booklet at a price cheaper than listed. The method developed here needs to be validated more thoroughly to assess the sensitivity of results to spatial and temporal variation in food databases and average national prices.
Various actors (departmental health education committees, family allowance offices, health insurance companies, dietitians, social workers, etc.) require adapted tools to address the issue of shopping and eating healthily on a low budget. The Opticourses Good Price Booklet enables them to move from theory to practice on purchasing food for a balanced diet on a low budget, and is an example of an educational tool produced through co-construction. The transferability of the Opticourses approach is currently being studied as part of a broader project in France. This will provide an opportunity to test the acceptability and benefits of Opticourses protocols and tools in different contexts in terms of target populations, organizations, areas, etc.
Health logos, nutritional information and even subsidies can give rise to unwanted effects and may be liable to increase social inequalities with regard to nutrition( Reference Darmon, Lacroix and Muller 31 ). A positive nutritional logo exclusively indicating foods with a good NQP (by making them available, visible and attractive in shops) was found to direct purchases towards these foods( Reference Gamburzew, Darcel and Gazan 16 ) and would be a concrete way to help consumers identify foods that enable them to reconcile nutrition and budget when they shop for food. Further research is now needed to investigate the effect on nutritional status of a positive logo scheme promoting good-NQP foods.
Acknowledgements
Acknowledgements: The authors would like to thank everyone involved in the ‘demand’ section of the Opticourses intervention: Hind Gaigi (project leader), Malu-Séverine Gaubard and Audrey Maidon (contributors), Audrey Lesturgeon (administrator), Maëlle Robert, Joséphine Rohaut and Lucile Marty (students), Célia Chischportich (external evaluator) and Valérie Leblanc (graphic designer), as well everyone who participated in the workshops and all those who work in the organizations where the workshops were held. Financial support: After two innovative actions funded by the Agence régionale de santé Provence-Alpes-Côte-d’Azur (ARS-PACA) in 2010 and 2011, Opticourses received funding for 2 years from the Institut National du Cancer (INCa), and since September 2014 has been funded by the ARS-PACA to study its transferability on a regional scale. The funding organizations had no role in the design, analysis or writing of this article. Conflict of interest: None. Authorship: N.D. and C.D. designed the study. N.D. provided databases essential for the research. N.D. provided methodological support for data analyses. C.D. and M.T. analysed data, performed statistical analysis and wrote the first draft of the manuscript. All authors had full access to data and revised and approved the manuscript for publication. N.D. and C.D. have primary responsibility for final content. Ethics of human subject participation: The protocol of the Opticourses education intervention was reviewed by the Comité de Protection des Personnes Sud-Méditerranée which stated that no institutional review board approval was necessary for this research. Written informed consent was obtained from all participants at enrolment and the trial was registered at clinicaltrials.gov as NCT02383875.


