


Population ageing is a global phenomenon. In almost every country, due to increasing life expectancy and declining fertility rates, the proportion of the population aged over 60 years is growing faster than any other age group( 1 ). In China, the proportion of the population in older age groups is estimated to increase rapidly during the period 2000–2035, with a predicted one in four people being 60 years old and over by 2035( 2 ). Changes to the age structure in China may have many and varying impacts, one of these being the increasing prevalence of non-communicable diseases (NCD)( 2 , 3 ).
Diet plays an important role in preventing NCD( 3 ). With growing knowledge of the relationship between health and diet, dietary guidelines have been developed in many countries to provide dietary advice on food choices and to help people improve dietary intake and prevent NCD. Previous studies have used dietary guidelines to evaluate adherence to a healthy diet in different countries. For instance, some studies have been done for Australian women to examine how well they comply with Australian Dietary Guidelines( Reference Ball, Mishra and Thane 4 , Reference Mishra, Schoenaker and Mihrshahi 5 ). The ‘Healthy Eating Index’ was developed from the Dietary Guidelines for Americans to evaluate dietary patterns and diet changes in the US population( Reference McCullough and Willett 6 , Reference Guenther, Kirkpatrick and Reedy 7 ). In the UK, the ‘Healthy Diet Score’ was developed from dietary guidelines to evaluate diet in early old age( Reference Maynard, Gunnell and Ness 8 ). In China, the Chinese Nutrition Society has promoted dietary advice to the public through the development of Chinese Dietary Guidelines (CDG)( 9 ) in 2007. It provides evidence-based tools for nutrition education in dealing with continuing and emerging problems of under- and overnutrition in China( Reference Li, Jiang and Zhang 10 ). The Chinese Food Pagoda (CFP) 2007( Reference Ge, Jia and Liu 11 ) was developed as a visual learning aid to help people put the CDG into practice and provide the recommended intake to form a ‘healthy diet’ for five levels of food( 12 – 14 ).
However, few studies( Reference Zhang, Chen and Chen 15 , Reference Yu, Zhang and Xiang 16 ) have compared the diets of Chinese people based on the CDG or CFP, and these were limited to one city in China. This research does not allow assessment of dietary intake at the population level or any regional variations. Moreover, no study has evaluated dietary intake against the CFP for older Chinese people. Although China’s population is ageing rapidly, research evidence about diet and nutrition among older Chinese men and women is extremely scarce.
The China Health and Nutrition Survey (CHNS) provides diet and nutrition data for a large, representative sample of the Chinese population. The nine provinces included in the CHNS vary substantially in geography, economic development and health indicators( 17 ). In order to capture regional variations for older Chinese people, we used CHNS data in the present study. We sought to evaluate dietary intake based on the CFP to determine what factors may be associated with adherence to CFP guidelines (derived from the Chinese Food Pagoda Score) for older Chinese people.
Methods
Study design
The CHNS is an ongoing open cohort survey. It is a collaborative project between the Carolina Population Centre and the Chinese Center for Disease Control and Prevention( 17 ). Survey protocols, instruments and the process for obtaining informed consent for CHNS were approved by the institutional review committees of the University of North Carolina at Chapel Hill and the National Institute of Nutrition and Food Safety, Chinese Centre for Disease Control and Prevention. All participants have given their written informed consent( Reference Cui and Dibley 18 ). Also, use of the CHNS data for the current analysis has been approved by the University of Newcastle, Australia (approval number: H-2013-0360).
CHNS uses a multistage, random cluster process to draw a sample of about 4400 households, with a total of 26 000 individuals, from nine provinces. The first CHNS survey was conducted in 1989 and seven additional surveys or rounds have been collected( 17 ). To add further sample diversity, counties within each province were stratified by different income levels (low, middle and high) and a weighted sampling scheme was used to randomly select four counties in each province. The provincial capital (or big city) and a lower-income city were selected. Two urban neighbourhoods and two suburban neighbourhoods within the cities, and one county capital town and three villages within the counties, were subsequently randomly selected. Finally, twenty households were randomly selected within each neighbourhood. All individuals in each household were interviewed( 17 ). Based on level of economic development, China can be divided into four major regions (East Coast, Central, Northeast and West). The purpose for dividing China into four regions is to improve regional coordination and interaction mechanisms so as to form a proper regional development pattern( Reference Liu 19 ). Since the 2000 survey, nine provinces across four regions have been included in the CHNS: Northeast China (Heilongjiang, Liaoning), East Coast (Shandong, Jiangsu), Central China (Hennan, Hubei, Hunan) and West China (Gunagxi, Guizhou), which covers all levels of socio-economic development in China. The survey is described in detail elsewhere( Reference Liu 19 – Reference Liang, Xi and Hu 25 ). The present study used data from the CHNS 2009 survey, which included a total of 2745 persons aged 60 years or over with dietary data.
Dietary data collection
Dietary assessment was based on a combination of data collected via three consecutive 24 h recall surveys at the individual level, as well as a food inventory taken at the household level over the same 3d period. Household food consumption was determined by examining changes in the inventory from the beginning to the end of each day, in combination with a weighing and measuring technique. All foods (including edible oils and salt) remaining after the last meal before initiation of the survey were weighed and recorded. All purchases and home production foods were also recorded. Wasted foods were estimated when weighing was not possible. At the end of the survey, all remaining foods were again weighed and recorded. Individual dietary recall data from every household member were collected over three randomly selected consecutive days. Individual dietary intake data were collected by asking each household member (aged 12 years or older) to report all food consumed over the previous 24 h, whether at home or away from home. Using food models and picture aids, trained field interviewers recorded the type and amount of food consumed at each meal and the place of consumption of all food items during the previous day. The amount of food in each dish was estimated from the household inventory and the proportion of each dish consumed was reported by each person interviewed( 17 ).
The quality of the data collection was checked by comparing an individual’s average daily dietary intake, as calculated from the household inventory, with the individual’s dietary intake based on the 24 h recall data. Where there were significant differences in estimated intakes, the household and individual questions were revisited, and the individual was questioned further about his/her food consumption. Data quality control was also ensured by a high standard of training of the field interviewers, who were trained for at least 3 d in the collection of dietary data( 17 , Reference Li, Li and Ma 22 , Reference Xi, Liang and He 24 ).
Dietary intake calculation
The total foods consumed were divided into the ten food groups and five levels of the CFP 2007( 9 ). They were used to indicate the different levels of dietary importance and amounts of food that Chinese adults need to consume daily for optimal health. The ten food groups are: (i) grains, potatoes and beans; (ii) vegetables; (iii) fruit; (iv) meat; (v) eggs; (vi) fish and shrimp; (vii) dairy; (viii) nuts and soyabean products; (ix) cooking oil; and (x) salt. We calculated total intake (grams) for each food group (the food codes in CHNS are corresponding with food names in the Chinese Food Compostion Table( Reference Yang, He and Pan 26 , Reference Yang, He and Pan 27 )). Oil and salt intakes from household food consumption data were used to supplement the individual dietary data( Reference Cui and Dibley 18 ). Individual oil and salt consumption was calculated according to the total amount of oil and salt consumed in the household, divided by the number of individuals per household, and was then adjusted for the proportion of the household energy intake by each individual( Reference Shi, Luscombe-Marsh and Wittert 28 ). The mean daily energy intake (kcal) was provided by the dietary data in CHNS, which also calculated from the Chinese Food Compostion Table( Reference Yang, He and Pan 26 , Reference Yang, He and Pan 27 ).
Establishing a Chinese Food Pagoda Score
In order to capture overall dietary intake and to evaluate adherence to CFP guidelines, we created a total Chinese Food Pagoda Score (CFPS). Ten food groups with a total of ten scores were developed and used in the present study. For each food group, if the individual consumed sufficient food to meet the recommended intake, we set the score as ‘1’; if the individual consumed 50 % higher or lower than recommended amount range, we set the score as ‘0·5’ (details in Table 1); if the individual was not within the recommended range, and also not in the range of 50 % higher or lower than the recommened amount, we set the score as ‘0’. This means that a higher score indicates greater adherence to the CFP dietary guidelines.
Table 1 Establishing a Chinese Food Pagoda Score (CFPS) based on the Chinese Dietary Guidelines (CDG) and Chinese Food Pagoda (CFP)
† The seven energy intake levels are based on CDG and CFP. Corresponding values in kJ: 6694 kJ, 7531 kJ, 8368 kJ, 9205 kJ, 10 041 kJ, 10 878 kJ and 11 715 kJ.
‡ Same criteria of recommended amount for egg intake for all energy intake levels; dairy intake for all energy intake levels; and salt intake for all energy intake levels.
§ Based on the CFP, cut-off point for cooking oil is 25 g for energy intake level from 1600 kcal (6694 kJ) to 2200 kcal (9205 kJ); cut-off point for cooking oil intake is 30 g for energy intake level from 2400 kcal (10 041 kJ) to 2800 kcal (11 715 kJ).
Other variables
Height and weight were measured directly, based on a standard protocol recommended by the WHO, by trained health workers. Weight in lightweight clothing was measured to the nearest 0·01 kg on a calibrated beam scale and height was measured to the nearest 0·1 cm without shoes with a portable stadiometer( 17 ). BMI was calculated and divided into four categorical levels based on WHO suggestions for Chinese people, which are: underweight, BMI<18·5 kg/m2; normal, BMI=18·5–23·9 kg/m2; overweight, BMI=24·0–27·9 kg/m2; general obesity, BMI≥28·0 kg/m2 ( Reference Chen and Lu 29 ). Education level was recoded into four categories based on six education categories in the questionnaire: illiteracy; low (primary school); medium (junior middle school); and high (high middle school or higher). Marital status was recoded into two categories (married and other marital status) based on five categories in the questionnaire: married; never married; divorced; widowed; and separated. Work status was divided into two levels by the answer to the question ‘Are you presently working?’ Smokers were identified as people who smoked at least one cigarette daily (yes/no), which was categorized from the question ‘How many cigarettes do you smoke per day?’ Drinking (alcoholic beverages) was allocated into two categories, with the question ‘Last year, did you drink beer or any other alcoholic beverage?’ Physical activity was identified into two categories (yes/no), with the question ‘Do you participate in this activity (includes: martial arts, gymnastics, dancing, acrobatics, running, swimming, soccer, basketball, tennis, badminton, volleyball and others)?’ Urbanicity was defined by a multidimensional twelve-component urbanization index, which has been explained in previous studies( Reference Yan, Li and Li 30 , Reference Jones-Smith and Popkin 31 ). Tertiles of the urbanization index were used to define low, medium and high urbanicity for the present study. Region was included as a four-category variable. As noted, regions have different levels of socio-economic development and region is therefore a potential factor impacting on nutritional status( Reference Liu, Fang and Zhao 32 , Reference Mukhopadhyay and Thomassin 33 ).
Statistical analysis
The statistical software package STATA/SE 13.1 was used for data analysis. Median and interquartile range were used to describe the intake for each food group. The χ 2 test was used to assess the association between age, gender and the three different levels of adherence to the recommended intakes (‘below the recommended amount intake’, ‘met the recommended amount intake’ or ‘above the recommended amount intake’) for each food group (the recommended amount for each food group, which is described in Table 1, is scored as ‘1’). Univariate and multivariable linear regression models were used to explore the association between total CFPS and predictor factors. A margin plot( 34 ) was used to show the marginal mean total CFPS in three urbanicity levels across four regions.
Results
Of a total 2745 participants, 57 % (n 1563) were aged 60–69 years and 43 % (n 1182) were aged ≥70 years. Approximately half of the participants (n 1341) had normal BMI (18·5–23·9 kg/m2); 40·1 % of participants were categorized as overweight and obese. The total number of participants in the Northeast, East Central, Central and West regions were 485 (17·7 %), 673 (24·5 %), 862 (31·4 %) and 725 (26·4 %), respectively.
Average consumption amount for each food group
We used median and interquartile range rather than mean and standard deviation to evaluate intake of each food group, as the amount of each food consumed was not normally distributed. Almost everyone ate foods from the grains, potatoes and beans, and vegetables food groups; 80 % of older people ate meat; more than 50 % of older people ate eggs, nuts and soyabean products. Only 10 % of older people ate dairy.
Table 2 shows food group consumption for men and women in the two age cohorts. Energy intakes were highest for men aged 60–69 years and lowest for women aged ≥70 years. For those who ate food in each food group, in the same age group, men had higher consumption than women for most food groups, except for fruit in those aged ≥70 years. Men aged 60–69 years had higher intakes than those aged ≥70 years. Age group comparisons were similar for women, except for dairy and nuts and soyabean products. There were no major differences between different age groups and genders for egg and salt intakes.
Table 2 Energy and food group intakes of older Chinese people (n 2745), according to gender and age group, China Health and Nutrition Survey 2009
IQR, interquartile range.
Percentage of older people meeting recommended intake from the Chinese Food Pagoda
Figure 1 shows the percentage of older people whose food intake met the recommended intake from the CFP for each food group. In general, most people did not meet the recommended intake for the ten food groups. More than 50 % of people consumed less than the recommended intake for vegetables, fruits, eggs, fish and shrimp, dairy, and nuts and soyabeans. However, more than 50 % of people had higher than recommended intakes of grains, potatoes and beans, salt and oil. People were least likely to meet the recommended intake of dairy (0·5 %). More people met the recommended intake for salt (44·3 %) and oil (37·2 %), followed by vegetables (34·8 %), meat (28·1 %), eggs (22·6 %), fish and shrimp (18·7 %) and grains, potatoes and beans (13·8%).
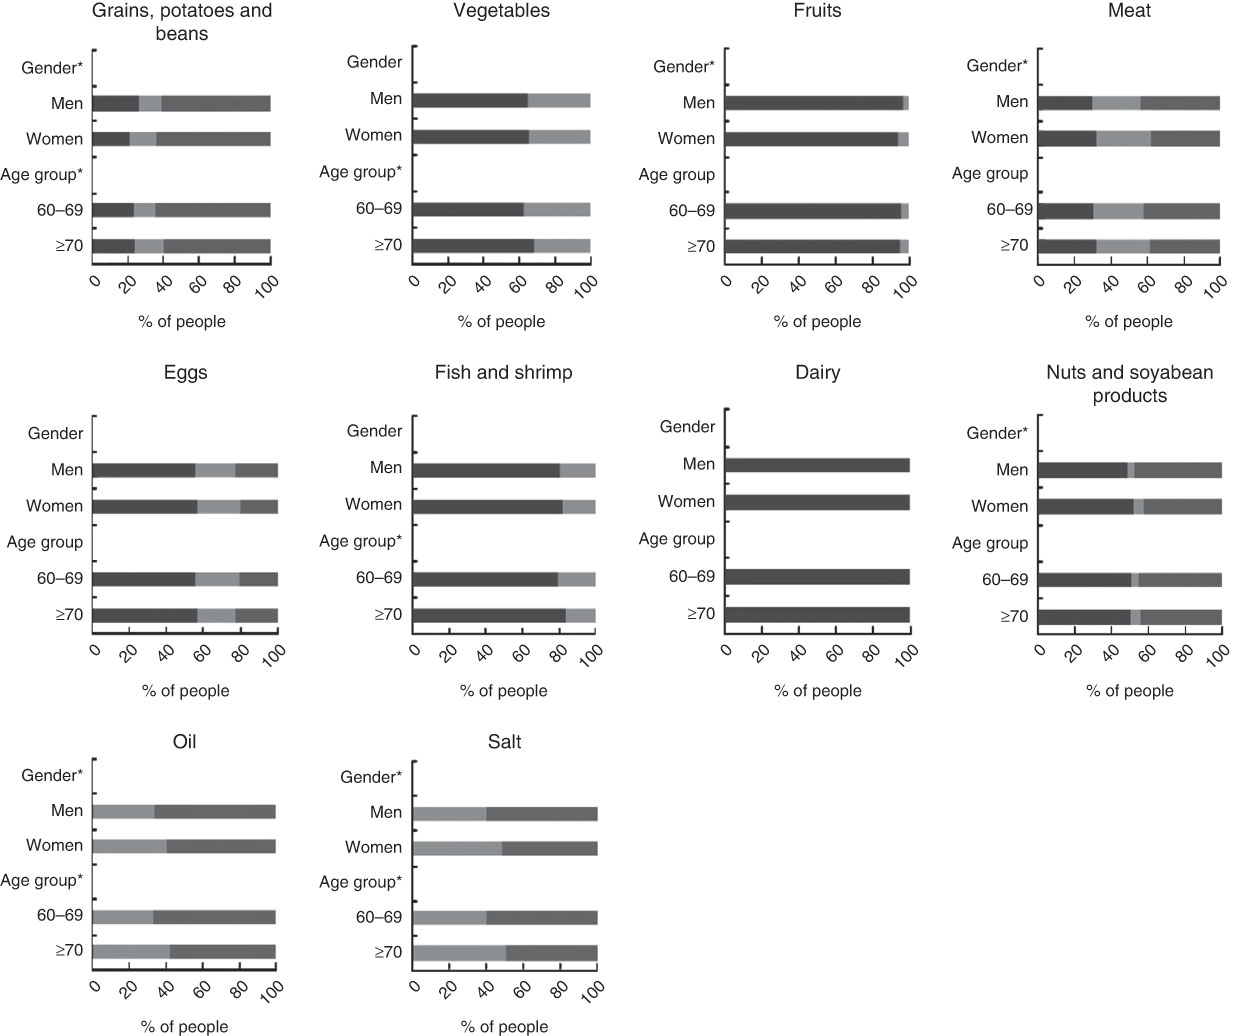
Fig. 1 Percentage of older Chinese people (n 2745) with intake levels meeting (![]() ), below (
), below (![]() ) and above (
) and above (![]() ) the Chinese Food Pagoda guidelines for food group intake, according to gender and age group (years), China Health and Nutrition Survey 2009. Recommended amount for each food group (which is scored as 1) is described in Table 1. *Significant difference in the three levels of meeting recommended intake for each food group between age groups and genders (χ
2 test): P<0·05
) the Chinese Food Pagoda guidelines for food group intake, according to gender and age group (years), China Health and Nutrition Survey 2009. Recommended amount for each food group (which is scored as 1) is described in Table 1. *Significant difference in the three levels of meeting recommended intake for each food group between age groups and genders (χ
2 test): P<0·05
Grains, potatoes and beans are the fundamental and most important dietary food group in the CFP and form the first level of the pagoda. Men were less likely to meet the recommended intake for this food group than women (12·6 % v. 15 %, P<0·001). More people in the age group ≥70 years met the recommended intake than their younger counterparts (15·8 % and 12·4 %; P<0·001). The second level of the CFP includes vegetables and fruit. More men (35·2 %) than women (34·5 %) met the recommended intake for vegetables, but there was no statistically significant difference (P=0·73). For fruit intake, more women met the recommended intake than men (P=0·001), but consumption was mostly below recommended levels for both genders. There were no significant age group differences for fruit intake (P=0·42).
The third level of the CFP comprises meat, fish, shrimp and eggs. There were significant differences in meat intake according to gender (P<0·01) and in fish and shrimp intake according to age group (P=0·004). Dairy, nuts and soyabean products are located on the fourth level of the CFP. More men met the recommended intake than women for dairy, but there was no statistically significant difference (P=0·46). There were significant gender differences for nuts and soyabean products, with more women meeting the recommended amount than men (P=0·006). The fifth level of the CFP is oil and salt. Average daily oil and salt intakes were 47·5 g and 8·8 g, respectively, both of which significantly exceeded the recommended intake. Significant differences were found for gender and age group (P<0·001).
Factors associated with Chinese Food Pagoda Score
The range of total CFPS in the study participants was 0–7·5, with no participants meeting the recommended intakes for all ten food groups. Of the older people, 61·9 % scored below 4 (1·2 % scored below 1, 7·1 % scored below 2, 22·6 % scored below 3 and 31·0 % scored below 4). CFPS scores were in an approximately normal distribution for each gender (Fig. 2).
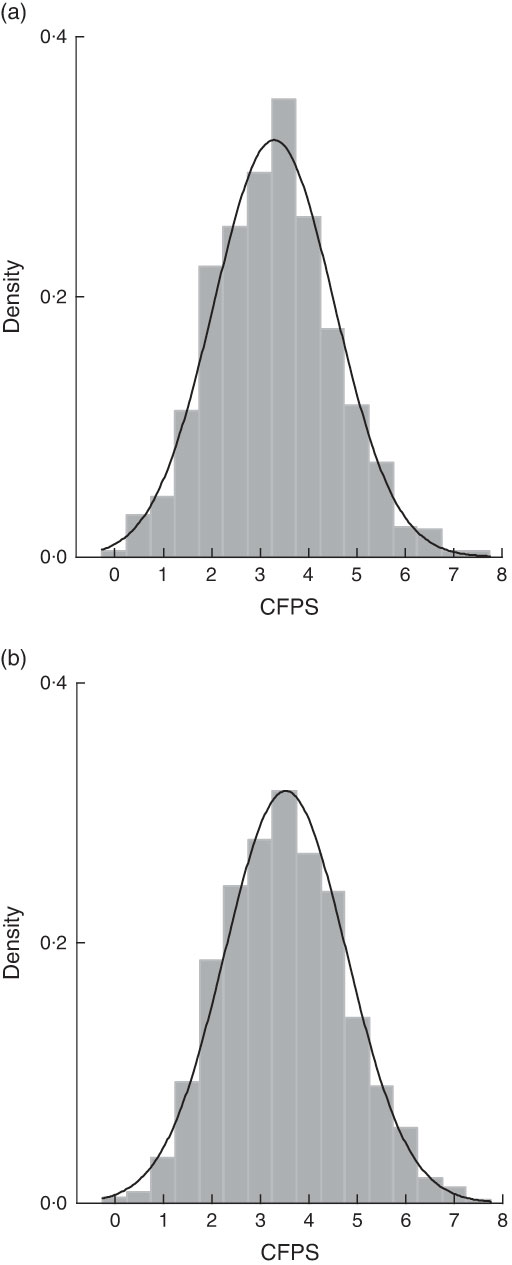
Fig. 2 The distribution of total Chinese Food Pagoda Score (CFPS) of older Chinese people (n 2745), according to gender (a, men; b, women), China Health and Nutrition Survey 2009 (![]() , density; ———, normal CFPS distribution)
, density; ———, normal CFPS distribution)
We used both univariate and multivariable linear regression models to assess the association between total CFPS and predictor factors. The final multivariable model shows there were significant associations between total score and gender, BMI, education level, work status, urbanicity level and socio-economic region (Table 3).
Table 3 Linear regression models for total Chinese Food Pagoda Score (CFPS) of older Chinese people (n 2745) according to predictor factors, China Health and Nutrition Survey 2009
Coeff., coefficient; Ref., referent category.
† Final multivariate model after adjustment for gender, BMI, work status, education level, urbanicity level and region.
Women had 0·26 higher total CFPS than men (P<0·001; 95 % CI 0·16, 0·36). People undertaking paid work had 0·16 lower total CFPS than those were not working (P=0·005; 95 % CI −0·27, −0·05). Compared with people who were illiterate, those with high education had higher total scores (0·35 higher, P<0·001; 95 % CI 0·18, 0·53). There were no statistically significant differences between people in the illiterate group and the low or medium education group (P>0·05). People categorized as obese had a 0·30 lower score than the people with normal BMI (P<0·001; 95 % CI −0·46, −0·12). Compared with the people living in low urbanicity areas, those living in medium and high urbanicity areas had higher scores (P<0·001). People living in the Northeast of China had the highest score, whereas people living in Central China had the lowest score, which was 0·53 less than the people living in the Northeast (P<0·001; 95 % CI −0·67, −0·40). People living in the East Coast and West had 0·23 and 0·16 lower score than those living in the Northeast, which were significantly different (P<0·05).
As there were significant differences between CFPS according to region and also urbanicity level, we used a margin plot to show the marginal mean total CFPS in three urbanicity levels across four regions (Fig. 3). Differences in total CFPS between high and medium urbanicity areas across the four regions were small, but there were large differences between high/medium urbanicity areas and low urbanicity areas, especially for the people who lived in Northeast and Central China. People living in high urbanicity areas of the Northeast had the highest score, while people living in low urbanicity areas of Central China had the lowest score. There were only slight differences between the three levels of urbanicity in the West of China.
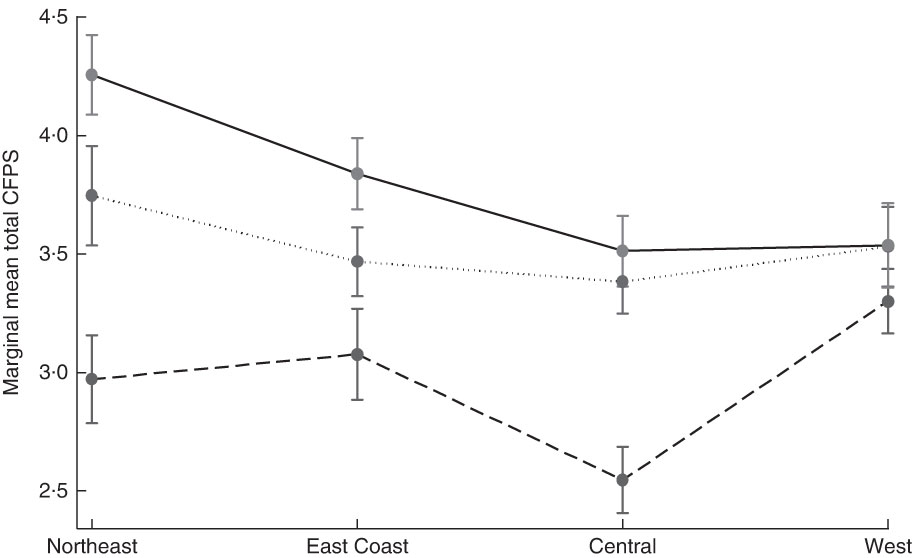
Fig. 3 Marginal mean total Chinese Food Pagoda Score (CFPS) of older Chinese people (n 2745) by urbanicity level (![]() , low;
, low; ![]() , medium;
, medium; ![]() , high) across four regions in China, China Health and Nutrition Survey 2009. Values are means with standard deviations represented by vertical bars, and are adjusted for gender, BMI, work status and education level
, high) across four regions in China, China Health and Nutrition Survey 2009. Values are means with standard deviations represented by vertical bars, and are adjusted for gender, BMI, work status and education level
Discussion
The present study is a cross-sectional analysis of dietary intake of an older population enrolled in the CHNS in 2009. Findings indicate that intakes of recommended food groups in the CFP are poor (especially for fruit and dairy). There is a need for improvement in the dietary intake of older Chinese people.
Almost no older Chinese people met the recommended intake for dairy. Lack of dairy intake results in insufficient consumption of Ca, which may lead to osteoporosis and bone fracture, especially in older people( Reference Tang, Eslick and Nowson 35 ). A nationally representative survey in China showed that Ca deficiency is a serious problem affecting people of all ages( Reference Wang and Li 36 ). The major reason for the low dairy consumption may be China’s extremely low per capita supply of dairy products. Although the supply of dairy products increased from 3·0 to 16·7 kg/capita per year between 1980 and 2003, it is still much lower than the average (49·3 kg/capita per year) for developing countries. China accounts for only 3·5 % of world total dairy production( Reference Wang and Li 36 ).
The present study shows that many people exceeded the recommended intake for oil (65 %), grains, potatoes and beans (63 %), salt (59 %) and meat (41 %). Excessive amounts of grains, oil and meat may lead to high consumption of carbohydrate and fat, which can influence the development of NCD and chronic conditions (e.g. type 2 diabetes( Reference Boling, Westman and Yancy 37 , Reference Nielsen and Joensson 38 ), obesity and overweight( Reference Reynolds, Gu and Whelton 39 ), hypertension( Reference He and MacGregor 40 )). However, the CDG and CFP do not have recommended intake amounts based on different types of grains, meat and oil. Thus we cannot examine the recommended intake based on different types of carbohydrate and fat. Previous studies have shown that different types of carbohydrate and fat have different effects on people’s health( Reference Dixit, Azar and Gardner 41 , Reference Siri-Tarino, Sun and Hu 42 ). For instance, consumption of polyunsaturated fat instead of saturated fat has been shown to lower the risk of CVD( Reference Siri-Tarino, Sun and Hu 42 ). Therefore the CFP needs to be improved to provide more detailed food group categories, especially given that China is experiencing a rapid acceleration of nutritional and epidemiological transitions, with an increasing prevalence of NCD( Reference Popkin 43 ).
The present study explored factors that may impact on adherence to the CFPS. We found that, compared with people who had normal BMI, people who were obese had lower CFPS, which indicates a low adherence to the CFP. Previous studies have found that dietary intakes are strongly associated with socio-economic factors, such as gender, education and income level( Reference Turrell, Hewitt and Patterson 44 ). The results of these previous findings are confirmed by our present study, as we also found that CFPS were strongly associated with gender and education level. Furthermore, we found large and significant differences in CFPS between the three levels of urbanicity (P<0·001), with people living in high urbanicity areas having higher scores than people living in low urbanicity areas. This is possibly due to the strong association between urbanicity and income level( Reference Sicular, Ximing and Gustafsson 45 ). Although income and social class inequality( Reference Sicular, Ximing and Gustafsson 45 ) may impact on food access and diet quality discrepancies( Reference Larson, Story and Nelson 46 , Reference Darmon and Drewnowski 47 ), limited studies have been done in this field in China. This indicates the need for further research.
Moreover, different CFPS in the three urbanicity levels across four regions suggests that there are considerable variations in dietary habits. As there are strong associations between dietary habits and NCD( 3 , Reference Mente, Koning and Shannon 48 , Reference Shi, Lien and Kumar 49 ), there are likely to be corresponding differences in disease burden between different urbanicity levels in China( Reference Tian, Zhao and Li 50 – Reference Dai, Sriboonchitta and Zi 52 ). Accordingly, preventing the increasing burden of disease from NCD requires a targeted approach that takes into account the differences in dietary patterns across different socio-economic and urbanicity areas.
Previous studies have evaluated dietary intake by comparing dietary guidelines in different countries. Most of these studies show that only a small proportion of people meet the dietary guidelines( Reference Ball, Mishra and Thane 4 , Reference Mishra, Schoenaker and Mihrshahi 5 , Reference Usfar and Fahmida 53 ). There are no previous studies that evaluate the dietary intake of ageing populations against the CFP in China. One study evaluated Chinese adults’ adherence to dietary guidelines by creating a Chinese Food Pagoda Score( Reference Yu, Zhang and Xiang 16 ). However, the limitation of this score( Reference Yu, Zhang and Xiang 16 ) system is that it does not set maximum cut-off points for grain intake or minimum cut-off points for meat and egg intake. Thus it cannot accurately indicate the overall dietary intake for the Chinese population. Zhang et al.( Reference Zhang, Chen and Chen 15 ) used the CFP to evaluate adolescents’ dietary intake in one city (Guangzhou) in China and found that no adolescents met all eight food group recommendations (excluding salt and oil intake data), with more than one-third of adolescents not meeting any food group recommendations( Reference Zhang, Chen and Chen 15 ). These findings are similar to our current study in which we applied the CFP to older Chinese people. Moreover, our study evaluated salt and oil intakes, enabling a greater assessment of dietary intake based on CFP.
Although the CDG and CFP have been used as powerful practical tools for nutrition education for the prevention of NCD( Reference Ge, Jia and Liu 11 ), our results would suggest that the impact of the CDG and CFP has been limited, especially for older people. As China is ageing rapidly, and the prevalence of NCD is increasing( Reference Wu, Guo and Kowal 54 ), more targeted actions should be taken by the government to increase dissemination and uptake of mass educational messages for older Chinese people. Education programmes need to stress the importance of meeting the dietary intake recommendations of the CDG and CFP in order to prevent NCD in later life. Further, although the CDG provides general guidelines for older people, this population group may also have specific dietary needs and are at high risk of an unbalanced diet( Reference Brownie 55 ), requiring age-specific dietary intake guidelines for healthy older people as well as those with specific chronic conditions.
The strengths of the present study include the use of individual, consecutive 3 d recall methods to improve the accuracy of recall and hence the analysis and results( Reference Shi, Hu and Yuan 56 ). The score system not only demonstrates individual food group consumption, but also evaluates the overall dietary intake for older people. The examination of dietary intake over four diverse socio-economic regions of China has allowed a more detailed, contextual analysis to be undertaken for a large sample of older Chinese people, in two age cohorts. Moreover, use of the urbanicity index helps us to capture details of population density, physical, social, cultural and economic environments, rather than just an absolute threshold of population and/or population density based on urban and rural measurement. However, some limitations may apply. Based on CFP, we are only able to evaluate the diet quantity, which may not evaluate the overall diet quality based on our CFPS. For instance, we cannot evaluate cereal consumption based on the type of cereal (e.g. wholegrain or refined). The CHNS does not present national data and the westernmost region of China is excluded from this study.
Our findings suggest that most older Chinese people are not meeting the dietary guidelines for prevention of NCD. With the population ageing rapidly in China, and the importance of diet in preventing NCD, healthy eating among older Chinese is crucial. Governments should develop age-specific dietary intake guidelines to promote healthy ageing and reduce the burden of disease for older people. Moreover, targeted government education programmes to promote adherence to recommended dietary guidelines that recognize the regional differences are also vital for preventing increases in NCD in China.
Acknowledgements
Acknowledgements: The authors thank Cassie Curryer, Research Centre for Gender, Health and Ageing, for editing assistance. Financial support: The present analysis received no specific grant from any funding agency in the public, commercial or not-for-profit sectors. It was supported by infrastructure and staff of the Research Centre for Gender, Health and Ageing, who are members of the Hunter Medical Research Institute, University of Newcastle, Australia. The present analysis used data from the China Health and Nutrition Survey (CHNS). The CHNS data collection and analysis, files from 1989 to 2011 and future surveys, are supported by the National Institute of Nutrition and Food Safety, China Center for Disease Control and Prevention; the Carolina Population Center (grant number 5 R24 HD050924); the University of North Carolina at Chapel Hill; the National Institutes of Health (NIH; grant numbers R01-HD30880, DK056350, R24 HD050924 and R01-HD38700); and the Fogarty International Center, NIH. The China–Japan Friendship Hospital, Ministry of Health provided support for CHNS 2009. X.X. received a scholarship in gender, health and ageing research funded by the University of Newcastle, Australia. Conflict of interest: None. Authorship: X.X. conducted the analyses and wrote the manuscript. J.H., J.B. and Z.S. guided the data analysis procedure and reviewed the manuscript. All authors approved the final version of the manuscript. Ethics of human subject participation: The CHNS was approved by the institutional review committees of the University of North Carolina at Chapel Hill and the National Institute of Nutrition and Food Safety, China Centre for Disease Control and Prevention. Use of the CHNS data for the present analysis was approved by the University of Newcastle, Australia (approval number H-2013-0360).


