


School meal provision has a long history in Sweden, dating from the 19th century. A free warm lunch for all pupils in compulsory school has been enshrined since 1997 in the Education Act(1). School meals in other countries have been shown to contribute significantly to overall healthy dietary habits(Reference Raulio, Roos and Prattala2), yet monitoring of school meal quality in Sweden has historically not received much attention. National guidelines exist for school food, as do national nutritional guidelines(3), but are not compulsory. The legislation has recently been revised and from July 2011 explicitly states that school meals must also be ‘nutritious’, i.e. fulfil Swedish nutritional recommendations(4).
Exactly how this new requirement will be interpreted or enforced by national authorities remains to be seen at the time of writing (June 2012). Other countries with large-scale school meal programmes often issue nutrient-based standards or food-based standards, or both(5, 6). Nutrient-based standards require nutritional analysis software coupled to an accurate database, plus the competence to use it and interpret the results. A recent survey in Sweden suggested that one in five municipalities has no catering manager and that only 40 % currently nutritionally analyse their school food menus(7). The US Department of Agriculture, responsible for the US National School Lunch Program, has recently eschewed its ‘nutrient standard menu planning’ approach in favour of its ‘food-based menu planning’(8), citing simplicity and easier communication of the standards among its reasons.
In early 2010, in anticipation of this new legislation, we began developing an instrument that could objectively and simply evaluate school meal quality, at school level. School meal quality is a broad construct consisting of several domains, just one of which is nutritional adequacy. The present paper describes the processes involved, which aimed to:
1. Operationalize the construct ‘school meal quality’ and develop a feasible, valid and reliable instrument appropriate for use by all Swedish primary schools.
2. Develop and evaluate the predictive criterion validity of relevant nutrient-specific food-based criteria that can assess the nutritional adequacy of a school's food provision.
Methods
Operationalization of the construct ‘school meal quality’
The purpose was to identify all critical areas/domains that should be included in an instrument that aims to measure the complex construct ‘school meal quality’. In spring 2010, key persons and stakeholders in the area of school food were identified, some using the ‘snowball method’ where contacted persons nominated other persons in turn (Table 1). We identified three main themes in advance that the instrument should cover (Fig. 1a), based on previous work done on this area(Reference Lundmark9, Reference Callmer and Friedl10), and held a series of consultations on these themes with relevant experts. Brainstorming techniques led to a list of six domains, namely: (i) food and meal availability (e.g. meal choice/assortment); (ii) nutritional adequacy (i.e. type of foods provided); (iii) safe food (i.e. hygienic food, provision for special diets); (iv) service and pedagogy (e.g. the meal environment, integration of meal/mealtimes into the school day); (v) environmental impact (e.g. monitoring of waste, transport, organic foods); and (vi) organization and policy (e.g. staff education, policies).
Table 1 Semi-governmental bodies and organizations represented in the expert panel

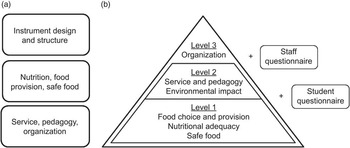
Fig. 1 The instrument and its domains: (a) the themes of the initial three expert panel consultations; (b) the final version of the instrument and all included domains. The shape illustrates the order and indicates the relative size of each level and the expected time required for completion. Within each level, all questions are compulsory, but Levels 2 and 3 are optional. Questionnaires for students and staff to provide their subjective opinions about the school meal quality are also available to the schools
Design of the instrument
Questions in all six domains were drafted and sent to the experts for written comment and subsequently revised where necessary. Care was taken to formulate the questions as clearly and unambiguously as possible. The questionnaire was tailored, meaning sections were hidden where not relevant (i.e. no further questions asked about breakfast quality if breakfast not served). Questions primarily took the form of ‘select’ questions where the answer is selected from a (visible) list. Explanatory text was provided for many questions, but this was carefully worded so as not to influence the respondent's choice. Potential answers were carefully chosen to cover every possibility, including sometimes ‘not relevant’. Every question had a ‘don't know’ option so that a respondent would not be forced to pick an incorrect answer in order to progress. All questions within a level were obligatory as this eased tailoring of the questionnaire, coding of the answers and generation of the automatic feedback. Open-ended questions were avoided for the opposite reason and to reduce respondent burden. For the pilot study, questions were assigned to two levels: Level 1 contained obligatory questions in all six domains and Level 2 contained optional questions in most domains. Feedback from the pilot study was generally positive but persistent concerns about the high respondent burden prompted us to reduce Level 2 and create a Level 3, both optional (Fig. 1b). An important feature was added to the final version, after all tests and validation studies: as soon as Level 1 is completed, users can download a detailed report for the school that shows the school's answers and through the use of user-friendly colour-coding highlights areas that the school excels at and those that the school should improve.
Development of food-based criteria
Criteria were developed for specific nutrients that allow the instrument to judge if a school's food provision is likely to fulfil/is likely to almost fulfil/is unlikely to fulfil the Swedish Nutrition Recommendations (SNR), based on the school's responses to certain food-related questions. Relevant nutrients of concern in the prevailing diets of Swedish school-aged children were identified based on reviews of both published literature (e.g. reports from small-scale studies on food habits(Reference Patterson, Wärnberg and Kearney11)) and grey literature, including national non-binding guidelines for school food(3), national nutritional recommendations(Reference Alexander, Anderssen and Aro12) and the most recent national survey of food habits in children(Reference Barbieri, Pearson and Becker13), namely: high intakes of saturated fat and sugar, and low intakes of polyunsaturated fats, iron, vitamin D and fibre. Questions based on significant and/or rich sources of these nutrients in the Swedish diet were developed which make up four food-based criteria (FBC), one for each nutrient (Table 2). The answers to each of these questions resulted in a score of 0, 1 or 2, which were then summed and used to give an overall score for each nutrient. Certain questions were weighted. A detailed description of the calculation of the criteria can be provided on request.
Table 2 The four nutrient-specific food-based criteria
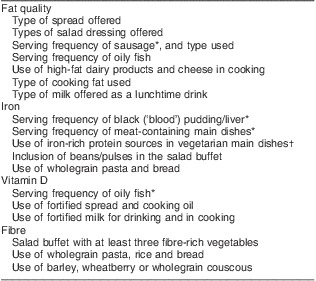
*The criterion is weighted in the calculation of the overall score for each nutrient.
†Considered a criterion only if a vegetarian main dish is served more often than once weekly.
Pilot study
The purpose of the pilot study was to test the instrument on a small scale and identify gross inconsistencies in the data gathered. In autumn 2010, principals and catering managers in all 141 municipally run primary schools in Stockholm city (Fig. 2) were contacted by both email and regular mail and invited to participate. School catering managers were also informed about the study by the municipal catering manager at a meeting. In order to assess the concurrent validity of the school's answers to questions provided by the school in the online instrument concerning nutritional adequacy and selected other parameters, an on-site observation was performed using a printed version of the questions(Reference Oppenheim14). Before the study began, a random selection was made of fifteen schools to be visited after completion of the questionnaire, covering all kitchen types – those that produce all food on-site, those that receive the main warm dish from another kitchen, those that serve >500 portions and <500 portions. A proportionate number of schools of each type were chosen at random. A further fifteen replacement schools were similarly chosen. If a selected school completed the questionnaire, the school could be visited; if it did not, a replacement school that completed the questionnaire was chosen. Schools were verbally informed that they may be chosen for a visit, but were not informed of their selection until the morning of the intended visit, when the school catering manager was contacted by telephone and asked if they would consent to the visit. The purpose of the short notice period was to reduce the risk of influencing the observation. One observer (M.S.) visited the kitchen and serving area and recorded observations for comparison against the answers provided by the school. The observer also recorded any problems/opinions the school had about the instrument. Agreement between the observer's observations and the school's answers was used to judge the concurrent validity of the school's responses.
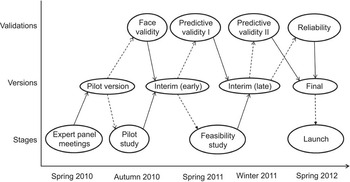
Fig. 2 Timeline showing the stages of development of the instrument ( $$$\raster="fx1"$$$ = led to the development of/changes to;
  $$$\raster="fx2"$$$
= was used in)
$$$\raster="fx2"$$$
= was used in)
Estimation of face validity
Based on user feedback from the pilot study certain questions were reformulated. These questions were sent to the expert panel for a systematic assessment of face validity. Experts were asked to rate each question from 1 (not important) to 4 (very important). A final meeting was held to discuss the content with the panel in February 2011.
Feasibility study
The aim was to gather baseline data prior to the introduction of the new nutritional requirements for school lunches and to establish the feasibility of the instrument on a larger scale. Data were collected from March to June 2011 (Fig. 2). A nationally representative random sample of 10 % (n 429) of all schools with at least twenty-nine enrolled pupils was made using the Swedish National Agency for Education's registry. For each school nine replacement schools were also identified. Schools were sent an invitation letter, informing of the purpose of the study, that participation was voluntary and how their data would be handled. Schools were also contacted via email, and reminder emails and a postcard were sent. If a school declined to participate, or did not contact us after a certain length of time, the first replacement school was contacted and if necessary a subsequent replacement school was contacted for as long as the study continued. The schools were invited to complete as many levels of the instrument as they wished. In order to be considered a participant, completion of at least Level 1 was required. At the end of each level were a number of evaluation questions. Rate of participation, representativeness of the study sample and user satisfaction with the instrument were used to indicate feasibility.
Predictive criterion validation I
We validated the ability of the nutrient-specific FBC to assess nutritional quality using the results of a nutritional analysis of school menus as the reference standard. We used pre-existing menus which had already been entered into a commercial menu-planning programme. School menus were selected by a contact person at the planning service, de-identified and made accessible to us. The menus were to be chosen for their level of detail and completeness and not on nutritional quality. Of the twenty provided, one was on closer inspection found to be insufficiently detailed and was subsequently excluded. In order to increase the variability of the menus (n 19), they were duplicated and the accompaniments (salad, bread and spread) were standardized such that any actual accompaniments were replaced with two standards: one optimal (good salad, high-fibre bread, low-fat spread) and one suboptimal (poor salad, low-fibre bread, high-fat spread).
A lunch should provide 30 % of energy and nutrients according to the SNR(Reference Alexander, Anderssen and Aro12) and less than 10 % of energy from saturated fat. Each new menu (n 38) was classified according to the results of the nutritional analysis as meeting the SNR, almost meeting the SNR and not meeting the SNR (see Table 3). Based on the information in the menus, the questionnaire was then completed by one researcher (K.L.) and schools were classified according to the FBC as likely fulfilling/possibly fulfilling and unlikely to fulfil recommendations for each nutrient. The predictive validity of the FBC, i.e. the ability of the criteria to correctly predict the nutritional adequacy, was analysed.
Table 3 Nutrition recommendations for lunch and the corresponding requirements (in parentheses) for children in the age range 10–13 years
SNR, Swedish Nutrition Recommendations; RDI, Recommended Daily Intake.
The categories of ‘SNR almost met’ and ‘SNR not met’ were defined by us for the purpose of the validation.
*Based on recommendations for adults of 2·5 g/MJ.
Predictive criterion validation II
The second validation was similar to the first with the following amendments: the nutritional analysis was based on information gathered in person from schools, rather than pre-entered menus and standardized accompaniments; the nutrient-specific FBC had been revised according to the results of the first validation study; and some questions had been revised slightly. Schools were visited by one observer (L.O.) to collect menus from a convenience sample of two municipalities without centrally administered menus or municipal catering managers. The school catering managers were contacted by letter and telephone in alphabetical order of the schools until at least six in each municipality had agreed to participate. During the visit, recipes for 4 weeks plus other relevant information about school food provision (i.e. type of milk, bread, salad buffet, etc. typically offered) were gathered. The schools were instructed to complete the questionnaire basing their answers on those 4 weeks, and to do so within 2 weeks of the visit. The observer (L.O.) also completed the questionnaire based on the information gathered at the school, approximately 1 month after menu collection. For the validation study these answers were used as the reference, to eliminate potential user error. To increase the sample size, twelve new menus were created by pairing the original menus at random twice and calculating the mean of these new pairs. As in the previous validation, the menus (n 24) were nutritionally analysed and classified according to the SNR, and from the questionnaire answers the schools were classified using the FBC. As before, the predictive validity of the FBC for each nutrient was evaluated.
Reliability
As this instrument is designed to be used repeatedly by schools, we tested the inter-rater reliability of the instrument, comparing the school's results with those of the observer from criterion validation study II.
Statistical analysis
Descriptive statistics were used to analyse the results of the face validation study, pilot study and feasibility study. The representativeness of the sample in the feasibility study was assessed by χ 2 tests. The results of predictive criterion validation study I and II were analysed using measures of specificity, sensitivity, positive predictive value and the likelihood ratio where possible. Cohen's weighted κ (interpreted according to Altman's scale(Reference Altman15)) was also calculated to evaluate agreement between nutritional adequacy as determined by the FBC and the results of the nutritional analysis. Inter-rater reliability was assessed using inter-class correlation for continuous variables and percentage agreement for categorical variables. Statistical analysis was performed using the statistical software package IBM SPSS Statistics version 20. Nutrition analysis was performed using Mashie (Mashie AB, Sweden). All random selections were carried out by assigning random numbers generated by SPSS to units and then choosing units in ascending order.
Results
Pilot study
Of the 141 schools in Stockholm city, eighty-six participated. All schools that completed the questionnaire and that were eligible to receive a visit consented to the visit. Schools were visited a mean of 10 d (sd 7 d, range 2–22 d) after they had completed the questionnaire. For a number of questions the concurrent validity between the school's answers and the observer's was poor (data not shown). In subsequent versions of the instrument these questions were either revised (by rephrasing the question, clarifying the accompanying explanatory text, or altering the layout of the question to make it more user-friendly) or else removed.
Face validity
In total, eleven experts rated the face validity of the instrument after revisions arising from the pilot study. The mean score for all 110 questions was 3·6 out of 4. Only six questions had a score of less than 3·0. Of these, four no longer appear in the final version, one was revised and one (on number of portions served) is not included in any FBC and was kept, unchanged.
Feasibility study
In total, 695 schools were contacted (429 original and 266 replacement schools). The response rate (i.e. those that completed Level 1) was 27 % (n 191). Of those schools that completed Level 1, 64 % (n 122) went on voluntarily to complete Level 2 and of those 97 % (n 118) continued to Level 3. Responses to the evaluation questions indicated that 73 %, 89 % and 94 % of schools thought that Levels 1, 2 and 3, respectively, were ‘relatively easy’ or ‘very easy’ to answer. The median (self-reported) time required was 60 min for Level 1, 15 min for Level 2 and 10 min for Level 3.
Participating schools were statistically representative of the source population (i.e. all schools with twenty-nine or more pupils) in terms of geographical spread (i.e. three main geographical regions), school organizational form (municipality-run or privately run) and school size (29–100 pupils, 101–300 pupils or 301+ pupils).
Predictive criterion validation I
Of the four FBC, three had at least ‘good’ agreement with the results from the nutritional analysis (Cohen's weighted κ > 0·60, data not shown). Specificity and sensitivity were both above 70 % with the exception of sensitivity of the FBC for iron, which also had the lowest κ value (data not shown). Based on these results, the FBC were revised in preparation for the second validation.
Predictive criterion validation II
The predictive validity of the revised nutrient-specific FBC is shown in Table 4. Results are presented as two-way tables for meeting/not meeting SNR and a rating of satisfactory (i.e. likely to fulfil SNR)/unsatisfactory (i.e. likely to almost fulfil/unlikely to fulfil SNR) according to the FBC.
Table 4 Criterion validity of the nutrient-specific FBC compared with results of a nutritional analysis
FBC, food-based criteria; SNR, Swedish Nutritional Recommendations; PPV, positive predictive value; NA, not applicable (indicates that the value cannot be calculated because of cells with zero counts).
*Positive likelihood ratio.
†Validated against SNR for saturated fat.
Reliability
For continuous variables which contributed to an FBC, the inter-class correlation ranged from 0·33 to 0·99 (fair to almost perfect agreement; Table 5). For categorical variables the raters assessed all of the components consistently in between eight and twelve (out of twelve) cases.
Table 5 Inter-rater reliability for the nutrient-specific FBC and their components
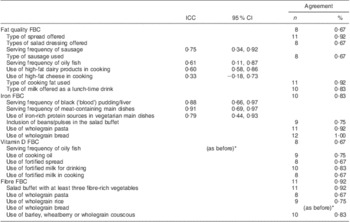
FBC, food-based criteria; ICC, inter-class correlation (continuous variables).
*The component is previously listed in the table.
Discussion
We have developed a comprehensive web-based system to enable schools to evaluate their meal quality with a relatively simple, user-friendly instrument. The construct ‘school meal quality’ was operationalized into six domains: (i) food and meal availability; (ii) nutritional adequacy; (iii) safe food; (iv) service and pedagogy; (v) environmental aspects; and (vi) organization and policy. To the best of our knowledge this system is thus unique in terms of scope. The instrument has been evaluated for feasibility, face and criterion validity, and reliability. Valid nutrient-specific FBC have been developed that can predict the nutritional adequacy of a school's food provision.
The pilot study was designed to test the instrument on a small scale and to identify gross inconsistencies. That the visit of the observer took place in some cases a few weeks after the school used the instrument is unlikely to have affected the outcome as the school received no feedback about what changes to make and no advance warning about whether it was chosen for a visit. The feasibility study had a relatively low response rate. Contact with schools occurred only via mail/email and no personal contact was made, which is likely to have affected the likelihood of participation negatively(Reference Galea and Tracy16). In addition, no registry of school or municipality catering managers exists, making it difficult to contact these target groups directly. However, the final sample was still representative. The design of the instrument is intended to reduce perceived respondent burden and the positive user evaluation indicates that the instrument is indeed feasible. That the instrument is entirely web-based means that, due to the high penetration of Internet access in Sweden, it should be accessible in every school. It also makes possible one of the key features for users of the system – automatic tailored feedback that illustrates clearly the school's responses. The instrument is tailored, making it appropriate for every school's situation (by concealing questions irrelevant for a given school). Questionnaires for pupils and staff are also available as optional components, which have great potential for linkage of individual- and school-level data in the future.
The FBC can be thought of as screening tests for identifying schools with nutritionally adequate school meals. As with all such tests, some misclassification (i.e. false positives and false negatives) is to be expected(Reference Altman and Bland17–Reference Grimes and Schulz19). The criteria have been validated in two separate studies. The accuracy (schools correctly classified by the FBC) was very high for three FBC and somewhat lower for the fourth (iron), although the relatively small sample sizes mean that a further validation is warranted. We intend to validate these criteria again after the instrument has launched and a larger quantity of data is available. The FBC were originally developed based on a priori knowledge of dietary sources of these nutrients. Although this is a common method for the development of dietary scores and indices(Reference Kant20, Reference Arvaniti and Panagiotakos21), a complementary approach is the a posteriori method(Reference Newby and Tucker22). With ‘real-world’ data we may be able to develop data-driven criteria whereby schools that have nutritious school food are first identified and their menus are then analysed for the food choices/patterns that characterize them.
We attempted to validate a more nuanced grading of nutritional quality (SNR fulfilled/almost fulfilled/not fulfilled) in criterion validation II, but due to the low variability in the menus a large number of cells had zero counts which made this unfeasible. Both sets of menus, from both studies, had very little variability in terms of vitamin D and saturated fat, as very few met the SNR, and in criterion validation study II all menus met the SNR for fibre. We cannot draw conclusions from criterion validation study I as we adjusted the main fibre sources for the study. This low variability is not necessarily a flaw in our study design, and may well just reflect the general quality of school menus. When more data are available we will be able to confirm this.
The inter-rater reliability showed fair to almost perfect results, particularly for the continuous variables. A κ statistic for the categorical variables would have been desirable but the many cells with zero counts made this unfeasible. However, the measure of percentage agreement does indicate reasonable agreement. A reliability analysis will be repeated with a larger sample.
The instrument has a number of limitations. The FBC focus on just four nutrients. However, in the absence of official standards that identify exactly which nutrients must be taken into consideration when planning school meals, we chose these four which we deemed crucial based on known issues in prevailing dietary trends in children. A high intake of salt is also a concern, but it was not considered feasible for the instrument to be able to capture salt content as so much is consumed in processed foods. The instrument does not attempt to capture the provision of fruit and vegetables, which are important markers of a high-quality diet. This was deemed unfeasible as the school lunch is always a cooked meal, and vegetables are very often incorporated into dishes and are therefore likely to be difficult to report accurately. The instrument does however capture fruit and vegetable provision for breakfast and snacks. It should be noted that the standard against which the criteria have been validated – nutritional analysis – is, while an appropriate method, not without problems. One source of error is that data on processed foods are often incomplete for nutrients and minerals and even saturated fat, which can lead to under/overestimations of content(Reference Harrison23). This may partly explain why according to the nutritional analysis schools did not reach the iron recommendations, but according to our criteria they did.
This system serves several important purposes. It will: (i) allow us to describe school food provision at various administrative levels (school, municipality and national); (ii) enable monitoring of the implementation of the new law concerning school food; (iii) provide feedback to schools upon which to base efforts for improvement; and (iv) provide data for research on school meals and health outcomes. Information from other data registries such as those on child growth or academic performance, and on school and municipality characteristics, will allow research questions about the importance of school meals for public health to be addressed. This system can potentially be expanded to evaluate the food systems of other public sector institutions, such as hospitals or care facilities for the elderly.
This system could potentially be adapted with relative ease to other countries wishing to take a similar comprehensive approach to evaluating school meal quality. Monitoring systems in other countries with established school lunch programmes vary, and due to the often decentralized nature of school meals, a unified national monitoring system is uncommon. In England, for example, audits of school caterers are conducted by a municipality employee(6). In the USA, the US Department of Agriculture conducts surveys of school food provision and of food consumption at pupil level periodically(Reference Gordon, Crepinsek and Briefel24). Estonia and Finland are two other countries with universal school meal provision where large-scale studies are conducted but a national monitoring system is currently lacking, although the need has long been identified(Reference Raulio, Roos and Prattala2).
The instrument can in future be expanded to reflect new standards and guidelines. This is a considerable strength of this system – it is flexible and can be updated as necessary. It also means that data can be processed and aggregated soon after collection, so that information on school food provision can be disseminated promptly. The instrument is available at www.skolmatsverige.se.
Acknowledgements
Source of funding: This project was funded by the Swedish Association of Local Authorities and Regions, the National Institute of Public Health, the Department of Agriculture and Stockholm County Council. Conflicts of interest: No author has any conflict of interest to declare. Authors’ contribution: E.P. designed the instrument, performed statistical analyses and wrote the manuscript; K.L., M.S. and L.O. gathered data, performed nutritional analysis and statistical analyses; A.-K.Q. designed the instrument; L.S.E. designed the study and wrote the manuscript. All authors critically revised the manuscript and approved the final version. Acknowledgements: The authors thank the SkolmatSverige expert panel for their considerable input, Maria Ramsten for data collection during the feasibility study and all participating schools.


