


The Norwegian government has formally designated the Sami people as the indigenous people of Norway. The Sami live in the northern part of Scandinavia and in the Kola Peninsula of Russia. Norway has the greatest proportion of the total Sami population. Previous studies have reported differences in Fe status between indigenous groups and the majority population, mainly because of differences in dietary Fe intake(Reference Milman, Byg and Mulvad1). A study from areas with both Sami and non-Sami inhabitants in central and northern Norway described differences in Fe levels between Sami and non-Sami populations(Reference Broderstad, Melhus and Lund2). The inland Sami had significantly higher serum ferritin (s-ferritin) than the coastal Sami and non-Sami populations, independent of sex. In addition, mean transferrin saturation was higher for inland residents, especially for male participants.
In northern Norway, there has been substantial social interaction between the Sami and non-Sami populations for several generations. However, some special characteristics in dietary traditions have influenced the Sami dietary habits, such as high consumption of reindeer meat by inland Sami and marine fish by coastal dwellers.
The s-ferritin level is the most specific biochemical test that correlates with total body Fe stores, and has been used as a key parameter in several epidemiological studies to assess Fe status(Reference Broderstad, Melhus and Lund2–Reference Milman5). Serum apoferritin (s-apoferritin) is included in measured s-ferritin and is an acute-phase reactant protein elevated in infectious, inflammatory and malignant diseases. However, the recent SAMINOR study(Reference Broderstad, Melhus and Lund2) on Fe levels indicated that acute infection or inflammation was not prevalent in the study population. The high mean Fe levels among inland Sami groups could not be explained by differences in alcohol consumption, since the Sami participants consumed less alcohol compared with non-Sami participants. A likely explanation is differences in dietary habits.
The aim of the present study was to investigate whether dietary habits could account for the observed differences in Fe status between the Sami and other Norwegian participants in the SAMINOR survey.
Methods
The SAMINOR study
A cross-sectional population-based study of health and living conditions in areas with a mixed Sami and non-Sami population, referred to as the SAMINOR study, was carried out in central and northern Norway in 2003–2004. The present study covered municipalities in Norway for which >5–10 % of the population was reported in the 1970 Census to be Sami(Reference Aubert6). In addition, some specific districts were included from municipalities with an overall lower proportion of subjects with Sami ethnicity. The SAMINOR study was the responsibility of the Centre for Sami Health Research, Institute of Community Medicine at the University of Tromsø, in collaboration with the National Screening Program for Cardiovascular Diseases (SHUS; now incorporated into the National Institute of Public Health). The study is described in detail by Lund et al.(Reference Lund, Melhus and Hansen7). Study materials were collected from January 2003 to April 2004.
Subjects
In total, 16 538 men and women aged 36–79 years participated in the SAMINOR study and gave informed consent for medical research. The response rate was 61 %. Participation rates for the coastal and inland areas were 59·6 % and 65·5 %, respectively. More women than men participated, 65·6 % v. 56·6 %, respectively. Information about ethnicity and Fe status was available for 14 630 persons.
Screening
Non-fasting blood samples were obtained at enrolment. Blood samples were drawn by venepuncture at normal venous pressure in sitting position. Serum was separated immediately and s-ferritin, s-Fe and transferrin were measured by standard techniques used routinely in the clinical laboratory. s-Ferritin measurements were taken with a Hitachi Modular P analyser (Roche Diagnostics, Mannheim, Germany); details of the analytical methods used have been described previously by Broderstad et al.(Reference Broderstad, Melhus and Lund2). In the current statistical analyses, we chose only s-ferritin as a measure of Fe status so as to limit the length of the paper. Fe depletion is defined as s-ferritin concentrations <13 μg/l, which is consistent with earlier surveys(Reference Milman, Byg and Ovesen3, Reference Milman, Ovesen and Byg8). The WHO defines Fe depletion to occur when s-ferritin <15 μg/l(9).
Body weight (in kg, one decimal) and height (in cm, one decimal) were measured using an electronic height and weight scale with the participants wearing light clothing without shoes. According to WHO, underweight is defined as BMI < 18·5 kg/m2, standard weight as between 18·5 and 24·9 kg/m2, overweight as between 25·0 and 29·9 kg/m2 and obese as ⩾30·0 kg/m2(10).
C-reactive protein (CRP) concentrations were measured with a turbidimetric assay. The method was standardised against 470 (RPPHS – Reference Preparation for Proteins in Human Serum).
FFQ data
The dietary cluster analysis was based on FFQ data(Reference Brustad, Parr and Melhus11). Respondents were asked to report their usual intake of the following foods: fruit, berries, cheese (all types), potatoes, cooked vegetables and raw vegetables/salad. Questions were asked about the usual intake of different beverages. In addition, the respondents were asked questions about traditional and modern food items assumed to be a part of the current diet of the study population.
Dietary habits
Information on consumption of different foods, both modern and traditional, was obtained through questionnaires with a food frequency design, as described in detail by Brustad et al.(Reference Brustad, Parr and Melhus11). On the basis of factor and cluster analyses for fifty-six different food variables, Brustad et al.(Reference Brustad, Parr and Melhus11) defined five different dietary groupings or patterns: ‘reindeer’, ‘fish’, ‘average’, ‘fruit and vegetables’ and ‘Westernised, traditional marine’. The reindeer pattern was characterised by frequent consumption of reindeer meat and other reindeer products, in addition to moose meat and cured/salted fish. The use of boiled (non-filtered) coffee was also frequent in this cluster. The second pattern was named ‘fish’ because it consisted of subjects with frequent use of all marine food items in the questionnaire. Pattern three was labelled ‘average’ and characterised by average intakes of most food items, except whole milk, and processed fish (smoked or cured/salted), which were significantly higher in this group. In addition, this pattern showed a high intake of both boiled (non-filtered) and ‘other’ coffee, as well as sausages, pork and mutton. The fourth pattern was labelled ‘fruit and vegetables’ because of the frequent intake of these items in addition to water, tea, pasta and chicken. The last pattern was named ‘Western, traditional marine’. This was dominated by Westernised products such as hamburgers, pizza, sausages, casseroles, pork and beef. This pattern also had the highest frequency of the traditional food, namely, fish liver and hard roe, in addition to whale meat and filtered coffee. These dietary patterns are used to assess the effect of food habits on Fe stores.
Ethnicity
The sample was divided into three ethnic groups: (i) Sami I – speaking the Sami language for three generations (all grandparents, both parents and the participants used Sami as the language spoken at home); (ii) Sami II – mixed group with Sami and non-Sami affiliation (at least one Sami indicator as Sami language, ethnic background or self-perceived ethnicity); and (iii) the remaining population – non-Sami. Each of these groups was divided into inland and coastal domiciles.
Reference groups
The reference groups in the multiple linear regression analyses were the youngest age groups, the non-Sami group, those consuming the average dietary pattern and the normal weight group in each category.
Ethical approval
All participants gave written informed consent before screening. The study was accredited by the Regional Board of Research Ethics in Northern Norway, including the Sami consultant of the Board. The survey is in accordance with the Helsinki Declaration of 1975. The National Data Protection Authority (Datatilsynet) gave approval for storing of individual information and for later linkages.
Statistical analyses
Analyses were stratified by sex. Since distributions for s-ferritin showed positive skewness, concentrations were logarithmically transformed (log(e) scale), which resulted in normal distributions. s-Ferritin concentrations are reported as geometric means and their 95 % CI. Differences in Fe levels across ethnic groups were tested by ANOVA, stratified for geographical residence and two age groups (36–49 and 50–79 years). The Tukey–Kramer test was used for pairwise comparisons. ANCOVA was used to test for differences in Fe levels between geographical residences, adjusted for age group and ethnicity. Age-adjusted effects of ethnicity, BMI and dietary habits on log-ferritin were modelled by multiple linear regressions for inland residents only. Finally, log-ferritin was the dependent variable in a predefined multiple regression model, mutually adjusting for ethnicity, age group, BMI and dietary habits. We used the SAS statistical software package version 9·1 (SAS Institute, Cary, NC, USA).
Results
Table 1 shows selected characteristics of the study participants. Sami affiliation was reported by 4932 participants (34 %) for whom s-ferritin was available. Almost 80 % of the individuals had BMI >24·9 kg/m2. Obesity rates were somewhat higher in women than in men: 21·5 % v. 17·4 %, respectively. Mean s-ferritin levels for men and women were 99 (95 % CI 97, 101) μg/l and 42 (95 % CI 41, 43) μg/l, respectively.
Table 1 Selected characteristics of the study sample (n 14 630)Footnote *
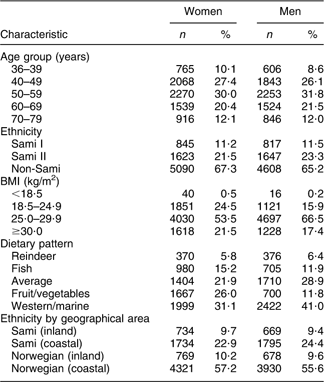
* Subgroups may not add up to 14 630 for all variables because of missing values.
Twenty-one (0·30 %) men and twenty-two (0·29 %) women had CRP between 50 and 100 mg/l. In addition, seven (0·09 %) men and five (0·06 %) women had CRP > 100 mg/l. None of them had s-ferritin >300 μg/l. The linear association between CRP and s-ferritin was weak but significant (r = 0·06, P < 0·0001). Seven individuals had s-ferritin >1000 μg/l, but all had CRP < 10 mg/l.
Distribution of Fe stores
The mean s-ferritin level was significantly higher for men than for women, independent of ethnic affiliation. Levels by age group, ethnic and geographical categories (both sex) are presented in Table 2. Regardless of ethnicity, s-ferritin levels for men declined with advancing age, whereas they increased after the age of 50 years for women. There was a significantly higher s-ferritin concentration among inland participants compared with coastal residents (both sexes). For inland men, the Sami I group aged 36–49 years had a significantly higher mean s-ferritin than the Sami II group (Tukey–Kramer test). The Sami I group also had significantly higher mean s-ferritin than the non-Sami group (Tukey–Kramer test). Inland women older than 50 years in the Sami I group had significantly higher mean s-ferritin than the corresponding Sami II and non-Sami groups (Tukey–Kramer test). Table 3 shows mean s-ferritin by dietary patterns. The reindeer group had significant higher mean s-ferritin in both sexes when adjusted for age.
Table 2 s-Ferritin by geographical area and ethnicity for 14 630 participants in northern Norway: the SAMINOR survey
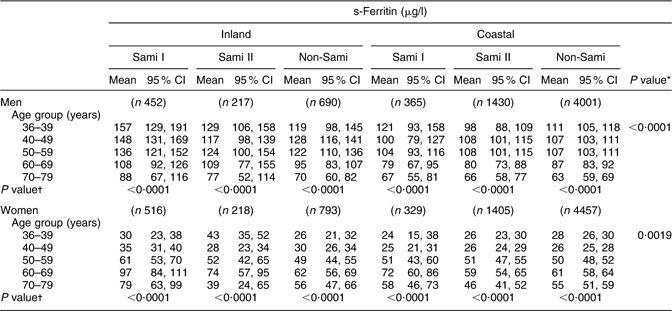
s-Ferritin, serum ferritin.
*Test for differences between geographical areas adjusted for age and ethnicity.
†Test for differences between age groups.
Table 3 s-Ferritin by dietary pattern for 14 630 participants in northern Norway: the SAMINOR survey
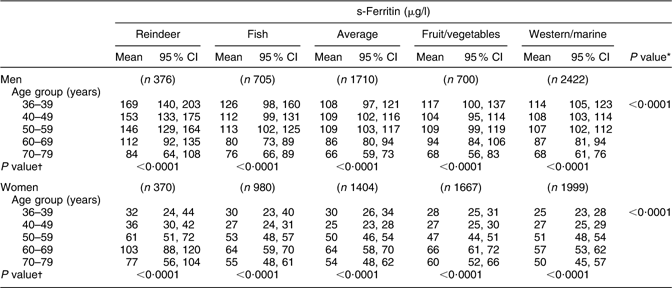
s-Ferritin, serum ferritin.
*Test for differences between dietary patterns adjusted for age.
†Test for differences between age groups.
For the coastal settlements, there were no differences in mean s-ferritin between ethnic categories. Table 4 presents mean transferrin saturation by dietary patterns. Transferrin saturation showed less variation than s-ferritin both among men and women. Mean transferrin saturation in the reindeer group was slightly higher compared with that in the other dietary clusters in both sexes. Transferrin saturation decreased significantly with increasing age, especially among men in the reindeer group.
Table 4 Transferrin saturation by dietary pattern for 14 630 participants in northern Norway: the SAMINOR survey
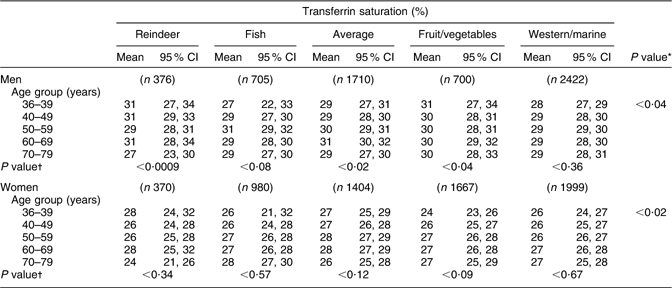
*Test for differences between dietary patterns adjusted for age.
†Test for differences between age groups.
Fe levels influenced by dietary patterns
Table 5 presents the results from multiple linear regression analyses for the effects of age, ethnic groups, geographical residence, BMI and dietary patterns on s-ferritin, stratified by sex. In this model, all independent variables were mutually adjusted for each of the other variables, men and women separately. For both sexes living inland, the reindeer dietary subgroup, overweight (25·0–29·0 kg/m2) and obesity (⩾30·0 kg/m2) were positively associated with s-ferritin. s-Ferritin among obese individuals was 25 % higher in women (β = 0·22) and 43 % higher in men (β = 0·31), compared with the normal weight group (18·5–25·0 kg/m2). In women, the Sami I group was positively associated with higher s-ferritin.
Table 5 Effect of age, ethnicity, geographical area, BMI and dietary pattern on serum ferritin level: results from multiple linear regression analyses
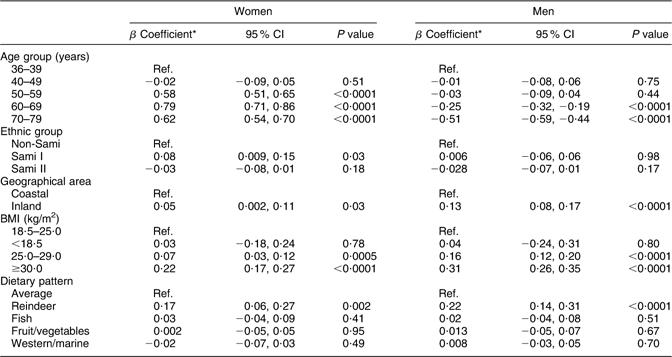
Ref., reference group.
*Mutually adjusted for each of the other variables, men and women separately.
In a final model, all independent variables were mutually adjusted for each other; in addition, an interaction term was included between the effects of ethnicity and geographical residence (Table 6). In this model, the positive association between s-ferritin and Sami I disappeared. Inland residence was, however, significant among men. Other lifestyle factors such as light/hard physical activity, and, in addition, for women the number of childbirths, were considered as confounders. However, they were not added to the model as they did not change the associations presented in Tables 5 and 6.
Table 6 Effect of age, ethnicity where interaction of geographical area is included, BMI and dietary pattern on serum ferritin level: results from multiple linear regression analyses

Ref., reference group.
*Mutually adjusted for each of the other variables, men and women separately.
Discussion
In the present cross-sectional survey of the Sami and non-Sami population in northern Norway, we have observed an association between s-ferritin level and several lifestyle factors. Participants who frequently consumed reindeer meat and other reindeer products had higher levels of s-ferritin than did individuals with other dietary patterns. However, the reindeer pattern individuals also had the highest proportion of subjects with overweight and obesity.
In the SAMINOR survey, food consumption frequency was estimated, although the questionnaire did not cover the total diet. The questionnaire was not designed to cover the total diet but rather to gather information on the use of selected foods relevant for the northern area. The analyses of food patterns, rather than of single nutrients, are considered an alternative way to focus on diet and health outcomes, because nutrient intake could not be derived from the FFQ(Reference Newby and Tucker12, Reference Jacques and Tucker13). Brustad et al.(Reference Newby and Tucker12) have published dietary pattern analyses from the SAMINOR survey, which showed that ethnicity did not play a major role in predicting dietary patterns, except for the reindeer group of foods in inland areas(Reference Brustad, Parr and Melhus11, Reference Brustad, Parr and Melhus14). For coastal settlements, marine fish and different types of meat constitute primary nutritional sources for both ethnic groups. Dietary traditions are important markers for cultural identity. Because of changes in occupation among indigenous people, such as from primary trades to service professions, traditions are being altered that can affect dietary patterns. In addition, increased access to many different food products also establishes new food habits. These changes are global and are described, among others, by Kuhnlein et al.(Reference Kuhnlein, Receveur and Soueida15) for Arctic indigenous people in Canada. However, in inland areas in northern Norway, reindeer meat is easily accessible and has a high Fe content of 3·8 mg/100 g wet weight(16). Frequent use affects Fe levels. The present study showed that geographical residence, inland, had a significant influence in both sexes. Sami I women had significantly higher s-ferritin levels compared with the comparable groups. To examine interactions between ethnic groups and those living inland, interaction terms were created. The combined effect of both exposures is less than the combination of their separate effects, which means that it is unlikely that ethnicity is the explanation for higher s-ferritin levels. The causality is most probably explained by dietary habits, geographical settlement and BMI. It is therefore unlikely that genetic inheritance will explain the observed differences between ethnic groups.
Overweight and obesity had a significant effect on s-ferritin in both sexes. The study showed a high prevalence of overweight and obesity in the study population. The reindeer pattern had the highest proportion of subjects with overweight. A newly published article from the same series, the SAMINOR study, showed that both obesity and central obesity were most pronounced in Sami women, whereas the opposite was true for men(Reference Nystad, Melhus and Brustad17). General obesity among Sami women has been previously reported by Njølstad et al.(Reference Njølstad, Arnesen and Lund-Larsen18) in 1998. However, data on the prevalence of metabolic syndrome in this population are not available at present, but can be a crucial confounding factor in this context. The metabolic syndrome is a cluster of unfavourable health factors such as obesity, insulin resistance, dyslipidaemia and hypertension(Reference Alberti, Zimmet and Shaw19, Reference Wilsgaard and Jacobsen20). These core components are all metabolically related cardiovascular risk factors. Individuals with metabolic syndrome have an increased risk of developing atherosclerosis and CVD. s-Apoferritin is a part of measured s-ferritin and is an acute-phase reactant protein elevated in infectious, inflammatory and malignant diseases. High levels of acute-phase reactants such as high-sensitivity CRP and Fe stores have been reported to correlate with metabolic syndrome(Reference Mainous, Wells and Everett21, Reference González, Guerrero and Soto22). The presumed reason is that inflammation plays a key role in the development of atherosclerosis. Obesity-related insulin resistance and inflammation are generally considered to be central elements in the pathogenesis of metabolic syndrome(Reference Dandona, Aljada and Bandyopadhyay23, Reference Mainous, Wells and Everett24). Elevated s-ferritin levels are also associated with increased diabetes mellitus risk among healthy individuals, where s-ferritin is an important and independent predictor of the development of diabetes(Reference Forouhi, Harding and Allison25).
Fe may contribute to the pathogenesis of type 2 diabetes mellitus by inducing oxidative stress and interfering with insulin secretion. Glucose and macronutrient intakes cause oxidative stress and inflammatory changes(Reference Dandona, Aljada and Bandyopadhyay23). The increased concentrations of TNF-α and IL-6, associated with obesity and type 2 diabetes, might interfere with insulin action by suppressing insulin signal transduction. This might interfere with the anti-inflammatory effect of insulin, which in turn might promote inflammation(Reference Dandona, Aljada and Bandyopadhyay23). Chronic overnutrition (obesity) might thus be a proinflammatory state with oxidative stress.
The pro-inflammatory state of obesity and metabolic syndrome originates with excessive energy intake and is probably a result of overnutrition leading to clinical and biochemical manifestations of the metabolic syndrome.
However, the study revealed a few participants with elevated CRP. Nevertheless, the reindeer pattern individuals continued to have significantly higher s-ferritin after including the interaction term as well. This was the case in both sexes, although overweight and obesity were not as pronounced among Sami men. Another factor that affects Fe levels is coffee consumption. A high rate of intake inhibits Fe absorption(Reference Milman, Ovesen and Byg8, Reference Skikne and Baynes26). The habit of coffee consumption is prevalent among the Sami I group and reindeer pattern members, but it has no apparent negative association with s-ferritin. On the other hand, Nystad et al.(Reference Nystad, Melhus and Brustad27) found that total coffee consumption in the same population was positively associated with total cholesterol levels. Dyslipidaemia may therefore be a confounding variable in this relationship.
Food patterns and health-related behaviours such as the level of physical activity may confound an association with s-ferritin. In a 1993–1994 Norwegian survey of the adult population, a quantitative FFQ was used to evaluate dietary habits and to relate these to other lifestyle factors(Reference Johansson, Solvoll and Bjørneboe28). That survey showed that daily total intakes of vitamins B1 and B2, Ca and Fe by men and women were higher among the youngest age groups compared with the older participants. In women, intakes of vitamin C was highest in the oldest age groups. However, regardless of age, women did not have adequate intakes of vitamin D and Fe. In another study conducted in 1996 of breast cancer among Norwegian female citizens, dietary habits were analysed on the basis of an FFQ involving approximately 10 000 women(Reference Hjartåker and Lund29). In addition, the study showed that older women did have a more vitamin C-rich diet than the younger participants. Although these surveys were national, they did not focus specifically on ethnic groups or geographical areas. A smaller study conducted among a Sami population living in traditional reindeer herding areas of northern Norway concluded that, traditionally, there is low consumption of fruit and vegetables among inhabitants of northern Norway, especially among the elderly(Reference Nilsen, Utsi and Bonaa30). However, the sample size was small.
Conclusion
The present study shows that there is an association between s-ferritin and lifestyle factors. High level of s-ferritin may reflect high intake of reindeer meat. However, no causal relationships between Fe stores and reindeer meat consumption can be inferred from the present study. The differences in Fe status described earlier between inland Sami and non-Sami can be explained by several factors such as food habits, age and obesity. Clearly, being overweight and obese are associated with s-ferritin levels. On the basis of our findings, additional analyses on metabolic syndrome and Fe overload in the present population should be carried out.
Acknowledgements
Funding for this project was provided by the Norwegian Ministry of Health. The authors have no conflict of interest to declare. E.L. and A.R.B. designed and conducted the research; A.R.B. and M.M. analysed the data; A.R.B., M.B., M.M. and E.L. wrote the paper; A.R.B. had primary responsibility for the final content. All authors read and approved the final manuscript. The authors are indebted to the participants in the SAMINOR study who made this research possible. They also thank the staff at the Department of Clinical Chemistry, University Hospital of Northern Norway, for technical assistance and careful evaluation of the blood tests.


