


Dietary sodium has been the object of much recent attention. Marion Nestle, Professor of Nutrition and Public Health at New York University, has identified salt reduction as ‘the new frontier of concerns about health’(Reference Nestle1). In Canada this new frontier has prompted, among other things, the formation of Health Canada’s Sodium Working Group (SWG) in 2007, heightened interest in the potential of front-of-pack labelling (for sodium) in processed foods, increased debate over the place of both federal regulations and consumer education, and resulted in recommendations for public targets for reducing salt levels in prepared foods. In short, Nestle’s ‘new frontier of concerns about health’ means particular scrutiny of the ‘old frontier’ staples: the processed foods that account for over 75 % of consumers’ daily sodium intake(Reference Flegel, Magner and Hébert2, Reference Garriguet3).
In December 2009, the SWG recommended that food manufacturers mount voluntary reductions in the amount of sodium added to processed foods. This ‘targeted approach’(Reference Rynor4) is to be developed ‘in consultation with Canadian food industry’ and intends to have ‘very visible and public targets’(Reference Rynor4). Such established guidelines are clearly necessary: as the Center for Science in the Public Interest detailed in its recent report Salty to a Fault, even though some companies ‘have made impressive efforts to reduce sodium levels in their foods … wide variations [exist] in the amounts of sodium in otherwise similar packaged and restaurant foods’(Reference Jeffery and Cappello5).
Canada’s sodium situation, with its recommended targeted approach to processed foods and wide-ranging sodium levels for similar packaged edibles, calls for a closer examination of processed foods, reference amounts and distances from proposed targets. Of particular interest are the foods specifically targeted at toddlers (age 12–36 months) and children. This is for three core reasons. First, results from the 2004 Canadian Community Health Survey reveal that 1- to 3-year-olds ingested an average of 1918 mg Na daily, while 4- to 8-year-olds had daily average intakes of 2700 mg(Reference Garriguet3). Such intakes far exceed the Adequate Intake (AI) levels of 1000 mg (for toddlers) and 1200 mg (for children aged 4–8 years) recommended by the US National Academies Institute of Medicine (IOM)(6). Although sodium consumption at all ages is of concern(Reference Garriguet3), young children have a lower Tolerable Upper Intake Level (UL) than adults (the IOM has set the daily UL at 1500 mg, 1900 mg and 2200 mg Na for children aged 1–3, 4–8 and 9–13 years, respectively(6)). Due to these lower set-points, children exceeding the AI may be consuming proportionately more sodium than their adult counterparts.
Second, and no less important, is that these categories of foods – ‘toddler foods’ and ‘kids’ foods’ – are routinely overlooked by Canadian researchers interested in nutrition, health and policy. Available assessments of sodium levels in packaged foods tend to focus on general categories of food (such as cereals, crackers, cheese and cookies; see e.g. reference (Reference Jeffery and Cappello5)) rather than specifically targeted edibles, thus leaving a knowledge gap when it comes to the overall profile of sodium in children’s and toddlers’ foods.
Finally, this focus on children’s products dovetails with ongoing concerns over marketing of food to children. In November 2009, the WHO released twelve Recommendations on the Marketing of Foods and Non-Alcoholic Beverages to Children(7); Recommendation 1 is to reduce ‘the impact on children of marketing of foods high in saturated fats, trans-fatty acids, free sugars, or salt’ (italics added). Similarly, Recommendation 12 encourages research focused on ‘policies to reduce the impact on children’ of marketing these high-sugar, high-salt or high-fat foods.
In light of the high dietary sodium intake of young children, the knowledge gap surrounding sodium in children’s foods and the WHO recommendations, examining sodium levels in packaged foods targeted at young children is warranted. The current study critically assesses the sodium in packaged foods designed for young children in the Canadian supermarket. It profiles the sodium levels in both toddler and child-oriented foods, identifying the products (and categories of products) that are of concern; it also analyses children’s foods in light of the 2012 ‘salt reduction targets’ set out by the UK Food Standards Agency (FSA). Finally, the study provides per-serving-size data (scaled) by combining the dietary reference intakes for sodium published by the IOM and Canada’s Food Guide recommendations for toddlers and children.
Materials and methods
Content analysis was used to create two separate profiles of food products designed for young children in the Canadian retail environment. One profile was created for 183 baby and toddler food products currently sold in the Canadian marketplace; another, for 354 ‘fun foods’ targeted at children. Data collection and analysis were done over a 12-month period in 2009. For every product purchased, the brand, product name, food category, food type, ‘target’ eater and nutrition information (including the serving size and sodium per serving) were recorded. Digital photographs were taken of all products for record-keeping and fact-checking.
Identification of baby and toddler foods
Baby and toddler food products are shelved in one section/aisle of stores, and self-identify on the package as baby or toddler foods. To ensure a comprehensive profile of the available products, researchers visited and purchased baby and toddler food products from nine venues in Calgary, Alberta, in August 2009: the venues included five grocery stores, two drug stores and two department stores.Footnote * Given the (relatively) small number of baby and toddler food products, which are dominated by particular brand lines, this adequately represents the universe of baby/toddler foods available in Calgary.
Duplicate products were not included in the study. Also excluded were infant formulas and infant cereals designed to be mixed with breast milk or water,Footnote † as well as juices and beverages, and simple purées of vegetables and fruits. The final 183 products comprised puréed ‘dinners’ and baby food ‘desserts’, toddler ‘entrées’ and dinners, snacks (including biscuits, cookies, fruit snacks, toddler ‘snack bars’ and yoghurts) and some cereals.Footnote ‡,Footnote §
Identification of children’s foods/’fun foods’
Children’s foods or ‘fun foods’ are ‘regular’ supermarket foods that have been repackaged to appeal specifically to children. Fun foods exclude products in the obvious category of ‘junk food’ such as confectioneries, soft drinks, cakes, sodas, potato chips and cheezies; they include the cereals, cheeses, yoghurts, crackers, packaged entrées and other edibles that pointedly target children through packaging appeals – specifically the use of cartoon images, direct appeals to fun or play, foregrounding of strange shapes, unusual colours or unconventional tastes, and/or tie-ins with children’s television programmes, films or toys. Specific indicators of ‘fun food’ or children’s food, and criteria for inclusion in the sample, included
1. brands that specifically reference children in the name, or are marketed as designed specifically for children (e.g. EnviroKidz, Safeway’s Eating Right Kids, or President’s Choice Mini Chefs); or
2. at least one of the following aspects:
(a) direct claims or allusions to ‘fun’/play on the package;
(b) cartoon iconography pointedly directed to children;
(c) tie-ins with children’s television programmes, merchandise or films;
(d) the foregrounding of strange shapes, unusual colours or unconventional tastes;
(e) puzzles or games targeted at children.
The children’s foods were purchased from Calgary’s two major grocery store chains, The Real Canadian Superstore and Safeway. Loblaw Companies Limited (parent to The Real Canadian Superstore) is the largest player in the Canadian food retail market, both in terms of revenue and number of stores. Canada Safeway Ltd is one of Loblaw’s major competitors. Selecting products from these two stores makes the study comprehensive, but also generalizable: most stores carry the same national brands and the products in one grocery store are typically consistent with those found in another. As with the baby and toddler foods, duplicate products were not included in the study.
Data analysis
Summary statistics were used to assess and compare products in general food categories (such as Dry Goods) and selected sub-categories (such as crackers or cereal), and box plots were used to visualize five-number summaries. Next, children’s food products were compared with the UK FSA ‘salt reduction targets’ for 2012 for foods because Health Canada’s Food Directorate is considering the FSA approach as a model.Footnote * To facilitate this comparison, sodium content was referenced to the 100 g standard serving size, as per the 2012 FSA targets. Finally, the analysis considered the products’ per-serving sodium levels in light of the US IOM dietary reference intakes for sodium(6) and the daily servings prescribed in Canada’s Food Guide.
To provide the latter synthesis, we identified the per-serving sodium limits according to the following logic. Canada’s Food Guide recommends daily servings based on four food groups (Vegetables and Fruit; Grain Products; Milk and Alternatives; Meat and Alternatives); serving sizes in the Guide correspond to Schedule M of the Canadian Food and Drug Regulations.Footnote † Reasonably, one can argue that servings from the Vegetables and Fruit group (in their pure form) will contain minimal sodium. This leaves the remaining daily servings of Grain Products, Milk and Alternatives, and Meat and Alternatives as opportunities to ingest sodium (along with salt added during cooking and at the table). When these food groups are combined, there are a total of six, seven and eleven daily ‘serving’ opportunities to ingest sodium for children aged 2–3, 4–8 and 9–13 years, respectively. Per-serving limits can therefore be established. Children aged 2–3 years, for example, have six ‘servings’ to ingest their AI of 1000 mg Na but not exceed the UL of 1500 mg. This corresponds to 170–250 mg Na/serving, which is a conservative threshold due to the exclusion of the Vegetables and Fruit servings, whose inclusion would further reduce these levels. Children aged 4–8 years have (relatively) similar AI but slightly higher UL, giving 170–270 mg Na/serving, while children aged 9–13 years have (relatively) lower AI and UL, corresponding to 140–200 mg Na/serving.
Results
Of the 537 foods analysed, approximately 20 % (108 products) could be classified as having high levels of sodium.Footnote ‡ In the category of toddler foods 8 % (fifteen products out of 183) had high sodium levels; this increased to 27 % (ninety-five products out of 354) for children’s ‘fun food’.
Tables 1 and 2 detail the top ten products for high sodium content in toddler foods and children’s foods.
Table 1 Toddler products with highest sodium content (Calgary, Alberta, Canada, 2009)

Table 2 Child-oriented products with highest sodium content (Calgary, Alberta, Canada, 2009)
For toddler and child-oriented foods respectively, entrées and Lunchmates stand out for sodium, topping at 550 mg for Gerber’s Graduates for Toddlers Lil’ Entrées Chicken Pasta Wheel Pickups (187 g) and at 1330 mg for Schneiders Lunchmate Hot Dogs Big Combo (315 g). A toddler consuming this Gerber’s entrée would ingest 55 % of the AI for sodium and over three times a reasonable per serving intake of 160 mg. Children or teenagers eating a Schneider’s Hot Dogs Big Combo would ingest almost their daily AI in a single meal. As might be expected, these tables reveal that the closer a processed food product gets to approaching a complete meal (e.g. an entrée, a Lunchmate) the stronger the tilt in favour of high sodium.
Summary statistics for toddler foods and ‘fun foods’
Figures 1 and 2 present the summary statistics for the baby and toddler food category and the children’s food category, respectively. These figures flag several noteworthy items.
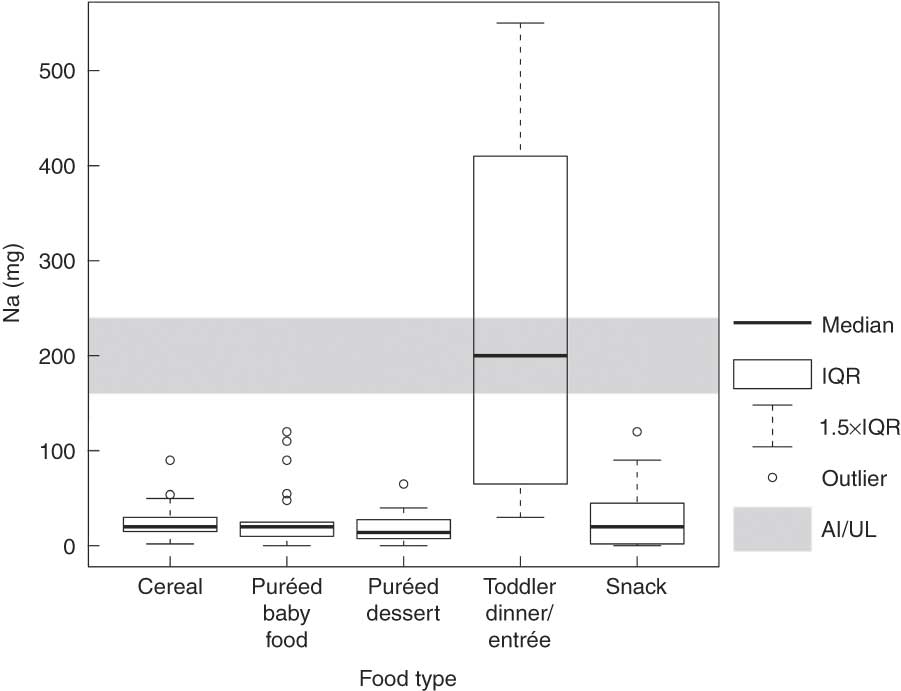
Fig. 1 Sodium content in baby and toddler food products (Calgary, Alberta, Canada, 2009). IQR, interquartile range (25th to 75th percentile); AI, Adequate Intake; UL, Tolerable Upper Intake Level
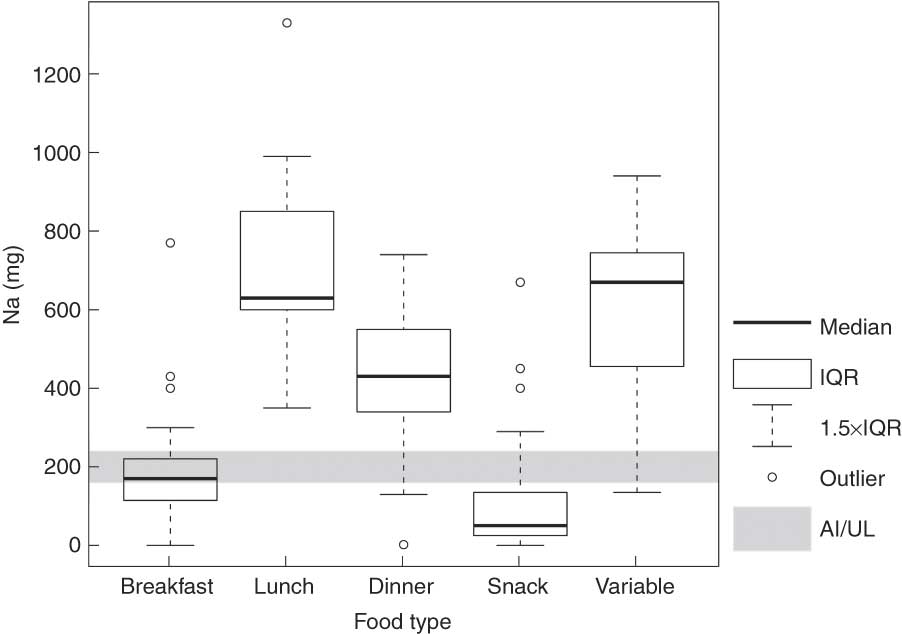
Fig. 2 Sodium content in child-oriented food products (Calgary, Alberta, Canada, 2009). IQR, interquartile range (25th to 75th percentile); AI, Adequate Intake; UL, Tolerable Upper Intake Level
Figure 1 reveals that toddler dinners/entrées are conspicuous for high sodium. Over half of the products exceeded 240 mg Na/serving, while some contained as much as 550 mg Na/serving (as identified in Table 1). While toddler snacks (such as cookies, biscuits and fruit snacks) and cereals, as well as baby food desserts, fell below the per-serving AI, the puréed baby food category raises a second point of consideration. Even though 75 % of the puréed baby food dinners contained less than 40 mg Na/serving, the category is not completely worry-free. Beech Nut’s Hearty Vegetable Stew, its Ham Dinner and its Creamy Chicken Noodle Dinner all contained over 110 mg Na/serving.
Equally significant is the finding that particular brands are conspicuous for promoting foods high in sodium: Beech Nut for baby food dinners, Gerber’s for toddler entrées and Schneiders for children’s packaged Lunchmates.
A focus on children’s food
Almost 90 % of the children’s products coded in the Refrigerated/Frozen Foods category exceeded the UL for per-serving sodium (using 240 mg Na/serving as a threshold). Products in this category include the Lunchmates and Pizza Pops identified in Table 2 (as well as products of a similar nature) and so will not be discussed further here. Instead, we concentrate on the Dry Goods category (and its sub-categories) because Dry Goods is the dominant category in the children’s foods analysed: it comprised 64 % of the total sample. More importantly, this category works to reveal certain challenges that arise from applying the FSA targets and Canada’s Food Guide recommendation.
Figures 3, 4 and 5 detail key sub-categories in the Dry Goods targeted at children, and illustrate how scaling influences the apparent sodium content of food. In all three figures the FSA targets (where applicable) are indicated by grey diamonds with black outlines. The rectangular grey swatch highlights the range between AI and UL: products falling within this grey band meet the per-serving AI sodium level for children and do not exceed the per-serving UL sodium level.
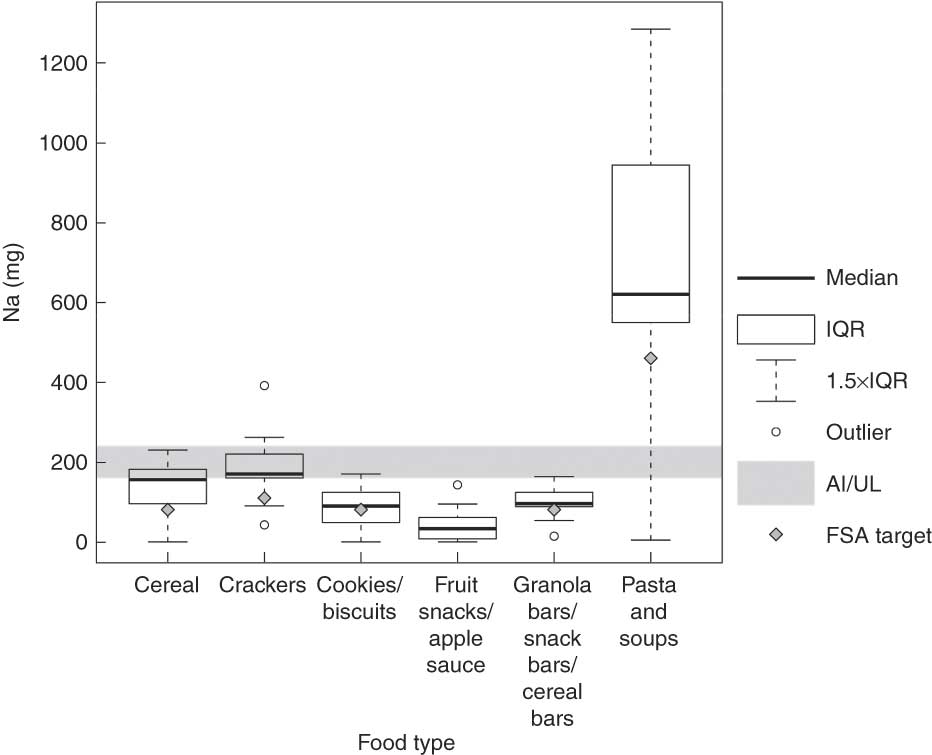
Fig. 3 Child-oriented Dry Goods products: sodium content scaled according to Schedule M (Calgary, Alberta, Canada, 2009). IQR, interquartile range (25th to 75th percentile); AI, Adequate Intake; UL, Tolerable Upper Intake Level; FSA, Food Standards Agency
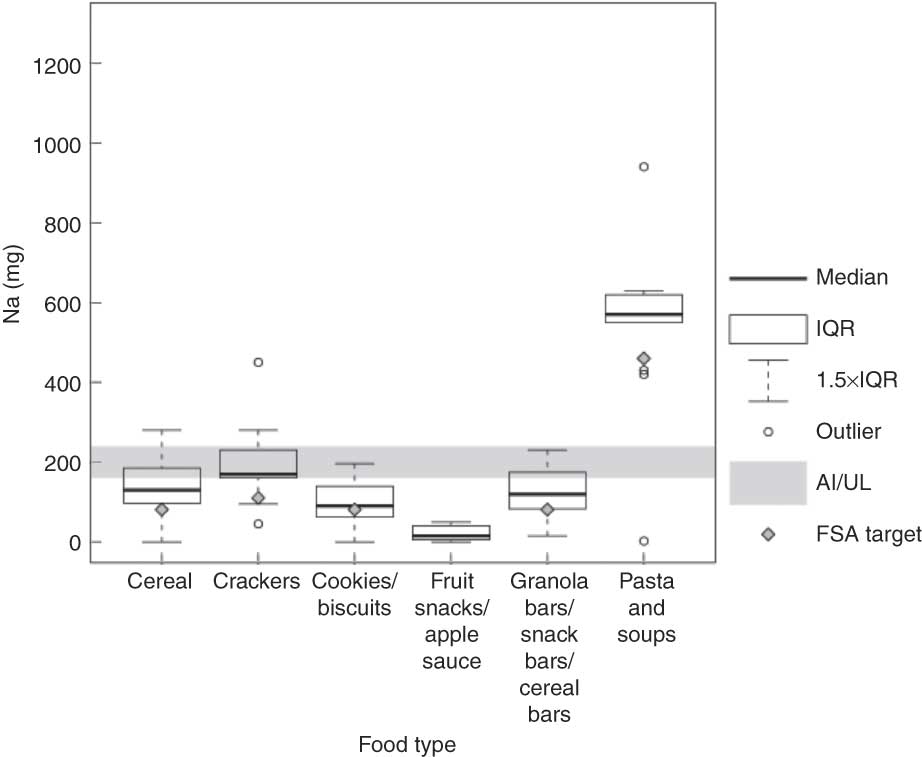
Fig. 4 Child-oriented Dry Goods products: sodium content (nominal) according to Nutrition Facts table (Calgary, Alberta, Canada, 2009). IQR, interquartile range (25th to 75th percentile); AI, Adequate Intake; UL, Tolerable Upper Intake Level; FSA, Food Standards Agency
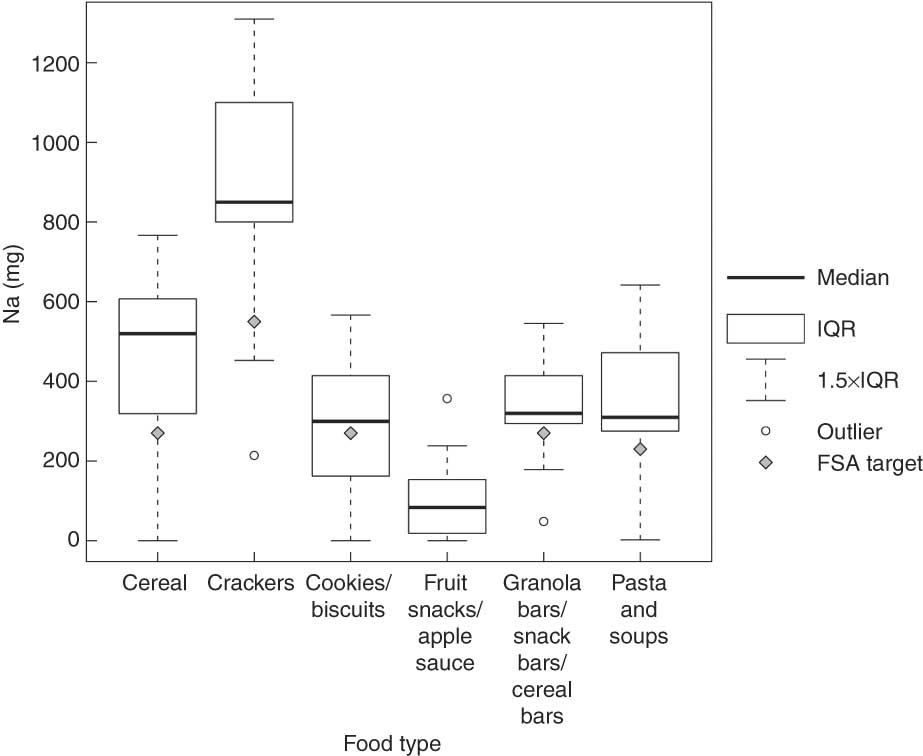
Fig. 5 Child-oriented Dry Goods products: sodium content by FSA reference amount (Calgary, Alberta, Canada, 2009). IQR, interquartile range (25th to 75th percentile); FSA, Food Standards Agency
Figure 3 presents the per-serving sodium content scaled according to Schedule M of the Food and Drug Regulations(8) (i.e. the specified ‘reference amount’ serving of the particular food) and Canada’s Food Guide recommended serving sizes. Figure 4 presents the per-serving sodium content as indicated on the Nutrition Facts table. Figure 5 presents the per-serving sodium content scaled according to the FSA reference serving size of 100 g.Footnote *
The figures reveal that the sodium levels in pasta and soup far exceeded the recommended maximum per-serving level of 240 mgNa and the FSA target amount of 230 mgNa/100 g, with the median per-serving level being 570 mg Na and the highest per-serving level topping 940 mg Na (Lipton Noodles with Monsters Inc. front-of-pack promotion). The Nutrition Facts table on canned pastas/soups typically presents serving sizes in half-can amounts, as becomes evident in the rescaling between Figs 3 and 4. It is important to emphasize that the low-sodium products in this category are dry pastas, not soups (dry or canned) or canned pastas.
Figures 3 and 4 further reveal that the sub-categories of cereal, crackers, cookies/biscuits, and fruit snacks/apple sauce generally fell within, and below, the AI/UL band when scaled according to Schedule M or viewed in light of the Nutrition Facts table. However, comparing Figs 3 and 4 reveals some interesting features that pertain to what we would label ‘stealth sodium’ and ‘subtle sodium’. Fruit snacks provide one instance of ‘stealth sodium’, in which a product, given its type, contains much higher sodium levels than a consumer might expect. Fruit snacks, most of which are better classified as candy, suffer under the Schedule M treatment, which provides a per-serving reference amount of 140 g for fruit or 40 g for dried fruit. Given that individually packaged fruit snacks typically range from 14 to 22 g, the per-serving sodium content appears exaggerated due to the fact that the serving amount (i.e. the individually packaged fruit snack) is significantly lower than the reference amount for fruit, whether fresh or candied. It is unlikely that someone would eat the boxes of Fruit Roll-Ups necessary to meet the reference intake target. Regardless, such sodium levels are worth considering because parents presumably will not think of scrutinizing apple sauce or fruit snacks for sodium. While consumers might be cautious about eating a box of crackers in terms of monitoring their salt intake, eating a number of fruit snacks is unlikely to raise the red flag of ‘what about the salt content?’ – yet this is especially important for young children, whose taste preferences are still being moulded. ‘Stealth sodium’, whether in terms of taste preference or unexpected sodium sources, is therefore worth considering.
‘Subtle sodium’ refers to the fact that sodium levels also can be unexpectedly subtle. When a product is literally sprinkled with salt, such as crackers, consumers might presume it to be particularly high in sodium or view it as a salty food. Yet children’s crackers are actually quite reasonable in terms of per-serving sodium, provided the recommended grain product (20 g) serving sizes are respected.
Figure 5 presents the Dry Goods category of children’s foods in light of the UK FSA-scaled data, which evaluates products by scaling them to a fixed reference amount of 100 g across all product categories. Perhaps the most remarkable aspect of Fig. 5 is that none of the Dry Goods analysed in light of the FSA targets actually met the targets. With the exception of the cookies/biscuits sub-category, all of the Dry Goods analysed had 75 % of the products – or more – with higher sodium levels than the FSA target.
Discussion
Focusing on sodium in packaged baby/toddler foods and children’s foods raises several points of interest. In light of AI/UL thresholds based on age and per-serving cut-offs, it appears that packaged foodstuffs for youngsters fare relatively well, with the exception of some problematic areas. While baby and toddler foods as a category contain reasonable levels of sodium, particular sub-categories (such as toddler entrées) have higher sodium content – underscoring the need for clear standards regarding, and perhaps regulation of, sodium levels in toddler foods. The basic fact that several outliers exist in sub-categories such as puréed baby food has particular implications for both parents and policy makers. As noted earlier, 75 % of the puréed baby food dinners contain less than 40 mg Na/serving. Yet some dinner purées contain over three times that amount of sodium, meaning that parents cannot generalize (or presume) across an entire sub-category of foods. Individual products can contradict dominant trends, and this equally points to the need for a regulatory standard to prevent such outliers from being produced and sold. Further, even though the recommended AI and UL provide population, and age-scaled, ‘benchmarks’ for daily sodium intake, they do not provide guidance for individual products. This is clearly problematic in light of a retail environment that promotes toddler entrées with 550 mg Na/serving or child-targeted packaged lunches containing upwards of 800 mg Na.
Child-oriented packaged foods: the issue of ‘stealth sodium’ and ‘subtle sodium’
Assessing child-oriented packaged foods reveals a larger area of concern given that approximately one out of every four products exceeds the UL for sodium. Particular categories of food stand out for sodium, including Refrigerated/Frozen Meals, Processed Meats, and to a much lesser degree, Dairy. Ninety-two per cent of the products (44/48) in the Refrigerated/Frozen Meals category exceeded the UL threshold of 240 mg Na/serving; 100 % of the Processed Meat products (6/6) exceeded the UL threshold; and 8 % of Dairy exceeded the UL (4/52). While the significant levels of sodium in packaged products like Lunchmates have already been observed, the concept of ‘stealth sodium’ – high sodium in unexpected places – is equally important. Black Diamond’s processed Fun Cheez in ‘fun’ dinosaur or fish shapes or shaped like moons and planets, for instance, have 414 mg Na when scaled to the 30 g serving size outlined in Schedule M of the Food and Drug Regulations. Some fruit snacks, as noted earlier, will have very high levels of sodium – up to 600 mg – when its individually packaged serving of 14 g is scaled to the FSA target (100 g) or to Canada’s Food Guide (40 g or 150 g per fruit serving). While it is much more likely for a child to consume a 30 g serving of processed Fun Cheez (414 mg Na) than a 150 g serving of Fruit Roll-Ups (536 mg Na) it is important to pay heed to ‘stealth sodium’ sources, given that such products also contribute to the daily intake.
‘Subtle sodium’, the notion that sodium levels can be unexpectedly subtle, does not entirely allay concerns. Children’s crackers, for instance, demonstrate reasonable levels of per-serving sodium provided the recommended grain product (20 g) serving sizes are respected. Yet serving sizes are not consistently respected; nutrition scholars suggest that consumers (including children) may eat two to three times the recommended serving size(Reference Neuman9). Across the border, this has prompted the US Food and Drug Administration to consider ‘bringing serving sizes for [certain] foods … into line with how Americans really eat’(Reference Neuman9).
The importance of measurement criteria in assessing sodium levels: possible deficiencies with FSA targets
This mention of serving sizes draws attention back to the impact of measurement on classifying the sodium levels in packaged children’s food. It is important to observe that the FSA scaling method (see Fig. 5) makes the target levels particularly sensitive in food types with low serving sizes, as it is effectively a percentage. For foods with smaller serving sizes (such as grains) this scaling tends to emphasize the sodium content. As such, crackers appear relatively high in sodium in Fig. 5 compared with Figs 3 and 4.
This is significant. When a product has a smaller serving size than the reference amount, the distance between the actual level and the target level is magnified. Affecting the sodium levels in crackers (for example) means changing the median sodium level by 60 mg/serving to meet the FSA reference target of 550 mg/100 g. The current median sodium level for 100 g of crackers is 850 mg; but their serving size is only 20 g, not 100 g (i.e. the Nutrition Facts serving size is one-fifth of the FSA reference amount).
Affecting the sodium levels in soups and pastas, on the other hand, means changing the median sodium level by nearly three times that amount: 160 mg/serving.Footnote * In short, the FSA method – or any other method that employs a fixed reference amount, ratio or percentage to evaluate sodium content – is highly sensitive to the difference between the reference amount and the actual real-world serving size for the product being considered.
In this light, comparing Fig. 3 (or Fig. 4) and Fig. 5 highlights two possible deficiencies with the FSA targets. First, in all food types except soups/pastas, the FSA target is lower than the AI per-serving sodium limit. Second, with soups/pastas, the FSA target is substantially higher than the UL per-serving sodium limit – so much so that a soup/pasta would need to count as two servings from Canada’s Food Guide in order to fall below the UL, even if it met the FSA target. More importantly, it would need to count as two of the sodium-containing servings. This is problematic because (as explained earlier) what we have counted as total servings has eliminated the Fruit and Vegetables group in order to make the sodium allowance slightly more conservative. If children are using up portions of their ‘sodium allowance’ on a product that is primarily vegetable-based (like pasta sauce), it makes it more challenging for children to consume the required meat, dairy and grain servings without exceeding their daily UL for sodium.
We opened this paper by referring to Nestle’s observation that salt reduction is ‘the new frontier of concerns about health’. In examining packaged baby/toddler foods and children’s foods, it is evident that this frontier needs careful consideration. Some irony resides in the fact that public policy initiatives are underway to encourage consumers to ‘adjust’ their taste buds to lower sodium levels in packaged foods(Reference Jeffery and Cappello5) even as certain products aimed at young children work to encourage them to develop a taste for salt. Even though children’s food as a whole fared well for sodium, high levels of sodium in particular products flag the need for clear and rigorous standards of what constitutes a ‘high sodium’ food; moreover, AI/UL ‘population-based’ benchmarks gloss over the need for guidance on individual products. That these are children’s foods matters, not only in terms of ‘stealth sodium’ and ‘subtle sodium’, but also because parents may not have sodium on their radar when in comes to shopping for young children. Finally, the issue of measurement – how to measure and where to set the target serving sizes – is imperative, as Canada’s SWG collaborates with the food industry to set ‘visible and public targets’(Reference Rynor4) for sodium reduction in processed foods. Serving sizes that reflect ‘real-world’ consumption are important, so that the targets neither magnify nor diminish actual sodium levels.
Acknowledgements
Sources of funding: This study was funded by a Research Grant from the Center for Science in the Public Interest (CSPI). CSPI did not provide any input on the design, focus or execution of the study; nor did CSPI provide input regarding the collection, analysis or interpretation of data, or the manuscript preparation. The views presented are solely those of the authors, and do not represent the views of CSPI. Conflicts of interest: The authors have no conflicts of interest to declare. Author contributions: C.D.E. was responsible for the research and research design, data collection, and writing up the paper. M.J.C. performed the data analysis, and design of figures and tables. Acknowledgements: The lead author thanks Bill Jeffery for his support for this project. Graduate students Brenda McDermid assisted with data entry, coding and construction of the preliminary tables; Ray op’tLand provided meticulous cleaning and fact checking of the data.


