


Introduction
Differences in responses to sensory stimuli in the environment, or sensory features, can be observed in about 5–8% of young children in the general population (Ahn et al., Reference Ahn, Miller, Milberger and McIntosh2004; Jussila et al., Reference Jussila, Junttila, Kielinen, Ebeling, Joskitt, Moilanen and Mattila2020) and 74–94% (Baranek et al., Reference Baranek, David, Poe, Stone and Watson2006; Ben-Sasson et al., Reference Ben-Sasson, Hen, Fluss, Cermak, Engel-Yeger and Gal2009; Kirby et al., Reference Kirby, Bilder, Wiggins, Hughes, Davis, Hall‐Lande, Lee, McMahon and Bakian2022) among autistic children. Some commonly reported sensory features include sensory hyperresponsiveness (HYPER; e.g., overly sensitive to or distressed by sounds, textures, or lights), hyporesponsiveness (HYPO; e.g., low or no apparent reaction to touch, sound or movement sensation), and sensory interests, repetitions and seeking behaviors (SIRS; e.g., showing unusual interest in flickering lights, intense touch pressure, or particular sounds). The presence of these sensory features has been empirically supported by psychometric validations in autistic as well as general populations (Ausderau, Sideris, et al., Reference Ausderau, Sideris, Furlong, Little, Bulluck and Baranek2014; Lee et al., Reference Lee, Chen, Sideris, Watson, Crais and Baranek2022). Previous evidence has revealed the early emergence of sensory features within the first year in infants who later developed autism (Sacrey et al., Reference Sacrey, Zwaigenbaum, Bryson, Brian, Smith, Roberts, Szatmari, Roncadin, Garon, Novak, Vaillancourt, McCormick, MacKinnon, Jilderda and Armstrong2015; Van Etten et al., Reference Van Etten, Kaur, Srinivasan, Cohen, Bhat and Dobkins2017; Wolff et al., Reference Wolff, Dimian, Botteron, Dager, Elison, Estes, Hazlett, Schultz, Zwaigenbaum and Piven2019), indicating their potential utility as early behavioral markers of autism. Further, previous behavioral and neurophysiological evidence suggests that altered sensory processing during infancy may pose cascading impact on later-developed social communication deficits in autistic children (Baranek et al., Reference Baranek, Woynaroski, Nowell, Turner-Brown, DuBay, Crais and Watson2018; Damiano-Goodwin et al., Reference Damiano-Goodwin, Woynaroski, Simon, Ibañez, Murias, Kirby, Newsom, Wallace, Stone and Cascio2018), thus highlighting the significance of sensory features in early detection and intervention. Despite the documented relevance of sensory features for autism, their manifestations are variable across life stages within and beyond the autism spectrum (Ben-Sasson et al., Reference Ben-Sasson, Gal, Fluss, Katz-Zetler and Cermak2019; Chen et al., Reference Chen, Sideris, Watson, Crais and Baranek2022; Uljarević et al., Reference Uljarević, Baranek, Vivanti, Hedley, Hudry and Lane2017). Thus, our better understanding of such developmental variability and its impact across broader neurodevelopmental spectra would contribute to a better use of sensory features for early detection and timely intervention delivery in both autistic and general populations.
Sensory-based subtypes
The past decades of research on autistic children revealed notable individual differences in observed sensory features to various sensory modalities across social and non-social contexts, which may be suggestive of distinct behavioral phenotypes (Uljarević et al., Reference Uljarević, Baranek, Vivanti, Hedley, Hudry and Lane2017). Previous studies of autistic children have demonstrated the presence of two to four sensory subtypes, which varied across severity and combinations of sensory features and/or modalities (Ausderau, Furlong, et al., Reference Ausderau, Furlong, Sideris, Bulluck, Little, Watson, Boyd, Belger, Dickie and Baranek2014; Ben-Sasson et al., Reference Ben-Sasson, Cermak, Orsmond, Tager-Flusberg, Kadlec and Carter2008; Lane et al., Reference Lane, Young, Baker and Angley2010, Reference Lane, Molloy and Bishop2014; Liss et al., Reference Liss, Saulnier, Fein and Kinsbourne2006; Simpson et al., Reference Simpson, Adams, Alston-Knox, Heussler and Keen2019; Tomchek et al., Reference Tomchek, Little, Myers and Dunn2018). A subgroup (24–38%) of autistic children who did not show clinically significant sensory features has been consistently identified across these studies (except for Simpson et al., Reference Simpson, Adams, Alston-Knox, Heussler and Keen2019), while the others were characterized by elevated sensory features in certain domains. This indicates that sensory challenges are individually variable across the autism spectrum. Furthermore, some studies reported differences in child characteristics across the identified sensory subtypes, such as cognitive abilities and chronological age (Ausderau, Furlong, et al., Reference Ausderau, Furlong, Sideris, Bulluck, Little, Watson, Boyd, Belger, Dickie and Baranek2014; Lane et al., Reference Lane, Molloy and Bishop2014; Liss et al., Reference Liss, Saulnier, Fein and Kinsbourne2006; Tomchek et al., Reference Tomchek, Little, Myers and Dunn2018). Specifically, some of the subtypes characterized by elevated sensory seeking and hyperresponsivity seemed to be associated with younger ages (e.g., Lane et al., Reference Lane, Molloy and Bishop2014; Tomchek et al., Reference Tomchek, Little, Myers and Dunn2018). It remains unclear, however, whether such age differences were due to developmental changes, as the subtyping was done on samples with a wide age range (i.e., age-heterogeneous samples) in these studies. Overall, the inconsistent findings across different measures and methods used for subtyping, and participant characteristics across studies make it challenging to draw generalizable conclusions on the heterogeneity of sensory across the autism spectrum (see Appendix I in the supplementary material for a summary of evidence on sensory-based subtypes in young children).
While sensory features can also be observed in children with other neurodevelopmental conditions, such as attention-deficit/hyperactivity disorder (ADHD), developmental delay, and even in children without a developmental diagnosis (Ben-Sasson et al., Reference Ben-Sasson, Soto, Heberle, Carter and Briggs-Gowan2017; Delgado-Lobete et al., Reference Delgado-Lobete, Pértega-Díaz, Santos-del-Riego and Montes-Montes2020; Lane et al., Reference Lane, Reynolds and Dumenci2012; Watson et al., Reference Watson, Patten, Baranek, Poe, Boyd, Freuler and Lorenzi2011), to date there has been a lack of evidence on sensory subtypes beyond autistic populations. Such evidence would be important for understanding how and to what extent sensory challenges are unique to autism. Previous findings on children with sensory processing disorder (Miller et al., Reference Miller, Schoen, Mulligan and Sullivan2017) and a population-based sample (Little et al., Reference Little, Dean, Tomchek and Dunn2017) demonstrated variability in sensory features across non-autistic populations. Particularly, sensory differences have been commonly reported in children with ADHD and autistic children with co-occurring ADHD (Dellapiazza et al., Reference Dellapiazza, Michelon, Vernhet, Muratori, Blanc, Picot and Baghdadli2021; Little et al., Reference Little, Dean, Tomchek and Dunn2017, Reference Little, Dean, Tomchek and Dunn2018). Also, ADHD and sensory symptoms, especially HYPER, have been observed to co-occur across the general population (Ben-Sasson et al., Reference Ben-Sasson, Soto, Heberle, Carter and Briggs-Gowan2017; Delgado-Lobete et al., Reference Delgado-Lobete, Pértega-Díaz, Santos-del-Riego and Montes-Montes2020; Panagiotidi et al., Reference Panagiotidi, Overton and Stafford2018). All these findings indicated that elevated sensory features might be better considered as reflections of children’s innate characteristics transacting with their ongoing responses to environmental demands, which may occur on a transdiagnostic continuum (Baranek et al., Reference Baranek, Little, Diane Parham, Ausderau and Sabatos-DeVito2014).
Sensory features and adaptive/maladaptive behavior
Most of the sensory subtyping studies reported distinguished differences across the subtypes in symptomatology, such as core symptoms of autism (Ausderau et al., Reference Ausderau, Sideris, Little, Furlong, Bulluck and Baranek2016; Liss et al., Reference Liss, Saulnier, Fein and Kinsbourne2006) and affective symptoms (Ben-Sasson et al., Reference Ben-Sasson, Cermak, Orsmond, Tager-Flusberg, Kadlec and Carter2008), as well as in adaptive functioning (Ausderau et al., Reference Ausderau, Sideris, Little, Furlong, Bulluck and Baranek2016; Lane et al., Reference Lane, Young, Baker and Angley2010; Tomchek et al., Reference Tomchek, Little, Myers and Dunn2018). These findings are generally consistent with the larger literature of non-subtyping studies demonstrating that elevated sensory features were differentially associated with lower adaptive functioning (Feldman et al., Reference Feldman, Cassidy, Liu, Kirby, Wallace and Woynaroski2020; Williams et al., Reference Williams, Kirby, Watson, Sideris, Bulluck and Baranek2018), impaired social communication (Tomchek et al., Reference Tomchek, Little and Dunn2015; Watson et al., Reference Watson, Patten, Baranek, Poe, Boyd, Freuler and Lorenzi2011), decreased motor skills (Roley et al., Reference Roley, Mailloux, Parham, Schaaf, Lane and Cermak2015; Surgent et al., Reference Surgent, Walczak, Zarzycki, Ausderau and Travers2020), as well as challenging behaviors (Feldman et al., Reference Feldman, Cassidy, Liu, Kirby, Wallace and Woynaroski2020; Green et al., Reference Green, Ben-Sasson, Soto and Carter2012; O’Donnell et al., Reference O’Donnell, Deitz, Kartin, Nalty and Dawson2012) in autistic children. Beyond autistic populations, studies of children with other developmental conditions have shown mixed associations between sensory features and adaptive functioning (Miller et al., Reference Miller, Schoen, Mulligan and Sullivan2017; Watson et al., Reference Watson, Patten, Baranek, Poe, Boyd, Freuler and Lorenzi2011; Williams et al., Reference Williams, Kirby, Watson, Sideris, Bulluck and Baranek2018). These previous findings generally support the clinical relevance of sensory differences across the neurodevelopmental spectrum and demonstrate their potential impact on various behavioral domains of child functioning. However, there is currently a lack of non-concurrent evidence on the utility of sensory subtypes in predicting adaptive and maladaptive outcomes in large population-based samples. Evidence in this regard is critical for understanding the clinical utility of sensory heterogeneity in the general population, such as to identify subgroups of children for whom early sensory differences leave them particularly vulnerable to additional challenges in adaptive functioning and challenging behaviors.
Longitudinal variability of sensory features
Previous cross-sectional evidence has revealed varying manifestations of sensory features across developmental stages (Baranek, Watson, Boyd, et al., Reference Baranek, Watson, Boyd, Poe, David and McGuire2013; Ben-Sasson et al., Reference Ben-Sasson, Hen, Fluss, Cermak, Engel-Yeger and Gal2009, Reference Ben-Sasson, Gal, Fluss, Katz-Zetler and Cermak2019); however, longitudinal evidence on within-person differences in sensory features over time has been limited. Emerging longitudinal evidence has demonstrated overall stable sensory features spanning two to three timepoints among age-heterogeneous samples of autistic children (Ausderau, Furlong, et al., Reference Ausderau, Furlong, Sideris, Bulluck, Little, Watson, Boyd, Belger, Dickie and Baranek2014; Baranek et al., Reference Baranek, Carlson, Sideris, Kirby, Watson, Williams and Bulluck2019; Dwyer et al., Reference Dwyer, Saron and Rivera2020; McCormick et al., Reference McCormick, Hepburn, Young and Rogers2016), while intensifying sensory features were observed among infant siblings of autistic children who were later diagnosed with autism themselves (Wolff et al., Reference Wolff, Dimian, Botteron, Dager, Elison, Estes, Hazlett, Schultz, Zwaigenbaum and Piven2019). Past research on the stability or changes of autism-related clinical features during early childhood has shed light on heterogeneity in autism as defined by continuous developmental patterns instead of snapshots in time (Georgiades et al., Reference Georgiades, Bishop and Frazier2017; Pender et al., Reference Pender, Fearon, Heron and Mandy2020), whose associations with long-term outcomes are critical for understanding the risk and resilience process of individuals on the neurodevelopmental spectrum (Cicchetti, Reference Cicchetti1993; Szatmari et al., Reference Szatmari, Zwaigenbaum, Georgiades, Elsabbagh, Waddell, Bennett, Bryson, Duku, Fombonne, Mirenda, Roberts, Smith, Vaillancourt and Volden2016). Nevertheless, it remains unclear whether such heterogeneous developmental patterns are also present in the sensory domain from very early in life. A recent prospective study demonstrated that autistic children and their non-autistic peers followed distinct sensory developmental pathways from infancy to school age, despite that the developmental variability could not be completely explained by clinical outcome status (i.e., autistic vs. non-autistic) and a priori demographic factors (Chen et al., Reference Chen, Sideris, Watson, Crais and Baranek2022). To better parse sensory heterogeneity, further investigation is needed to explore the existence of unobserved patterns of sensory development (i.e., sensory trajectory subtypes), which not only differ by intensity or degree but also differ by “kind” (i.e., qualitative differences across sensory domains) (Bauer & Reyes, Reference Bauer and Reyes2010), to better inform screening and treatment efforts.
The current study
To fill the empirical gaps mentioned above, this study targeted a large community sample (N = 1,517) and utilized latent class growth analysis (LCGA), a person-centered analytic approach, to identify subgroups of children based on their parallel-process trajectories of sensory features (i.e., HYPER, HYPO, and SIRS) from infancy to school age. We also examined the extent to which these identified subtypes differed in clinical and adaptive/maladaptive outcomes at school age to better understand their potential clinical relevance. The specific research questions included:
-
1. How many distinct sensory trajectory subtypes can be identified and how are these subtypes defined by latent growth parameters (i.e., intercept and slope)?
-
2. Do these sensory trajectory subtypes differ in their demographic characteristics, including child’s sex, race, and parent education levels?
-
3. Do children across these subtypes differ with respect to their clinical characteristics (e.g., presence of diagnoses/concerns of autism and ADHD) and adaptive/maladaptive outcomes at age 6?
Given the nature of the current population-based sample, largely without developmental disabilities, we hypothesized that the most prevalent subtype would be associated with very low sensory features (across HYPER, HYPO, and SIRS) and generally more optimal outcomes. Also, based on the previous population-based prevalence estimates (Ahn et al., Reference Ahn, Miller, Milberger and McIntosh2004; Jussila et al., Reference Jussila, Junttila, Kielinen, Ebeling, Joskitt, Moilanen and Mattila2020), we hypothesized that at least 5% of our sample would show elevated sensory features across the three domains and potentially worsening trajectories towards more challenges at school age.
Method
Participants and procedures
This study was an extension of a longitudinal research study, the North Carolina Child Development Survey (NCCDS), on a large cohort of families. Families were initially recruited from state birth registries at their child’s age of 6-19 months at Time 1 (T1) in 2014, and were invited to complete the First Years Inventory, version 3.1 (FYIv3.1; Baranek, Watson, Crais, et al., Reference Baranek, Watson, Crais, Turner-Brown and Reznick2013). Families with Hispanic or Latino ethnicity, based on information available in the state vital records, were excluded from recruitment because a large proportion (∼80%) of these families typically speak Spanish in the home as reported (Tippett, Reference Tippett2014) and the FYIv3.1 had not yet been translated into Spanish with a valid cultural adaptation at the time of the study in 2014 (DuBay et al., Reference DuBay, Watson, Baranek, Lee, Rojevic, Brinson, Smith and Sideris2021). The participating families were re-contacted by a follow-up survey at 3–4 years at Time 2 (T2) to report their child’s current diagnostic status and/or any parent-reported concerns, including the Developmental Concerns Questionnaire, version 1.5 (DCQv1.5; Reznick et al., Reference Reznick, Baranek, Watson and Crais2005), Sensory Experiences Questionnaire, version 2.1 (SEQv2.1; Baranek, Reference Baranek1999), and Social Responsiveness Scale, 2nd Edition (SRS-2; Constantino & Gruber, Reference Constantino and Gruber2012).
In the current study, the 2,236 families who returned their responses at T2 were followed up via emails to complete the DCQv1.5 and SEQv2.1 at 6–7 years of age at Time 3 (T3, Phase 1). At the second phase of T3, which was about 5 months after Phase 1 responses were returned, a subset of families (N = 465) was again contacted via email invitations to complete the SRS-2 and Vineland Adaptive Behavior Scales, 3rd Edition (VABS-3; Sparrow et al., Reference Sparrow, Cicchetti and Saulnier2016). This subset included families who reported any diagnosis/concerns at previous timepoints (N = 359) and a random sample of families whose responses did not indicate concerns at any of the previous timepoints (N = 106). We ended up receiving 1,519 responses at T3 Phase 1 and 389 responses at T3 Phase 2 (response rates = 67% and 84%, respectively). Table S1 shows the demographic characteristics of respondents (N = 1,519) and non-respondents (N = 717; excluded in the current analysis) at T3 Phase 1, indicating that Black and Asian races and lower education levels were associated with attrition. Out of the 389 responses in Phase 2, 312 (80%) had reported developmental diagnoses or concerns at previous timepoints. After removing cases with incomplete data, 1,517 sets of longitudinal responses were retained for further analysis. The demographics were shown in Table 1 by full sample (N = 1,517; with complete sensory scores measured by FYIv3.1 and SEQv2.1 over three timepoints) and subset sample (N = 389; with additional outcome data collected at T3 Phase-2). All procedures were approved by the University of North Carolina at Chapel Hill (IRB #13-2648) and University of Southern California Institutional Review Boards (IRB #HS-19-00651).
Table 1. Sample demographics

a For the analysis purposes, non-White races (Black and other races) were combined into one group given their small sample sizes.
b Categorization was based on the reported mother’s and father’s education at T1.
Measures
Sensory features – HYPER, HYPO, and SIRS
Due to the longitudinal nature of the study, two parent-report measures appropriate to the age of the children were used to operationalize the three sensory features of interest at each timepoint.
First Years Inventory, version 3.1 (FYIv3.1)
The FYIv3.1 is a parent-report measure revised from a previous version (FYIv2.0) that has been validated in a large community sample (Reznick et al., Reference Reznick, Baranek, Reavis, Watson and Crais2007; Turner-Brown et al., Reference Turner-Brown, Baranek, Reznick, Watson and Crais2013). It was designed to identify infants aged 6–16 months at risk for a later diagnosis of autism, measuring the frequency of behaviors across social communication, sensory-regulatory functions, and motor development domains with a 5-point Likert scale (Baranek et al., Reference Baranek, Sideris, Chen, Crais, Turner-Brown and Watson2022). The FYIv3.1 data were collected at T1. For this study, 14 items related to sensory features were extracted for establishing sensory construct scores (see Appendix II in the supplementary material).
Sensory Experiences Questionnaire, version 2.1 (SEQv2.1)
The SEQv2.1 is a parent questionnaire designed to measure the frequency of responses to daily sensory experiences for children ages 1–12 years with 37 items using a 5-point Likert scale (higher scores indicate endorsement of more sensory features). It has good internal consistency (Cronbach’s α = .80), test–retest reliability (r = .92) (Little et al., Reference Little, Freuler, Houser, Guckian, Carbine, David and Baranek2011), and discriminative validity for children with developmental conditions (including autism) (Baranek et al, Reference Baranek, David, Poe, Stone and Watson2006). The SEQv2.1 data were collected at T2 and T3. Fourteen items common to those in the FYIv3.1 (varied in item wording but intended to measure the same behavior) were extracted to establish sensory construct scores (see Appendix II), while the total score was used for evaluating the presence of clinically significant sensory challenges.
Clinical and school-age outcomes
Three parent-report measures were administered via follow-up surveys to capture a child’s clinical outcomes across development and adaptive/maladaptive outcomes at school age.
Developmental Concerns Questionnaire, version 1.5 (DCQv1.5)
The DCQv1.5 is a parent-report measure with open-ended questions about whether a parent or professional (e.g., psychiatrists, pediatricians, or psychologists) has been concerned about the child’s development and whether the child has received any clinical diagnoses. It has been used as one of the outcome measures in the validation studies of the FYI (Baranek et al., Reference Baranek, Sideris, Chen, Crais, Turner-Brown and Watson2022; Turner-Brown et al., Reference Turner-Brown, Baranek, Reznick, Watson and Crais2013). For this study, the DCQ data at T2 and T3 were used for clinical outcome classification. Responses were coded to determine whether the child has had any diagnosed developmental condition, including autism, ADHD, and/or any concerns across various domains of development.
Social Responsiveness Scale, 2nd edition (SRS-2)
SRS-2 is a parent-report measure of social deficits that characterize autism, providing general-population norms that demonstrated good discriminative validity (sensitivity = .83–.91, specificity = .53–.88) among clinical and non-clinical samples of young children with diverse demographics (Moody et al., Reference Moody, Reyes, Ledbetter, Wiggins, DiGuiseppi, Alexander, Jackson, Lee, Levy and Rosenberg2017). The SRS-2 data were collected at T2 (preschool-age version) and T3 (school-age version). A total T-score ≥ 60 suggests clinically significant social impairment and elevated likelihood of an autism diagnosis. The total T-score (M = 50, SD = 10) at T3 was used as one of the distal outcome variables.
Vineland Adaptive Behavior Scales, 3rd edition (VABS-3)
VABS-3 is a widely used standardized measure of adaptive functioning for individuals from birth through 90 years of age. The domain-level parent/caregiver form was used to assess children’s adaptive functioning (three subdomains: communication, social, and daily living skills), motor skills, and maladaptive behavior (two subdomains: internalizing and externalizing behaviors). This form has excellent internal consistency (Cronbach’s α = .86–.97) and test-retest reliability (r = .62–.92) (Pepperdine & McCrimmon, Reference Pepperdine and McCrimmon2018). The VABS-3 data were collected at T3 and the standardized scores in these six subdomains (M = 100, SD = 15 for adaptive behavior/motor scales and M = 15, SD = 3 for maladaptive behavior scales) were used as distal outcome variables.
Data analyses
Trait scores of sensory features were constructed upon the items extracted from the FYIv3.1 and SEQv2.1, following a series of procedures for longitudinal invariance testing and adjustment for differential item functioning (Chen et al., Reference Chen, Sideris, Watson, Crais and Baranek2022; also see Appendix II). The higher trait scores indicated more sensory features. There were very small proportions of missing data at each wave (0–.9%), which were confirmed as missing completely at random (MCAR) given the non-significant Little’s MCAR test results. We first performed univariate latent growth curve modeling (LGCM) on HYPER, HYPO, and SIRS separately to determine their growth form (i.e., linear or non-linear growth). The intercept was centered at T1 (age 1). Comparative fit index (CFI)/Tucker-Lewis index (TLI) ≥ .95 and root mean square error of approximation (RMSEA) < .08 were used to determine the goodness of model fit (Hu & Bentler, Reference Hu and Bentler1999). After confirming that the growth form was consistent across the three sensory constructs given the satisfactory model fits, a multivariate (or parallel process) latent growth model was built to better address the co-occurrence (Ausderau, Furlong, et al., Reference Ausderau, Furlong, Sideris, Bulluck, Little, Watson, Boyd, Belger, Dickie and Baranek2014) and codevelopmental process of the three sensory features (Chen et al., Reference Chen, Sideris, Watson, Crais and Baranek2022).
Next, LCGA, a special case of growth mixture modeling in which the within-class variances and covariances of latent growth factors were constrained to zero to meet the assumption of homogeneity within class, was used to identify clusters based on the trajectories of HYPER, HYPO, and SIRS. Multivariate LCGA models with different numbers of classes were estimated to determine the optimal class solution based on several fit indices: Akaike information criterion (AIC), Bayesian information criterion (BIC), sample size-adjusted Bayesian information criterion (SABIC), entropy, adjusted Lo-Mendell-Rubin likelihood ratio test (LMR-LRT) and bootstrap likelihood ratio test (BLRT) statistics. Practically, lower AIC/BIC values indicate better fit and an entropy value closer to 1 reflects a higher degree of class distinction. The LMR-LRT and BLRT compared fit statistics between neighboring models, with p-values < .05 indicating significant improvement in the model fit by adding each additional class (Tein et al., Reference Tein, Coxe and Cham2013). Upon determining the most interpretable and parsimonious solution with optimal fit statistics, each child was assigned to the class based on the highest posterior probabilities. Children’s sex, race, and parents’ education levels were included as covariates of trajectory class membership using Vermunt’s three-step approach (Vermunt, Reference Vermunt2010) to evaluate whether children with certain demographic characteristics were more likely to be in certain classes.
Finally, Bolck-Croon-Hagenaars (BCH) three-step approach, a robust and flexible method that accounts for classification uncertainty (Bakk & Vermunt, Reference Bakk and Vermunt2016), was applied to test differences between classes on each distal outcome variable (i.e., SRS-2 total T-score and VABS-3 subscale scores). Those without school-age outcome data were treated as missing in the model. The descriptive statistics of school-age outcome measures for the subset sample can be found in Table S2. All the latent growth analyses were conducted with robust maximum-likelihood estimation in Mplus 8.4 (Muthén & Muthén, Reference Muthén and Muthén2018).
Additionally, for the subset sample with complete outcome data (n = 389), we examined the proportion of children who met the following clinical conditions of interest in each identified class with the evaluation of odds ratios (ORs):
-
AUT (n = 88): Reported by parents to have an autism diagnosis from clinicians via DCQ and/or met the SRS-2 cutoff (total T-score ≥ 60) at T2 or T3.
-
ADHD (n = 43): Reported by parents to have an ADHD diagnosis from clinicians and/or related concerns (e.g., inattention, impulsivity, or hyperactivity) via DCQ at T2 or T3.
Results
Longitudinal trends of sensory features
Univariate linear LGCMs showed strong evidence of linear growth across the three sensory constructs: χ2(1) = .41–.70, all CFIs/TLIs = 1.00 and RMSEAs < .001. The multivariate/parallel-process model with simultaneous estimation of the three trajectories also demonstrated a good fit: χ2(15) = 27.44, CFI = .995, TLI = .988, RMSEA = .023. Notably, significant variances were observed for the intercepts and slopes across trajectories (all p < .001), suggesting the presence of significant individual differences in the initial levels and change rates of all the sensory features. Thus, it was of great interest to further parse out more homogeneous subtypes among the highly variable trajectories using LCGA.
Trajectory classes of sensory features
Parallel-process LCGA models were then fitted with two to six classes to determine the optimal number of trajectory classes (i.e., subtypes) (see Table 2 for fit statistics). Based on the fit indices and clinical interpretability of these class solutions, a five-class model was selected. While LMR-LRT showed non-significant improvement from the four-class to five-class model, the entropy did slightly improve for the five-class model in addition to the decreases in AIC, BIC, and SABIC. Although the proportion of the smallest class was only around 3%, it might represent the most extreme cases among the estimated 5–8% of the general population with sensory issues (Ahn et al., Reference Ahn, Miller, Milberger and McIntosh2004; Jussila et al., Reference Jussila, Junttila, Kielinen, Ebeling, Joskitt, Moilanen and Mattila2020) and thus we considered this class as potentially clinically relevant. The average maximum posterior probabilities ranged from 76 to 87% across latent classes, indicating a satisfactory degree of precision in classifying children into these trajectory subgroups. The five classes were depicted below and visualized in Figure 1 (detailed growth parameter estimates by latent class are provided in Table S3):

Figure 1. Parallel-process trajectory classes of sensory features (5-class solution; full sample N = 1,517) [estimated means with 95% confidence intervals]. †None of the parents had a college degree (or beyond). HYPER = sensory hyper-responsiveness; HYPO = sensory hypo-responsiveness; SIRS = sensory interests, repetitions and seeking behaviors. *p < .05; **p < .01; ***p < .001 (odds ratio tests).
Table 2. Fit statistics for multivariate latent class growth analysis
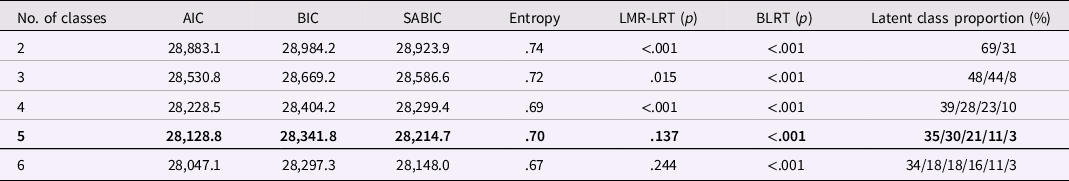
Note. SABIC = sample size-adjusted Bayesian information criterion; LMR-LRT = Lo-Mendell-Rubin likelihood ratio test; BLRT = bootstrap likelihood ratio test. The fit statistics of the selected solution were bolded.
-
Class 1 (Adaptive – All Improving, n = 537, 35%) accounted for the largest portion and showed the lowest levels of scores across constructs over time. The intercepts of the three constructs were significantly lower than zero (M = −.32 to −.22, SE = .04–.05, all p < .001). The mean slopes of HYPER and SIRS indicated significant decreases (M = −.21 & −.17, both SE = .02, p < .001), and a slight decrease was observed in HYPO (slope M = −.05, SE = .02, p = .012).
-
Class 2 (Moderate – HYPO Worsening, n = 171, 11%) was characterized by moderately elevated scores across constructs (intercepts M = .32–.68, SE = .10–.13, all p < .01). The mean slope of HYPO indicated a significant increase (M = .25, SE = .05, p < .001), while HYPER and SIRS remained stable over time.
-
Class 3 (Moderate SIRS – HYPER Improving, n = 316, 21%) had moderately elevated SIRS (intercept M = .64, SE = .07, p < .001), while being scored low in HYPER and HYPO (intercept M = .11 & -−.14, SE = .06 and .04, p = .05 and .001). HYPO and SIRS remained stable over time, while HYPER significantly decreased (slope M = −.22, SE = .05, p < .001).
-
Class 4 (Mild – SIRS Improving, n = 449, 30%) was characterized by mildly elevated scores in HYPER and HYPO (intercepts M = .30 and .16, SE = .06 and .04, p < .001); SIRS did not differ from zero at baseline and was followed by a significant decrease (slope M = −.19, SE = .04, p < .001).
-
Class 5 (Elevated – All Worsening, n = 44, 3%) was the most severely affected group, characterized by moderately elevated HYPER at baseline (intercept M = .58, SE = .18, p = .001), and large increases in HYPER and HYPO over time (slopes M = .72 & .59, SE = .17 & .14, p < .001). The increase in SIRS was smaller but still significant (slope M = .47, SE = .19, p = .015).
Demographic differences across sensory trajectory classes
A series of multinomial logistic regression models were conducted using Vermunt’s three-step approach on the full sample to examine the impact of child’s sex, race, and parent education on the trajectory class membership. The demographic characteristics by class were shown in Figure 1. Compared to Class 1, children in Class 5 were almost four times more likely to be boys (OR with 95% CI = 3.9 [1.9, 7.9], p < .001), and children in Class 3 were about two times more likely to be non-White (OR = 2.2 [1.5, 3.2], p < .001). Additionally, parents of children in Classes 2 and 5 were more likely to report that none of the parents had a college degree or beyond (ORs = 2.0 [1.3, 3.2] & 6.76 [3.4, 13.3], both p < .01, compared to Class 1). Class 4 did not differ from Class 1 in any of the demographic variables.
Differential school-age outcomes across sensory trajectory classes
The equality tests of means across classes on distal outcomes (see Tables 3 and S3 for detailed statistics and pairwise comparisons) revealed that children in Class 5 had significantly worse school-age outcomes across almost all domains. Their average SRS-2 total T-score was particularly higher than the other groups (χ2 = 33.0–133.3, all p < .001). Classes 2 and 4 were also associated with elevated SRS-2 total T-scores and challenges in certain adaptive functioning domains: Compared to Class 1, children in Class 2 had lower social communication and motor skills (χ2 = 6.7–16.2, all p < .05) while those in Class 4 had lower motor and daily living skills (χ2 = 11.6 & 5.7, both p < .05). Both groups showed higher levels of maladaptive behavior than Class 1 (χ2 = 9.5–58.5, all p < .01) but overall better adaptive outcomes than Class 5 (χ2 = 19.7–72.4, all p < .001). Classes 1 and 3 overall had better outcomes than the other three groups, and no significant difference was found between these two groups across outcome variables except for the SRS-2 total T-score (χ2 = 4.5, p = .03).
Table 3. School-age outcomes by sensory trajectory class (subset sample N = 389)

AUT: presence of a parent-reported autism diagnosis via DCQ and/or with SRS-2 total T-score ≥ 60; ADHD: presence of a parent-reported ADHD diagnosis and/or related concerns via DCQ; Other: not meeting the AUT and ADHD conditions. Detailed pairwise mean comparisons (other than comparisons to Class 1) are presented in Tables S4 and S5.
*p < .05; **p < .01; ***p < .001 (two-tailed).
Parent-reported clinical outcome status across sensory trajectory classes
Children in Class 5 were 122.9 times more likely than those in Class 1 to have a parent-reported autism diagnosis or high autistic traits (i.e., met the SRS-2 cutoff or reported to have an autism diagnosis). Classes 2 and 4 were also associated with elevated probabilities of an autism diagnosis and/or elevated autistic traits (ORs = 15.2 [4.5, 52.2] and 5.2 [1.5, 18.3], both p < .01). Children in Class 2 and Class 5 were more likely to have an ADHD diagnosis or related concerns than those in Class 1 (ORs = 6.8 [1.5, 30.9] and 28.0 [5.9, 133.3], p = .01 and < .001). Moreover, Class 5 was more associated with autism and co-occurring ADHD than any of the other classes (ORs = 8.7–103.6, all p < .001; see Table 3 for the pie charts).
Discussion
The current study represents the first endeavor to subtype a large birth cohort of children based on the developmental trajectories of sensory features across three timepoints beginning in the infancy period, leveraging a person-centered analytic approach that takes both within-person and between-person differences into account. We estimated parallel-process trajectories of HYPER, HYPO, and SIRS, given the previous evidence of their co-occurrence (Ausderau, Furlong, et al., Reference Ausderau, Furlong, Sideris, Bulluck, Little, Watson, Boyd, Belger, Dickie and Baranek2014; Lane et al., Reference Lane, Young, Baker and Angley2010), and identified five distinct classes (i.e., subtypes) characterized by both quantitative (i.e., intensity and rates of change over time) and qualitative differences (i.e., stability or change in certain sensory constructs). This indicates that the manifestation of sensory features is a continuum across autistic and non-autistic conditions not only in severity, as demonstrated by a previous subtyping study on a population-based sample (Little et al., Reference Little, Dean, Tomchek and Dunn2017), but also in how they change or develop over time. Another significant contribution of the current study lies in demonstrating the associations between the developmental course of sensory features and distal outcomes which comprehensively include clinical outcome categories, symptom severity, and adaptive functioning by school age, thus supporting the external validity and clinical relevance of the identified sensory subtypes. Overall, larger differences across subtypes were observed in autistic traits, social communication skills, and maladaptive behavior, indicating that these domains might be closely associated with and potentially impacted by sensory development during early childhood.
Notably, we identified a subtype (i.e., Class 5; Elevated – All Worsening) characterized by highly elevated sensory features and dramatic worsening patterns over time, and children in this subtype on average showed significant challenges across behavioral domains at school age. Most (82%) of the children in Class 5 had been reported to have an autism diagnosis or elevated autistic traits between 3 and 6 years of age, indicating its high relevance to autism. The worsening trajectories of sensory features seemed to become evident starting in infancy, indicating that sensory features might be a useful early behavioral marker of autism and associated challenges later in life. Children in Class 5 were also associated with a higher likelihood of an ADHD diagnosis or concerns and significantly higher levels of maladaptive behavior. Particularly, about half of the autistic children in this class were reported to have co-occurring ADHD, which is a much higher rate than in other classes. This finding is consistent with the previous evidence that autistic children with co-occurring ADHD tended to show more elevated sensory challenges (Dellapiazza et al., Reference Dellapiazza, Michelon, Vernhet, Muratori, Blanc, Picot and Baghdadli2021; Mattard-Labrecque et al., Reference Mattard-Labrecque, Amor and Couture2013), highlighting larger needs for sensory-based intervention or support in this subpopulation. Further, the significantly elevated internalizing problems observed for this subgroup might be associated with the dramatically increasing sensory hyperresponsiveness as distinct from other classes. The relationship between sensory hyperresponsiveness and internalizing behavior, such as anxiety, has been well documented across literature at both behavioral and neurological levels (Green & Ben-Sasson, Reference Green and Ben-Sasson2010; Williams et al., Reference Williams, Campi and Baranek2021). This indicates that sensory hyperresponsiveness may be an important target of early intervention for preventing or mitigating later internalizing difficulties.
We also identified a subtype characterized by moderately elevated and more stable sensory features (i.e., Class 2; Moderate – HYPO Worsening). On average, children in Class 2 also showed significantly higher autistic traits than Class 1 (Adaptive – All Improving) but relatively better adaptive and maladaptive outcomes than Class 5. Approximately 38% of the autistic children in our sample were classified to Class 2 in addition to 32% in Class 5. Thus, at least 70% of the autistic children in our sample showed moderately to highly elevated levels of sensory challenge, which is consistent with the previously estimated prevalence of sensory symptoms in autistic children (e.g., Baranek et al., Reference Baranek, David, Poe, Stone and Watson2006; Kirby et al., Reference Kirby, Bilder, Wiggins, Hughes, Davis, Hall‐Lande, Lee, McMahon and Bakian2022). This finding was also in line with a previous study that examined longitudinal patterns of sensory features, where about 67% of their autistic sample showed intense sensory features over time during early childhood (Dwyer et al., Reference Dwyer, Saron and Rivera2020). Children in Class 2 were also more likely to have an ADHD diagnosis or related concerns and did not differ from Class 5 in the level of externalizing behavior, albeit less likely than Class 5 to have co-occurring autism/ADHD by school age. It is noteworthy that both Classes 2 and 5 were characterized by a marked increase in sensory hypo-responsiveness and tended to have lower social communication skills at school age, supporting the cascading effects theory that early sensory differences may cascade into later social communication difficulties in autistic populations (Baranek et al., Reference Baranek, Woynaroski, Nowell, Turner-Brown, DuBay, Crais and Watson2018; Thye et al., Reference Thye, Bednarz, Herringshaw, Sartin and Kana2018).
The other two subtypes (Classes 3 and 4) were characterized by mild to moderate stable or improving sensory features and showed better school-age outcomes than Classes 2 and 5. While Class 3 (Moderate SIRS – HYPER Improving) was defined by relatively elevated sensory repetitions/seeking behaviors than sensory hyper/hyporesponsiveness over time, Class 4 (Mild – SIRS Improving) seemed to follow an opposite pattern – relatively elevated and stable hyper/hyporesponsiveness but lower and reducing sensory repetitions/seeking behaviors. Interestingly, children in Class 3 showed school-age outcomes comparable to those in Class 1 and better socialization and motor skills than those in Class 4. Previous research has reported positive associations between sensory repetitions/seeking behaviors and adaptive and motor skills in autistic children and those with other developmental disabilities (Mikami et al., Reference Mikami, Hirota, Takahashi, Adachi, Saito, Koeda, Yoshida, Sakamoto, Kato, Nakamura and Yamada2021; Williams et al., Reference Williams, Kirby, Watson, Sideris, Bulluck and Baranek2018). These suggest that the impact of sensory repetitions/seeking behaviors may be context-specific and may not impair children’s adaptive outcomes in the way as sensory hypo/hyperresponsiveness does up to 6 years of age. Further research is merited to understand the impact of specific sensory constructs on child’s functioning, which may inform targeted support and intervention for optimizing outcomes.
Regarding the demographic differences across trajectory classes, the only sex difference was found in Class 5 – children in this class were more likely to be boys than those in the other classes. This is not surprising as the majority (82%) comprising this class were reported to have an autism outcome and the prevalence of autism has been found highly male-biased (Werling & Geschwind, Reference Werling and Geschwind2013). Another demographic variable of interest was child’s race. While the overall proportion of non-White participants in our study was low (around 13%), we found that 22% of the children in Class 3 were of a non-White race. This class was characterized by more sensory repetitions/seeking behaviors across the period. Furthermore, we found that the two most severe classes (i.e., Classes 2 and 5) were associated with lower parent education levels. While there is a lack of evidence on differences in children’s sensory behaviors as associated with child ethnicity and parent education levels, discrepancies in parent ratings of children’s challenging behavior were previously found to be associated with family socioeconomic status and race (Harvey et al., Reference Harvey, Fischer, Weieneth, Hurwitz and Sayer2013; Lawson et al., Reference Lawson, Nissley-Tsiopinis, Nahmias, McConaughy and Eiraldi2017). Further research is needed to clarify to what extent such differences can be explained by informant differences in cultural interpretation and reporting of their children’s behaviors versus true differences in children’s behavioral manifestation.
Overall, our findings underscore the importance of examining the heterogeneous manifestations of sensory features across a broader neurodevelopmental spectrum, which may eventually contribute to a better understanding of the etiological mechanisms of sensory differences and comorbid mental health conditions in autism. Recent perspectives on neurodevelopmental disorders have recognized this continuum or transdiagnostic view, which could impact how we set appropriate clinical thresholds for diagnosis and identify clinically relevant phenotypes (Astle & Fletcher-Watson, Reference Astle and Fletcher-Watson2020; Constantino & Charman, Reference Constantino and Charman2016). The strong associations observed between early sensory trajectories and later adaptive/maladaptive outcomes highlight the importance of identifying and addressing sensory concerns in early childhood as well as monitoring those concerns over time. Further, these associations suggest that interventions for supporting social communication and mitigating internalizing behavior may be especially important for children who show worsening patterns in sensory responsiveness during early development. Our study responded to the call for evidence that addresses multidimensional sensory features and examines the potential value of early sensory variability as indicators of later developmental outcomes under prospective designs (Uljarević et al., Reference Uljarević, Baranek, Vivanti, Hedley, Hudry and Lane2017). We expect future research to further expand this roadmap for better understanding individual differences in sensory features across development transdiagnostically as a critical step forward toward more accurate early detection and timely targeted intervention for children with various sensory needs.
Limitations and future directions
One limitation of this large sample study was the sole use of parent-report measures for measuring sensory subtypes as well as categorizing children into various outcome groups. Although parent-report measures have been well applied in large-scale research for outcome ascertainment (e.g., Kogan et al., Reference Kogan, Vladutiu, Schieve, Ghandour, Blumberg, Zablotsky, Perrin, Shattuck, Kuhlthau, Harwood and Lu2018; Turner-Brown et al, Reference Turner-Brown, Baranek, Reznick, Watson and Crais2013) and the agreement between parental and clinical reports of an autism diagnosis could be as high as 98% (e.g., Daniels et al., Reference Daniels, Rosenberg, Anderson, Law, Marvin and Law2012), gold-standard observational measures would allow for more accurate diagnostic classifications in future studies where ample resources were available. Nevertheless, the assessments of children’s broader developmental outcomes in the current study, including standardized measures of adaptive and maladaptive behaviors, may inform us about the clinical relevance of the subtypes beyond diagnostic classifications.
Another caveat of this study is that we were only able to examine the associations between class membership and distal outcomes in a subset sample of the larger study, whereas the subtyping analysis was conducted on the full sample. However, the vast majority of the families we did not recruit for the distal outcome analysis were more likely children without developmental disabilities, and we did include a random sample of this population in the follow-up to balance oversampling of children with parent-reported diagnoses/concerns. Lastly, caution is advised in terms of generalizing the current findings to non-White races and Hispanic/Latinx ethnicities, which were underrepresented in our sample. As attrition was associated with non-White races and lower parent education levels, future research would benefit from purposive sampling of more diverse and representative populations. Also, it would be important to apply multimodal approaches (e.g., observational, biobehavioral measures) for capturing a comprehensive picture of sensory development as well as to decipher the roles of targeted early interventions and other factors, such as environmental supports and access to services, in addressing sensory challenges and facilitating long-term outcomes.
Conclusion
This study took developmental and transdiagnostic approaches to investigate the heterogeneous manifestations of sensory features beyond autism by parsing more homogeneous trajectory subtypes among a large community sample of infants prospectively followed to school age. The identified sensory trajectory subtypes were differentially associated with clinical and adaptive/maladaptive outcomes at school age, suggesting that characterizing children based on their early sensory development may assist clinicians to identify those who are more likely to experience developmental challenges at school age, and thus adopt tailored approaches early on to target sensory differences that may pose challenges in child’s daily functioning.
Supplementary material
The supplementary material for this article can be found at https://doi.org/10.1017/S0954579422001195
Acknowledgements
The authors would like to thank the participating families and the staff who helped with data collection and coding as part of the Program for Early Autism Research, Leadership and Service (PEARLS) team. We also appreciate the valuable feedback from the Innovations in Neurodevelopmental Sensory Processing Research (insp!re) lab members at USC Chan. We are grateful to our departed colleague, Dr. J. Steven Reznick, for his leadership, friendship, and support in the early phases of this work.
Funding statement
The North Carolina Child Development Survey (NCCDS) project was partially supported by the Autism Speaks Foundation (Grant #5946) and the Ireland Family Foundation. The school-age follow-up was partially supported by the Organization for Autism Research Graduate Research Grant (#2019G3).
Conflicts of interest
GTB is the lead author of two measures (the First Years Inventory and Sensory Experiences Questionnaire) used in the current study, and LRW and ERC are the co-authors of the First Years Inventory; there are no financial conflicts with the use of these measures as they are freely available. GTB is affiliated with the University of Southern California, an academic institution that offers continuing education courses related to sensory processing and integration theory, assessment and intervention; she personally does not receive any proceeds from these activities. YJC and JS declared no conflict of interest.


 Open access