


Introduction
Estimates of HIV prevalence in ‘key populations’ (sub-populations considered to be at high risk for HIV) are very uncertain, especially in the case of men who have sex with men (MSM) and sex workers, who are in many settings ‘hidden’ due to criminalization or social and religious strictures. Estimates of HIV prevalence in South African MSM have been highly inconsistent, ranging from 14% to 50% [Reference Lane1–Reference Dunkle7]. Most of these prevalence studies have relied on respondent-driven sampling (RDS) to draw representative samples of MSM in specific locations and the generalizability of individual studies has been unclear. Because the RDS surveys do not enrol men who have sex only with women, a comparison of HIV risk between MSM and exclusively heterosexual men is not possible from these sources. In such settings, it is necessary to use mathematical models to extrapolate from the available data to estimate HIV prevalence in MSM nationally and to compare these to estimates of HIV prevalence in the population of exclusively heterosexual men.
Previous models that have been fitted to HIV prevalence data in MSM have mostly assumed that surveys provide an unbiased measure of HIV prevalence in MSM [Reference Brown8, Reference Brookmeyer9]. Although RDS sampling designs are intended to minimise bias due to non-random recruitment, studies have shown that RDS surveys may nevertheless yield biased estimates of the outcome of interest [Reference McCreesh10–Reference Gile and Handcock13], even when the population being studied is not ‘hidden’ [Reference McCreesh10]. A particular concern in the context of MSM is that RDS surveys may be biased towards younger MSM. In South African RDS studies of MSM, the median proportion of MSM who are aged <25 is 70% [Reference Lane1–Reference Kufa6, Reference Vu14]; this compares with a proportion of only 23% in the general population of South African men in 2011 [15]. If young MSM are indeed over-represented in surveys of MSM, this may lead to HIV prevalence in MSM being under-estimated, since HIV prevalence in older MSM tends to be substantially higher than that in younger MSM [Reference Lane1–Reference Cloete4].
This study aims to estimate the potential extent of this bias by calibrating a mathematical model of HIV in South Africa to RDS data, under different assumptions about selection bias. This study also aims to estimate national HIV prevalence and incidence levels in South African MSM and to compare these with estimates for other men in the general population.
Methods
The model presented in this analysis is an extension of a previously-described agent-based model of heterosexual HIV transmission in South Africa [Reference Johnson and Geffen16]. The model simulates a nationally representative sample of 20 000 South Africans, starting in 1985; the simulated population size changes over time as a result of births and deaths. Sexually experienced individuals are divided into two classes: high risk (having a propensity for concurrent partnerships and commercial sex) and low risk (no propensity for concurrent regular partnerships or commercial sex). In the model of heterosexual transmission, three relationship types are considered: interactions between sex workers and their clients, short-term (non-cohabiting) relationships and long-term (cohabiting or marital) relationships. The model has previously been fitted to South African age-specific HIV prevalence data [Reference Johnson and Geffen16]; assumptions about heterosexual transmission probabilities per sex act and initial heterosexual HIV prevalence levels in the current analysis are fixed at the average values from the 100 best-fitting parameter combinations obtained previously.
Several extensions have been made to the model for the purpose of simulating HIV transmission between MSM. A detailed explanation of these changes is provided in the supplementary material, together with an explanation of the data sources on which the MSM assumptions are based. Briefly, each male is assigned a male preference value at birth: 0 (always exclusively heterosexual), 1 (always exclusively homosexual) or any value between 0 and 1 (men who have a propensity for sex with both men and women, with the extent of same-sex preference changing over the life course). For the sake of convenience, we will refer to these three groups as heterosexual, gay and bisexual throughout this paper, though men in the ‘bisexual’ category may be exclusively homosexual or heterosexual at a point in time. The fraction of men who are either gay or bisexual is assumed to be 5%, based on household surveys that included questions about having ever had same-sex experiences [Reference Dunkle7, Reference Peltzer17].
Of those males who are assigned a non-zero male preference value at birth, an assumed fraction is bisexual. A prior distribution is assigned to represent the uncertainty around this fraction, based on the fraction of MSM who report having ever had sex with women [Reference Lane1–Reference Sandfort5] and taking into account that surveys of men who have recently had sex with other men are by design less likely to represent men who have infrequent sexual interactions with other men (Table 1). Each bisexual male is randomly assigned two values: an initial male preference parameter (which applies up to age 20) and an annual rate of change in male preference, which determines the extent to which their same-sex preference changes after age 20. These values are sampled from beta and normal distributions respectively. We specify prior distributions to represent the uncertainty around the means and standard deviations of these distributions (Table 1) and these parameters influence the age profile of the men who are currently sexually active with other men.
Table 1. Prior distributions and 100 best-fitting parameter combinations
LT = long-term. MSM = men who have sex with men. s.d. = standard deviation. ST = short-term. UAI = unprotected anal intercourse.
Three types of MSM relationships are modelled: casual sex relationships (which are assumed to last less than a week), short-term (non-cohabiting) relationships and long-term relationships. The model is calibrated to reported total numbers of partners in the last 6 months, reported current partners and the fraction of men who are in marital/cohabiting relationships [Reference Lane1, Reference Lane2, Reference Cloete4, Reference Kufa6, Reference Dunkle7, Reference Vu14]. Due to lack of information on the fraction of relationships that are short-term, age-specific rates of entry into short-term relationships in MSM are assumed to be the same as in heterosexual men, but a prior distribution is specified to represent the uncertainty around the average duration of short-term relationships in MSM (Table 1). Because social strictures often prevent openly homosexual relationships, the relative rate of entry into long-term relationships in MSM compared with heterosexual men is assumed to be less than one (Table 1). Average duration of long-term relationships are assumed to be the same in same-sex and heterosexual relationships.
Casual sex is modelled by assuming that MSM progress through phases of casual sex activity. The rate of entry into the casual sex phase is assumed to depend on the individual's male preference value, age, risk group and current relationship status (Table 1). The casual sex phase is assumed to last for a year on average and rates of entry are calculated such that a specified casual sex prevalence is maintained in gay high-risk men who are young and single. A prior distribution is assigned to represent the uncertainty around this casual sex prevalence, based on the fraction of MSM who report two or more sexual partners in the last 6 months [Reference Cloete4].
Each man who is assigned a non-zero male preference value is also randomly assigned an anal intercourse role preference value, which is either 0 (exclusively receptive), 1 (exclusively insertive) or 0.5 (willing to adopt either role). The proportions assigned to each preference differ for gay and bisexual men [Reference Lane18]. The assumed HIV transmission probabilities per act of anal intercourse differ depending on whether the HIV-positive partner adopts the insertive or receptive role and also differ depending on the type of relationship [Reference Jin19–Reference Bavinton21] (Table 1). In the event that a relationship forms between two men with incompatible role preferences, they are assumed to engage only in non-anal sex acts, which are assumed to carry no HIV transmission risk [Reference Patel22]. Coital frequencies in short-term and long-term same-sex relationships are assumed to be the same as in heterosexual relationships and a prior distribution is specified to represent the uncertainty around the frequency of casual sex while in the casual sex phase. Levels of condom use are also assumed to be the same in same-sex and heterosexual relationships [Reference Peltzer17, Reference Thurston23].
Uncertainty analysis proceeds by drawing a random sample of 20 000 parameter combinations from the prior distributions in Table 1. For each parameter combination, the sampled parameter values are entered into the model, the model is run and a likelihood function is calculated to represent the extent of the consistency between the model outputs and the levels of sexual risk behaviour and HIV prevalence reported in South African RDS studies (Fig. 1). These include unpublished data from a recent study [Reference Kufa6]. In almost all of these studies, MSM were defined as men aged 18 and older who had sex with other men in the last 6 months and for the sake of consistency, the same definition is used in defining the model population of MSM. The likelihood function is based on a random effects model, which takes into account heterogeneity between settings within South Africa. From the set of 20 000 parameter combinations, we select the 100 combinations with the highest likelihood values and summarise the results for these 100 combinations (Figs 1–3).
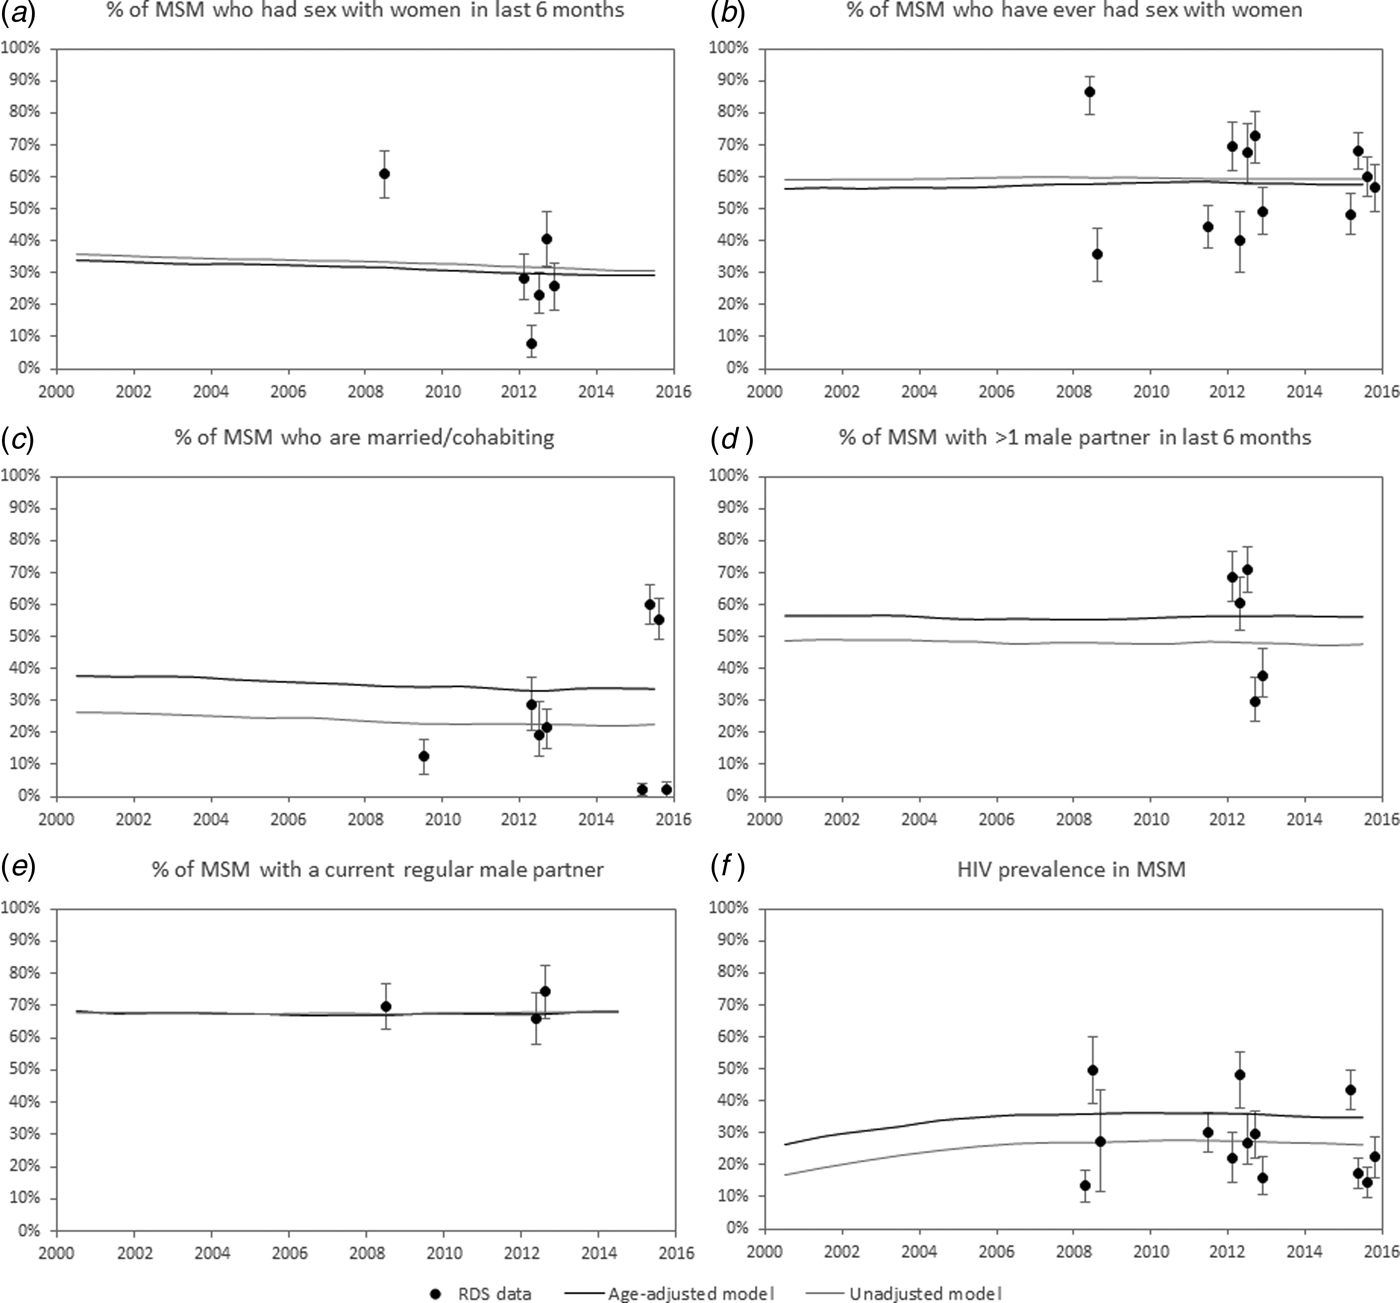
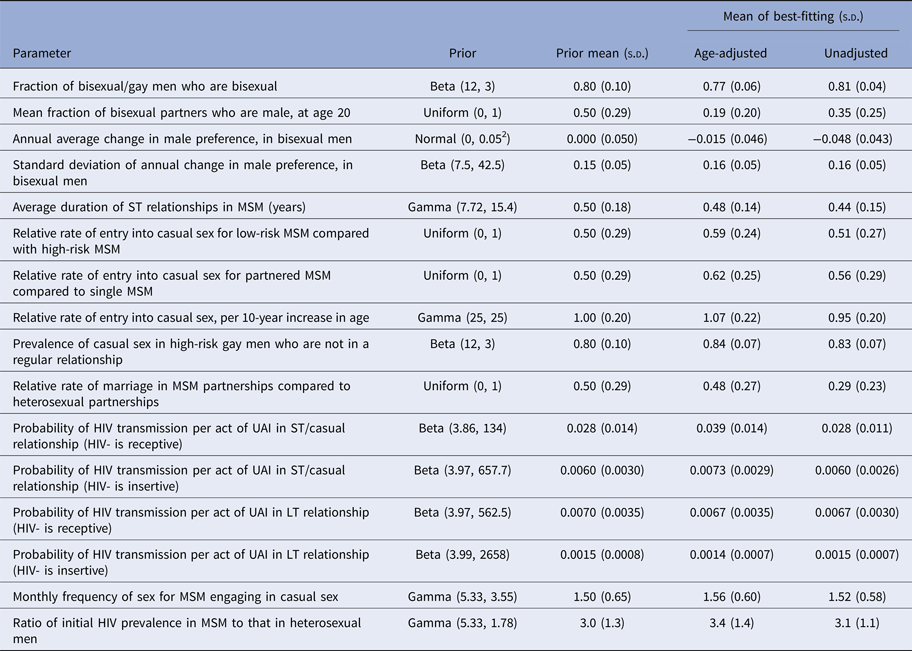
Fig. 1. Sexual behaviour and HIV prevalence in MSM. Men who have sex with men (MSM) are defined here as men aged 18 or older who have had sex with other men in the last 6 months. Medians (solid lines) are calculated from the 100 parameter combinations that yielded the best fit to the Respondent Driven Sampling (RDS) data. The age-adjusted model estimates represent the modelled age distribution of the MSM population and therefore differ in some cases from the RDS estimates (which are based on a younger age profile) and the unadjusted model estimates (which assume no age bias in the RDS sampling).
Fig. 2. Age-specific HIV prevalence in South African men in 2012. Solid lines represent the median of the modelled prevalence estimates, obtained using the 100 best-fitting parameter combinations; dashed lines represent interquartile ranges. Results were generated using the age-adjusted model. Dots represent estimates of HIV prevalence in the general male population, from the 2012 Human Sciences Research Council (HSRC) national household survey [Reference Shisana24].

Fig. 3. HIV incidence rates in adults aged 15–49 by sex and sexual orientation, 2005–2015. Bars and error bars represent medians and interquartile ranges, respectively, calculated from the 100 best-fitting parameter combinations.
To assess the sensitivity of the model results to the assumed extent of age bias, two analyses are performed. In the first, the model estimates of HIV prevalence in the 18–24 and 25+ age groups are weighted according to the age distributions in the RDS surveys to which they are compared (‘age-adjusted analysis’). In the second, no adjustment is performed, i.e. it is implicitly assumed that there is no age bias in the RDS sampling and hence no need to reweight the model estimates to match the age profile of the RDS sample. As an example, suppose that an RDS survey in 2012 measured an HIV prevalence in MSM of 25%, of whom 70% were aged 18–24 and 30% were aged 25 or older. Further, suppose that the model estimates that HIV prevalence in MSM in 2012 was 35% (15% in MSM aged 18–24 and 40% in MSM aged 25 or older, with 80% of MSM aged 25 or older). In the age-adjusted analysis, the 25% survey estimate would be compared with a model estimate of 22.5% (70% × 15% + 30% × 40%) for the purpose of calculating the likelihood, but in the unadjusted analysis, the survey estimate of 25% would be compared with the model estimate of 35% (i.e. not taking into account the difference in age distribution). A more detailed explanation of the likelihood function and the data sources on which it is based is provided in the supplementary materials. Age weighting has been used only in the calibration step; all results presented for MSM in the sections that follow are unweighted.
Results
For most of the model parameters, the distribution of best-fitting parameter values was similar in the age-adjusted and unadjusted analyses (Table 1). However, the best-fitting values for the HIV transmission probability per act of unprotected receptive anal intercourse were substantially higher in the age-adjusted analysis (mean 0.039, standard deviation (s.d.) 0.014) than in the unadjusted analysis (mean 0.028, s.d. 0.011). The relative rate of marriage/cohabitation in same-sex relationships (compared with heterosexual relationships) was also estimated to be higher in the age-adjusted analysis (mean 0.48, s.d. 0.27) than in the unadjusted analysis (mean 0.29, s.d. 0.23). The age-adjusted model tended to yield higher levels of same-sex activity in older men than the unadjusted model, with less of a decline in same-sex preference in bisexual men as age increases (−0.015 per year compared with −0.048 per year) and more of an association between casual sex and older age. The age-adjusted and unadjusted models estimated similar proportions of recent MSM in the 18–24 age group (20% and 24%, respectively (Table 2)), which were substantially lower than the RDS survey estimates (median 70%, range 33–73% (Table S12)), but higher than the modelled fraction of sexually active men in the general population who were aged 18–24 (16%).
Table 2. Comparison of key indicators (median, inter-quartile range)

*Denominator is men aged 18–49, for the sake of comparison with a population-based survey in the Eastern Cape and KwaZulu-Natal provinces in 2008, which found the proportion to be 5.4% (95% CI: 4.4–6.6%) [Reference Dunkle7]. †Denominator is sexually experienced men aged 15–59. Results are marginally higher than estimates from capture-recapture sampling methods, which when applied in four South African cities estimates proportions of between 1.4% in Polokwane and 2.5% in Bloemfontein (Tim Lane, personal communication).
For three behavioural indicators (% of MSM who have had sex with women in the last 6 months, % of MSM who have ever had sex with women and % of MSM with a current regular male partner), model estimates were similar in the age-adjusted and unadjusted analyses (Fig. 1). Estimates of the fraction of men who had recently or ever had sex with other men were also similar in the age-adjusted and unadjusted analyses (Table 2). However, the age-adjusted model estimated substantially higher rates of marriage/cohabitation and multiple partnerships among MSM than the unadjusted model (Fig. 1c-d).
Estimates of HIV prevalence in MSM were also substantially higher in the age-adjusted analysis. The model estimated a median HIV prevalence in South African MSM in 2015 of 34.6% (inter-quartile range (IQR): 31.4–37.2%) in the age-adjusted analysis, compared with 26.1% (IQR: 24.1–28.4%) in the unadjusted analysis (Fig. 1f). In the age-adjusted analysis, estimates of HIV prevalence in MSM were substantially higher at ages 25 and older than in the 15–24 age group, with prevalence in 2012 being highest in MSM aged 35–39 (median 51.4%, IQR: 42.9–60.0%) (Fig. 2). HIV prevalence in other men was estimated to be substantially lower and consistent with data from a 2012 national household survey [Reference Shisana24] (Fig. 2).
HIV incidence rates were also substantially higher in the age-adjusted analysis than in the unadjusted analysis (Fig. 3). Over the 2005–2015 period, the median annual HIV incidence rate in gay men, aged 15–49, was 4.3% (IQR: 3.7–5.0%) in the age-adjusted analysis compared with 2.9% (IQR: 2.3–3.5%) in the unadjusted analysis. Corresponding rates in bisexual men were 2.1% (IQR: 1.8–2.2%) and 1.6% (IQR: 1.4–1.8%), respectively. Incidence rates in heterosexual men and women aged 15–49 were the same in the age-adjusted and unadjusted analyses (1.3% in men and 2.0% in women). As a result, the fraction of total HIV transmission occurring between MSM was estimated to be higher in the age-adjusted analysis (2.5%, IQR: 2.0–2.9%) than in the unadjusted analysis (1.9%, IQR: 1.5–2.1%) (Table 2).
The risk that an HIV-negative individual aged 15 acquires HIV before reaching aged 60 was calculated from the model estimates of age-specific HIV incidence rates over the 2005–2015 period. In the age-adjusted analysis, this cumulative risk of HIV acquisition was 88% (IQR: 82–92%) in gay men, 57% (IQR: 51–63%) in bisexual men, 40% (IQR: 39–42%) in heterosexual men and 52% (IQR: 51–53%) in women (Table 2). The lifetime risks of HIV acquisition in gay and bisexual men were substantially lower in the unadjusted analysis, at 76% (IQR: 64–85%) and 49% (IQR: 45–54%) respectively, but estimates for heterosexual men and women were similar in the age-adjusted and unadjusted analyses.
Discussion
This analysis suggests that if RDS surveys of MSM are biased towards younger MSM, HIV prevalence in MSM populations may be substantially under-estimated. This has important implications for the funding of MSM-focused interventions, especially in countries with generalised HIV epidemics such as South Africa, where MSM-targeted services have historically been limited [Reference McIntyre and Struthers25]. Our intention is not to argue against the use of RDS designs, but rather to argue for additional analyses that can yield more reliable estimates from RDS data. Mathematical models that are calibrated to RDS prevalence data need to control for potential over-sampling of younger MSM in order to derive more accurate estimates of HIV prevalence.
Age selection bias could arise in a number of ways. Wealthier men (who are likely to be older) may be less motivated to pursue the financial incentives offered as part of RDS recruitment efforts [Reference McCreesh10]. Consciously or unconsciously, recruiters may consider certain of their contacts to be more eligible than others based on their age [Reference McCreesh10] and may be more motivated to recruit contacts who conform to an ‘ideal’ youthful gay identity. RDS assumptions may also be violated if individuals recruit from the social contacts to whom they are closest [Reference Phillips11, Reference Yamanis12], who are likely to be similar in age and this may introduce bias if seeds are selected mostly from young MSM [Reference Gile and Handcock13]. Operationally, when research staff explain to participants who is eligible to be recruited via coupons, it is usually phrased as ‘recruit someone like you, whom you know is also MSM,’ or possibly shortened to ‘someone like yourself.’ While the intention is to eliminate ambiguity about who may be eligible to participate and avoid wasting coupons, this may have the unintended effect of enforcing greater homophily among those who are easiest and most available to be recruited than actually exists in the population.
A limitation of this analysis is that we cannot quantify the true extent of the age selection bias (if indeed it exists) with any confidence. To address this problem, we have allowed in the uncertainty analysis for uncertainty regarding the effect of age on the frequency of casual sex as well as the extent of age-related changes in same-sex preference among bisexual men, which yields substantial variation in the simulated age distribution of the MSM population. The findings appear to be relatively robust to this uncertainty, with inter-quartile ranges around the MSM HIV prevalence estimates in the age-adjusted and unadjusted analyses being non-overlapping. However, it is possible that our model does not account for age dynamics that may render the modelled age distribution of the MSM population closer to that sampled in RDS studies. For example, if there have been temporal changes in the fraction of men engaging in sex with other men (either because of increased use of the internet and dating apps, or because of increasing social acceptance of same-sex relationships), this may have had more of an impact at younger ages than at older ages. It is also possible that older MSM may have experienced higher cumulative AIDS mortality than our model assumes, which would also cause the model to over-estimate the relative number of older MSM. Further research is required to characterise the age distribution of the MSM population more accurately. However, it is worth noting that a recent study of MSM attending a Cape Town STI clinic found the median age of MSM to be 32 years [Reference Rebe26], substantially higher than the median ages of 22–24 years estimated in South African RDS surveys of MSM [Reference Lane1, Reference Rispel3, Reference Cloete4, Reference Kufa6, Reference Vu14]. Other investigations in Swaziland, Cameroon, China and Brazil [Reference Rao27–Reference Zhao29] have found that MSM recruited through RDS have a significantly younger age profile than MSM recruited through venue-based sampling, although other studies in the USA and Guatemala have not confirmed this [Reference Paz-Bailey30, Reference Wei31].
Although this analysis has focused on HIV prevalence as the main outcome of interest, similar biases may be expected in the estimation of other indicators if RDS samples are biased towards younger MSM. Our results suggest that behavioural indicators such as the fraction of MSM in cohabiting/marital relationships and the fraction of MSM with multiple partners could also be under-estimated if sampling is biased toward younger MSM, consistent with surveys of MSM in Swaziland and China [Reference Rao27, Reference Zhao29]. Levels of HIV diagnosis and ART coverage are typically higher in older HIV-positive adults than in younger HIV-positive adults [Reference Huerga32, Reference Grobler33] and over-representation of young MSM may, therefore, lead to under-estimation of HIV diagnosis and ART coverage in MSM, with consequent problems in estimating progress towards the 90–90–90 targets set by UNAIDS [34]. Previous analyses have noted that in generalised epidemic settings, HIV prevalence has declined much more substantially in pregnant women than in women in the general population, which is likely to be a reflection of the younger age of pregnant women and age differences in HIV prevalence trends [Reference Eaton35]. Failure to account for these age biases in sampling is likely to lead to an over-estimation of the extent of HIV incidence declines over time, given that prevalence declines have mostly been limited to younger adults.
This analysis estimates that gay men in South Africa have an 88% lifetime risk of acquiring HIV and an annual HIV incidence rate that is more than three times that in heterosexual men. HIV acquisition risk is also elevated in bisexual men. Other modelling studies suggest that much of the excess HIV risk in MSM is attributable to the higher probabilities of HIV transmission in anal intercourse when compared with vaginal intercourse and the higher frequency of anal intercourse associated with role versatility [Reference Beyrer36]. Although our estimates of HIV incidence in MSM are high, other sources have estimated HIV incidence rates higher than ours. A longitudinal study of MSM in a rural South African district yielded an HIV incidence estimate of 12.5% per annum, though with wide 95% confidence intervals (8.1–19.2%) [Reference Lane37]. This district had the highest antenatal HIV prevalence in South Africa in 2012 [38] and might therefore not be representative of the country as a whole. In addition, the sample was recruited through RDS methods and the incidence estimate may, therefore, be biased towards relatively young MSM. Another analysis, based on the Modes of Transmission model, estimated an annual HIV incidence in MSM of 20% and based on this estimated that 8% of all adult HIV transmission in South Africa was transmission between MSM [39, Reference Gouws and Cuchi40]. However, the model assumed an HIV prevalence in MSM of 30%, which does not seem compatible with an annual HIV incidence of 20%. A limitation of the Modes of Transmission model is that it is a static model and consistency between prevalence and incidence estimation is therefore not imposed.
Regardless of the exact level of HIV incidence in MSM, it is clear that South African MSM are at an extremely high HIV risk compared with heterosexual men. Interventions that are focused on the specific needs of MSM and the social spaces frequented by MSM need to be sustained and enhanced. Pre-exposure prophylaxis [Reference Fonner41], self-testing [Reference Carballo-Diéguez42] and the use of peer educators to encourage testing [Reference Geibel43] are examples of novel interventions that could be targeted to South African MSM. Further work is required to assess the feasibility of these and other interventions in MSM in low- and middle-income countries.
Acknowledgements
This research was supported by the South African National AIDS Council (L.J., P.M.); the Canon Collins Educational and Legal Assistance Trust (P.M.); the International AIDS Vaccine Initiative (P.M.); and the German Academic Exchange (P.M.).
Declaration of interests
The authors have no competing interests to declare.
Supplementary material
The supplementary material for this article can be found at https://doi.org/10.1017/S0950268818000961


