


INTRODUCTION
Puumala virus (PUUV) infection, also known as nephropathia epidemica, is a zoonotic disease mainly characterized by sudden onset of fever, myalgias, headache and occasionally renal failure [Reference Vapalahti1]. Bank voles (Myodes glareolus) are the host reservoir of PUUV, a member of the rodent-borne Hantavirus genus of the family Bunyaviridae. PUUV can remain infectious in bank-vole cage beddings for 12–15 days [Reference Kallio2]. The route of infection to humans is believed to occur through aerosolized rodent excreta. Exposure may occur during a variety of occupational and recreational activities, such as working with hay, cleaning barns or summer cottages, cutting wood and entering buildings infested with rodents, especially when the premises are poorly ventilated [Reference Vapalahti1, Reference Settergren3]. The incubation period varies between 2 and 6 weeks [Reference Kramski4]. Diagnosis is based on serological tests, detection of PUUV IgM or low avidity of PUUV IgG, PUUV RNA detection is also possible. Antibodies arise within the first 6 days of illness. The infection induces lifelong protective immunity against re-infections. No specific treatment or vaccine is available, and full recovery may take several weeks. Some patients develop severe disease requiring hospitalization and haemodialysis. A few patients may suffer long-term sequelae, such as hypertension [Reference Makela5] or impaired hypophyseal function [Reference Hautala6]. The overall reported case-fatality proportion is quite low (<0·25%) [Reference Settergren3]; in Finland, only 0·03% of cases were fatal during 1989–1996 [Reference Brummer-Korvenkontio7].
The National Infectious Disease Registry (NIDR) was established in 1995 and PUUV became a notifiable disease. Since then all Finnish clinical microbiology laboratories performing PUUV diagnostics have reported positive serological tests to the NIDR. In a previous study [Reference Rose8] from years 1995–2002, the annual number of notifications ranged from 600 to >2000 (annual incidence rate 12–42 cases/100 000 population). The incidence rates showed marked geographical differences. Earlier observations pinpointed that outbreaks have usually occurred every 3–4 years. No recent data on hospitalization or mortality exist. Since 2004, NIDR notifications have included persons' national identity codes, which allowed us to obtain the dates of deaths from the National Population Registry. In this paper, we describe the overall and regional disease burden of PUUV infections in Finland during 1995–2008. We also report the results of a laboratory survey conducted to identify differences in diagnostics, possibly affecting the number of notified cases.
METHODS
Surveillance
In Finland (2008 population: 5·3 million), the national healthcare system is organized into 20 geographically and administratively distinct healthcare districts (HCDs). Since 1995, all Finnish clinical microbiology laboratories have reported serological tests positive for PUUV to the NIDR. Each notification includes data on age, sex, date of diagnostic specimen and place of treatment regarding the HCD. Multiple notifications of persons with the same date of birth, sex and place of treatment received within a 12-month period were combined as one case; since 2004, this was done using the unique national identity code.
Case definition
Cases were persons with serological tests positive for acute PUUV infection who were reported to the NIDR during 1995–2008.
Other data collection
Data on hospitalization related to PUUV were available for years 1996–2007 and were obtained from the National Hospital Discharge Registry using the International Classification for Diseases 10th Revision (ICD-10) code specific for ‘Puumala virus infection’ (A98.5). Dates of deaths for cases notified to the NIDR during 2004–2008 were obtained from the National Population Registry using the national identity code. Deaths related to PUUV infections were available between 1998 and 2007 and were identified from death certificates of the National Death Registry, in which underlying and immediate causes of deaths and contributory factors are coded according to ICD-10 criteria. Data on occupational disease notifications related to PUUV infections were available between 1995 and 2006 from the Finnish Occupational Disease Registry.
Calculation of rates and statistical analysis
Data from the National Population Registry for 1995–2008 were used as a denominator to calculate age- and sex-specific incidence rates and mortality. For male:female incidence rate ratios (RRs), 95% confidence intervals (CIs) were calculated. The average annual incidence rates during the surveillance period in different HCDs were calculated using the total number of cases and population statistics during 1995–2008. Rates for hospitalizations were calculated similarly for years 1996–2007. Presence of monotonic trends in age- and season-adjusted incidence over the years was assessed by the Mann–Kendall test, taking into account the serial correlation of the time series by block bootstrapping [Reference Hipel and McLeod9]. Size of the trend's slope was estimated by Sen's method [Reference Sen10]. We applied locally weighted smoothing (Lowess) [Reference Cleveland11] to visualize the trends. Mann–Whitney test was used to assess whether the observed differences between groups were statistically significant. Data were analysed by Stata version 9.2 (Stata Corporation, USA) and R version 6.5 (R Foundation, Austria) software. Maps were created using ArcView version 9.2 software (ESRI, USA).
Laboratory survey
In June 2004, a standardized questionnaire was sent to all clinical microbiology laboratories (n=21) that had reported at least one serological test positive for PUUV since 1995. The questionnaire covered current methods used for diagnosing PUUV infections, changes in diagnostics, number of specimens examined by different methods and general principles for NIDR notifications.
RESULTS
During 1995–2008, a total of 22 681 cases of PUUV infections were notified to the NIDR (range by year 757–3191, range by HCD 162–2648). The average annual incidence rate was 31·1 cases/100 000 population (range by year 14·7–60·5, range by HCD 6·3–125·3). The highest number of cases were detected in Northern Savo (HCD 11, n=2648) and Central Finland (HCD 12, n=2625), comprising about 25% of all cases notified during the study period, while incidence was highest in Southern Savo (HCD 8) and Eastern Savo (HCD 9) (Table 1, Fig. 1 a).
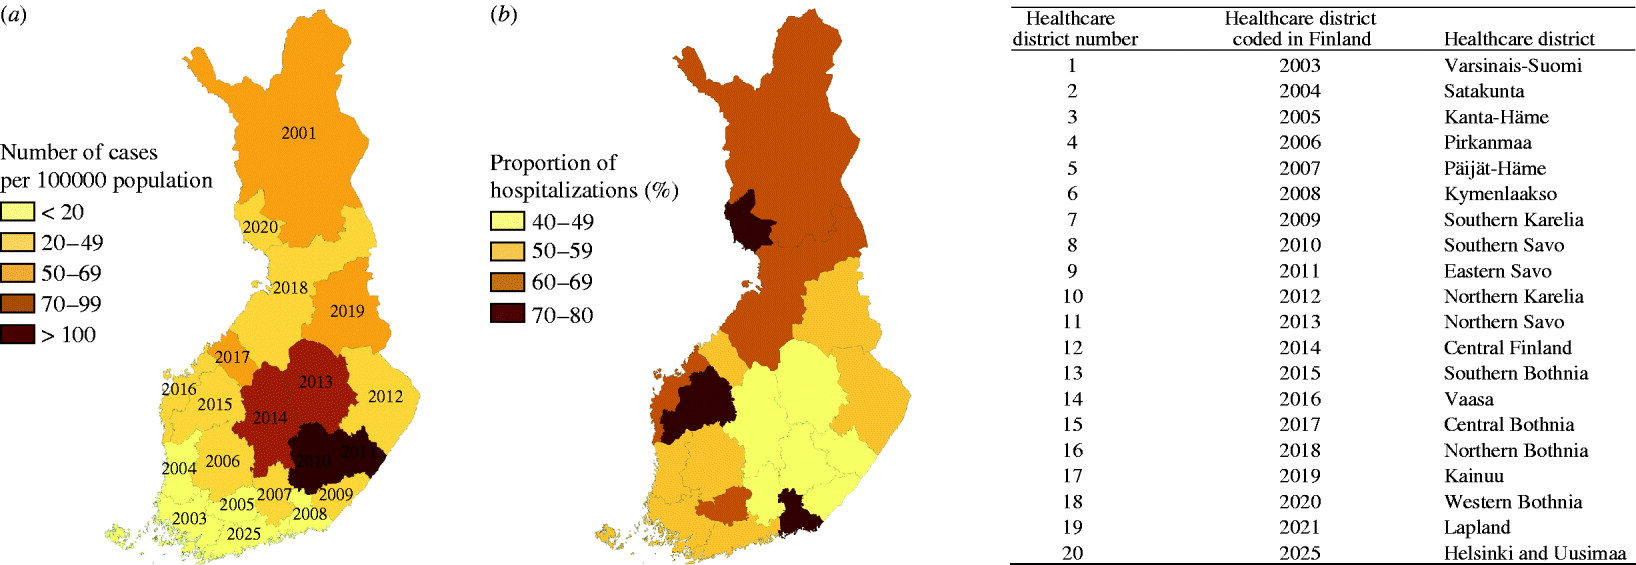
Fig. 1. (a). Average annual incidence of Puumala virus infections by healthcare district in Finland, 1995–2008. (b) Proportion of hospitalized cases of the total number of cases by healthcare district in Finland, 1996–2007.
Table 1. Number of cases/100 000 population by year and healthcare district in Finland, 1995–2008

The incidence was higher in males than females (Table 2); 62% of the cases were males. Mean age was higher in female cases (47 vs. 44 years, P<0·01). The highest incidences were observed in the 35–49 and 50–64 years age groups for both genders. Male:female rate ratio was highest in persons aged 20–34 or >74 years, and lowest in persons aged 50–74 years.
Table 2. Incidence of Puumala virus infection by age and sex in Finland, 1995–2008
CI, Confidence interval.
* Average incidence during the study period (cases/100 000 population).
† Male:female ratio.
During 1995–2006, there were 590 occupational notifications related to PUUV infection (range by year 21–89), representing 3% of all cases notified to the NIDR during this period (range by year 2–9%). Of the 590 occupational notifications, 447 (76%) were for males; the mean age of occupational cases was 43 years (range 16–72). Most (547/590, 93%) were related to farming or forest work. The most common occupations were farmer, rancher and forest worker.
During 1996–2007, a total of 9599 persons hospitalized due to PUUV infection as the primary diagnosis were identified (range by year 461–1279), resulting in 50129 patient-days (range by year 2427–6737). The proportion of hospitalized cases of the total number of cases varied annually between 48% and 64% and by age group, being highest in the oldest age groups (61–77%). Mean length of hospitalization was 5·2 days (range by year 4·2–6·0); this varied by age group (4·3–9·2), being shortest in children and longest in the elderly. Of the hospitalizations due to PUUV infection, 6069 (63%) were for males. The proportion of hospitalizations due to PUUV infection as the primary diagnosis by HCD is shown in Figure 1 b; it was highest in Kymenlaakso (HCD 6, 80%) and lowest in Southern Karelia (HCD 7, 41%) and Päijät-Häme (HCD 5, 41%). In general, the highest proportions of hospitalized cases were detected in HCDs with the lowest incidences of PUUV infection, and the lowest proportions were detected in HCDs with the highest incidences of PUUV infection.
During 2004–2008 based on the data of the National Population Registry, 15 cases (range by year 0–6) died within 28 days (0·57 deaths/million population, 0·14% 28-day case-fatality proportion); ten of the deaths occurred within 7 days of testing positive for PUUV (0·38 deaths/million population, 0·095% 7-day case-fatality proportion). Of the 15 deceased cases, eight were males. Eight persons were of working age (35–64 years); the remainder were elderly (>64 years). During 1998–2007 based on the data of the National Death Registry, there were 13 certificates issued in which PUUV infection was listed as the underlying cause of death (range by year 0–4); nine (70%) of these were for men (average annual mortality 0·25 deaths/million population, case-fatality proportion 0·08%).
Changes in monthly incidence at the national level showed strong seasonality and periodicity (Fig. 2). Almost every year, the epidemic started in late summer, with incidence increasing steeply in late autumn or early winter, resulting in an epidemic peak, followed by a low incidence period during spring. The male:female rate ratio did not differ between epidemic peaks and low incidence periods. Since 1998, two consecutive years with high epidemic peaks were followed by one year with a low epidemic peak. After 2004, the epidemic peaks were similar, except for 2008, in which the peak was exceptionally high. In 2008, half of the HCDs (10/20) had the highest annual incidence during the study period; most of these, including Helsinki & Uusimaa (HCD 20) (7/10), previously had a low annual incidence, and only two (2/10) had a high incidence (HCDs 8 and 11) (Table 1). Prior to 2008, in addition to the typically affected districts in Eastern and Central Finland (Fig. 1 a; HCDs 8, 9, 11, 12), exceptionally high annual incidence rates were seen in neighbouring districts: Kainuu, 1999 (HCD 17, 155·3/100 000), Central Bothnia, 2002 (HCD 15, 152·3/100 000), and far-north in Lapland, 2007 (HCD 19, 164·3/100 000). An increasing trend occurred in the incidence of the disease (Sen's slope of the trend 0·008, P<0·05), which was also significant in both genders (Sen's slope of the trend for females 0·009, P<0·05, vs. males 0·008, P<0·05). In general, the monthly number of hospitalizations due to PUUV infections/100 000 population followed the monthly incidence of cases reported to NIDR. However, no statistically significant trend in hospitalizations was detected.
Fig. 2. Monthly number of all Puumala virus cases and hospitalizations due to Puumala virus infection/100 000 population in Finland, 1995–2008.
Laboratory survey
A total of 20 laboratories (95%) responded. Fourteen laboratories performed PUUV diagnostics, four of them throughout 1995–2004. These four laboratories annually accounted for 88–97% of all positive tests notified to the NIDR, one of them for 73% of all NIDR notifications. Two laboratories used IgG immunofluorescence test (‘granular fluorescence pattern’ test and avidity) throughout 1995–2004; one laboratory also used an in-house IgM test (μ-capture EIA). Three laboratories used commercial IgG and/or IgM EIA tests, which were also adopted by one laboratory in October 2001, after an in-house test was abandoned. Seven laboratories used a commercial immunochromatography test [Reference Hujakka12] since 2001; most of them (6/7) used a reference laboratory to confirm their positive findings. Each year, the number of cases diagnosed using this commercial immunochromatography test remained <6% of cases diagnosed with other methods. All laboratories only notified new serological findings, not ‘old immunity’. Positivity of specimens varied between 10% and 25% by laboratory and year. The proportions of positive specimens were higher (23–25%) during the years when the annual number of cases exceeded 2000, and lower (10–11%) when it remained <1000.
DISCUSSION
Our nationwide population-based study showed that PUUV infections are a major public health problem in Finland and the burden of the disease is growing. Although mortality was low, we estimated that more than half of the PUUV cases were hospitalized for an average of 5 days, for an annual contribution of 500–1300 additional patient-days per million to the Finnish healthcare system. The principal population at risk was males of working age. Farming and forestry was the most common occupational exposures. However, a minor proportion of all cases were reported as occupational disease. Seasonality was strong, and marked differences emerged in the incidence rates between regions. New epidemic regions were also uncovered.
A survey conducted by Heyman & Vaheri [Reference Heyman and Vaheri13], accounted for a total of 33 587 PUUV cases in the EU between 1990 and 2006, nearly 70% of which were reported by Finland.
In our study, the average annual incidence rate during 1995–2008 was 31 cases/100 000 population, which is higher than the rates previously reported in Finland during 1989–1996 (19 cases/100 000 population) [Reference Brummer-Korvenkontio7]. The true incidence of PUUV infection is likely to be higher, as the notification system detects only patients referred by a physician for a laboratory test. Based on a Finnish seroprevalence survey, the actual national incidence is estimated to be 3–6 times higher, ∼6000 new cases each year [Reference Vapalahti14]. Another Finnish seroprevalence study [Reference Brummer-Korvenkontio7] also suggested that underdiagnosis is common, estimating that only 13% of PUUV infections are diagnosed.
The increasing trend in the incidence of PUUV infections in Finland detected here is in line with observations from other European countries [Reference Heyman15]. Recently, a rising number of PUUV epidemics have been reported in several European countries. In the state of Baden-Württemberg, Germany, in the 2007 endemic year the state-level incidence was 10 times higher (10 cases/100 000 population, range by district 0–90 cases) [Reference Winter16, Reference Schwarz17] than in the previous endemic year in 2005 [Reference Heyman18]. In some districts there were no cases and in others (e.g. endemic region of Swabian Alb) incidence rates increased to more than 90/100 000 population [Reference Schwarz17]. In France, in 2005, incidence rates varied between 0.9 and 32.7 cases/100 000 population in endemic districts, similar to observations in the neighbouring Belgic provinces for the same endemic period (incidence by province 5·9–33·8/100 000 population) [Reference Heyman18]. In northern Sweden, 3- to 4-year periodicity has been noted in the number of PUUV infection cases, with the latest outbreak reported in 2007. At that time, the annual county-level incidence was 313 cases/100 000 population, which was almost tenfold higher than the annual incidence in 2002 [Reference Petterson19]. Comparison between countries would be impractical and biased by differences in applied surveillance methods, notification legislation (e.g. notification of PUUV infection is not mandatory in France) and population size of the administrative geographical unit if the endemic area does not cover it entirely. Sequential studies from the same area and using the same surveillance methods and case definitions (as performed in both Germany and Sweden) report higher peak periods than previously, stressing that PUUV infection has emerged throughout Europe. However, a review of data collection and careful analysis are essential before drawing any firm conclusions. The Finnish surveillance system, based on nationwide laboratory reporting, ensures an appropriate background since it was established in 1995. Moreover, the diagnostic system has been established and widely used from the beginning of the 1990s throughout Finland.
In the eastern part of Finland, the average annual incidence was 25 times higher than in the southwest regions. These findings are consistent with a previous study from 1989 to 1996 [Reference Brummer-Korvenkontio7]. The regional differences probably reflect the abundance of bank voles and also the proximity of housing to these forest habitats. Beyond this, the clinical alert is presumably higher in endemic districts, as also suggested by the proportion of hospitalizations [Reference Brummer-Korvenkontio7]. The proportion of hospitalized cases was lowest in districts with the highest incidences, which may be due to better awareness of nephropathia epidemica among clinicians. Many of the missed cases revealed by earlier seroprevalence studies are probably from non-endemic districts and have a relatively milder clinical course. PUUV infection is generally common in regions where bank-vole populations are cyclic, as in most areas of Finland, with density cycles of 3–4 years (H. Henttonen, personal communication). Clear cyclicity in human cases on a national level is mostly explained by cyclic changes in bank-vole population dynamics, probably caused by few specialist predators [Reference Kallio20]. In Central Europe, on the other hand, particularly warmer climate conditions and other weather conditions, that typically cause good seed crops of oak and beech (mast years) facilitate abundance of rodents, and consequently, hantavirus infections [Reference Schwarz17, Reference Tersago21]. In Finland, the change in seasonal pattern after 1998 is apparently due to the previously geographically non-synchronous 3-year bank-vole cyclicity pattern becoming synchronized throughout most of Finland. Bank-vole densities tend to be high in two consecutive autumns/early winters, allowing the virus to spread efficiently in rodent populations, which is then reflected temporally and geographically in the number of PUUV cases. This is the pattern in many of the HCDs, while in other districts (e.g. along the west coast, HCDs 13–15, and in far-north Lapland, HCD 19) the observed long-term periodicity of human incidence suggests different bank-vole population dynamics, probably due to the different living environment of the reservoir. During the 14-year study period, in districts neighbouring those with the highest number of cases (HCDs 11 and 12) at least one year showed an extreme epidemic (1999, HCDs 16 and 17; 2002, HCD 16) and several years large epidemics, suggesting influence from the most infected areas. We observed an unexpectedly high annual incidence in Lapland in 2007, while in most parts of the country there was no epidemic that year. Results for the Helsinki metropolitan region (Uusimaa, HCD 20) follow the general national picture, reflecting that many urban dwellers across the country spend their free time in the countryside. These observations underline the importance of spatial effects, but fail to explain the patterns sufficiently. The reasons for the extreme epidemic in 2008 (which had the highest ever number of reported PUUV infections) was evidently due to the unforeseen abundance of bank voles synchronically throughout the most populated areas of Finland during this period; further, weather conditions may have assisted in maintaining high abundance of the reservoir (H. Henttonen, personal communication).
Occupational and recreational factors also influence contacts with rodents and exposure to rodent excreta. Urban dwellers with summer cottages typically acquire the infection in August [Reference Brummer-Korvenkontio7], and those living in the countryside close to forests may be exposed in late autumn to rodents, which move closer to human habitats at this time looking for shelter. Due to specific features of the NIDR, in the analysis we used data on place of treatment, which is often (but not always) the place of residence. In addition, the basic spatial unit was the HCD, determining the resolution of geographical distribution studied. Borders may overlap with risk areas, as districts are administrative units.
Males of working age were dominant among cases, in accord with previous studies (Finland [Reference Brummer-Korvenkontio7], Sweden [Reference Petterson19, Reference Settergren22], Belgium, France, Germany [Reference Heyman18, Reference Crowcroft23]). However, females slightly surpassed males concerning the increase in incidence. The highest incidences occurred in the 35–64 years age group for both sexes. The male:female rate ratio in the 50–74 years age group was the lowest, not only in Finland but throughout Europe. Compared to other countries, the average male:female ratio was also smaller in Finland [Reference Heyman18, Reference Crowcroft23, Reference Groen24]. We assume that these findings are partly related to changes in lifestyle, differences in recreational activities and risk behaviours associated with certain ages and genders. Better awareness and clinical alerts, and the proportion of smokers in gender and age groups [Reference Vapalahti25] may also play a role.
Only a minority of the cases were registered as occupational infections by clinicians. These cases were predominantly associated with farming and forestry, consistent with other studies [Reference Vapalahti14, Reference Zoller26–Reference Deutz28]. Notification is well established among farmers and forestry workers and is associated with social compensation; in other professions, notification may be overlooked.
More than half of the cases were hospitalized. However, hospitalization rates varied between age groups and also between districts. Significantly higher proportions of cases aged <20 years and >64 years were treated in hospitals than cases aged between 20 and 64 years. Mean duration of hospital stay was associated with age, with longer hospitalizations for those aged >64 years. Although PUUV infection is generally considered mild, in 1996–2007 more than 50 000 patient-days were due to PUUV infection. In view of the growing number of positive cases, PUUV infection is anticipated to cause an increasing burden on healthcare in the future. In Finland, PUUV has become the most prevalent serious febrile infection in adults after influenza, an observation consistent with a report from the four northernmost Swedish counties [Reference Olsson29]. In the current study, we assessed the burden due to the acute phase of the disease and did not include data about the long-term consequences. The latter could be estimated by linking the national register to other existing databases. Deaths from PUUV were rare, in line with earlier studies [Reference Kruger, Ulrich and Lundkvist30, Reference Settergren31]; however, with the advantage of receiving information from several registers, a somewhat higher estimate of case fatality (∼1/1000) was obtained.
No major changes were seen in laboratory methods or in the number of laboratories that would have markedly influenced the number of notifications. The commercial immunochromatography test introduced by seven laboratories in 2001 contributed to diagnosis of only a small proportion of cases within the study period. Although an increasing number of laboratories have begun to perform PUUV diagnostics, most of the tests were done in one laboratory with the same methodology for the entire period.
Our study collected the most recent surveillance data on PUUV infection in Finland. These results can form the basis for further studies aimed at revealing the properties of time and space distribution of PUUV epidemics in Finland, as well as the risk factors for humans. Future studies should also aim at investigating the human–animal reservoir interaction and the environmental and climate effects on both human behaviour and reservoir population dynamics.
ACKNOWLEDGEMENTS
We thank Joonas Iivonen and Marja Snellman for their collaboration during data collection. Peter Makary was an EPIET fellow during this research project. His EPIET fellowship was funded by European Commission DG SANCO.
DECLARATION OF INTEREST
None.


