


Introduction
The Devon Island ice cap lies on the eastern part of Devon Island (Fig. 1) and covers 15 570 km2, 31% of the island's area. The mass balance study excludes the arm of the ice cap which projects to the south-west and considers the remaining 12 790 km2. The ice cap has a maximum elevation of 1 885 m; ice (lows from it into a series of valley glaciers on its northern, eastern and southern sides. The ice cap edge is generally at an altitude of 600 m but reaches sea-level in the south-east. The ice is everywhere sub-polar, the 12 m ice temperature being — 23°C at 1 800 m in the firn zone, — 18°C at 1 300 m in the superimposed-ice zone, and — 13°C at 300 m in the ablation zone.
The mass-balance terminology and symbols used in this paper are as given in the Journal of Glaaology (Anonymous, 1969).

Fig. 1. The Devon Island ice cap: traverse routes and mass-balance regions.
Methods
The network of stakes is arrayed on a series of traverses between the edge and the top of the ice cap. The first traverse (Fig. 1) was set up on the north-west side of the ice cap by S. Ekman in 1961. The author set up the south-east, south-west and northern traverses in 1962 and the eastern traverse in 1963. The eastern traverse gave very similar results to those of the southeast traverse and so was discontinued after 1965. It was never possible to extend the northern traverse to sea-level and, for logistic reasons, this was discontinued in 1965. The traverses were established on straight lines using a series of snow cairns. Altitudes were taken several times along each traverse with two Paulin altimeters. Changes of barometric pressure were recorded on a micro-barograph at 1 317 m on the north-west side of the ice cap. The altitudes are believed to be accurate to within ±30 m. Distances were measured on several occasions using the odometer readings from two tracked vehicles. The readings from the two odometers agreed to within 1%. Azimuths along each traverse, and geographical coordinates of the end points and of points where the azimuth changed, were determined by sun shots. Each position was accurate to ±200 m. Odometer readings, which of course represent distance travelled on the ground, have been adjusted to fit the geographical coordinates.
A map of the ice cap at a scale of 1: 500 000 has been made by combining the traverse altitudes and adjusted distances with the outline and form lines of the National Topographic System map of Devon East.Footnote *
Each traverse on the ice cap consists of stakes, with dye and percolation trays in the accumulation zone, placed every 1 2 km, with a maximum elevation interval between them of 60 M Measurements soon showed that, in contrast to the ice cap, the valley glaciers have a great areal variability of net balance (bn) in any one elevation interval. As the north-west part of the ice cap (Fig. 1) has only one valley outlet glacier (Sverdrup Glacier) this region was considered to be the most suitable one on the Devon Island ice cap for a mass balance study; it is also the smallest of the balance regions. The south-east, south-west and north-east region mass-balance results are less accurate than the north-west region results (they have a stake density of 0.01 stakes km-2 compared to 0.04 stakes km-2 in the north-west) and the traverses there were set up to give overall coverage of the mass balance of the ice cap.
The Sverdrup Glacier is 27 km long and is fed by two major tributaries from the ice cap. Aerial photographs and observations during four field seasons show only insignificant glacier-calving. Calving has not been considered in the mass balance computations.
Measurement of mass balance
As the techniques of measuring mass balance on temperate and sub-polar glaciers necessarily differ, the methods used on the Devon Island ice cap will be described and discussed in detail.
In the accumulation zone two systems have been used, one in the zone where accumulation is dominantly in the form of superimposed ice, and the other in the area where accumulation is dominantly in the form of fun. In most studies the growth of superimposed ice has been measured by the stake method. However, stakes may serve to channel melt water down through the snow (Fig. 2, profile A-B). Excessive superimposed-ice growth will then be recorded when measuring the change of ice level on the stake. This error occurs whenever there is some firn or snow overlying the ice at the time of measurement. On the Devon Island ice cap dye has been used to measure the growth of superimposed ice. In 1963, dyes were buried at different depths in the snow above the dry snow line. Dyes placed at depths of 200 mm or more showed no visible melting effects. Dye (potassium dichromate or uranin) is placed too mm below the snow surface after the end of the melt season so that by the beginning of the next melt season it is buried beneath about 400 mm of snow. The dye colours the melt water percolating through it in the following melt season and the melt water refreezes as a layer of coloured superimposed ice. Unless any dyed ice or firn appears at or near the surface before the end of the melt season and thereby itself influences the melting process, the layer of coloured ice represents the balance year increment of superimposed ice (e.g. profiles A-B and A C in Fig. 2). The change of mass above the ice can be determined by density sampling. Where the superimposed ice is itself exposed at or near the surface by the end of the melt season (e.g. A-D and A-E in Fig. 2) stake measurement is adequate.
Above the climatic firn line (a line above which the upper few metres of the ice cap is composed dominantly of firn) on a sub-polar ice cap, melt water is retained in underlying layers of firn, where it refreezes. The problem is how to measure the net balance when a large part of the accumulation is transferred to layers deeper than the surface balance year layer by a process of melt, percolation and refreezing. In addition, during the summer, rain, and snow which subsequently melts, is retained as accumulation above the firn line due to an absence of run-off there. A study of snow and firn stratigraphy in a pit can detect annual layers in the percolation faciès (Reference BensonBenson, 1961) and, with varying success (Reference PicciottoPicciotto and others, 1968), in the dry-snow faciès. However, the pit method is not valid in the wetted facics (Reference Benson and ÖuraBenson, 1967) as percolation penetrates more than one year's accumulation. As a result, any one annual layer contains accumulation from more than one year, and yet does not contain all the accumulation from the year when the layer was deposited.
To measure the mass balance in the firn zone of the Devon Island ice cap, percolation trays have been placed just below the surface at the end of the melt season. At the end of the following balance year all accumulation above the bottom of the tray is measured and the original mass of the tray contents subtracted to give the net balance (bn). Whenever observations are made in spring rather than autumn, the tray is placed at least as deep as the base of the current balance year's snow, A block is carefully dug from the surface, the tray placed in the bottom of the hole and the block replaced. The density of the upper layers of snow is measured near the site of the tray.
Another method has been used occasionally for measuring mass balance in the firn zone. Firn densities are measured to a reference level predicted to be below the depth of maximum percolation (on the Devon Island ice cap this is generally at a depth of less than 2 m). These measurements are repeated at the end of the melt season to the same reference level and the change of mass computed. However, the method is very time-consuming and several points at each locality need to be sampled to obtain a representative mean. The effort is considerably reduced with the tray method as this involves measurements through no more than the current balance year layer. The depth of percolation in the firn is measured every year with dye on the Devon Island ice cap and percolation to over 2 m has been traced in firn using this method.
In the ablation zone stakes and wires frozen into the ice have been used to measure the amount of ice loss each year.

Fig. 2. Growth of superimposed ice at 1 468 m elevation on the Devon Island ice cap June-July 1961. A is the surface level in August 1960, B in late June 1961, C on 17 July 1961, D on 25 July 1961 and E on 29 July 1961.
Computation of the mass balance in each region
The mass balance in each region was first computed from:
where S is the area of the altitude interval between contour lines, z1 and z2 in m2, b n is the mean net balance for the altitude interval z1 , to z2 in kg m -2 a-1 of water and Bt is the total balance, positive or negative, in kg of water. The net mean balance ( b n) is calculated from a regression analysis of bn on elevation.

Fig. 3. Ablation across the Sverdrup Glacier at 300 m elevation in 1961 and 1962. A and B mark the glacier margin.
Table I. Mean net balance of the Devon Island ice cap 1961-66*

The above method is unreliable if there is high variability of net balance in any one altitude interval. These variations on the Devon Island ice cap and the outlet glaciers are associated mainly with variations of slope and surface albedo. For example, on Sverdrup Glacier the albedo in summer at 300 m elevation varies from 40-50% in the middle of the glacier to 63% at the margins (Reference KeelerKeeler, 1964). As a result ablation is often higher in the middle of the glacier than at the margins (Fig. 3). For this reason the mass balance on the Sverdrup Glacier has been calculated from maps of net balance and not according to Equation (1). On the ice cap the areal variation of albedo, except for the steep ice cap edge, is slight. Variability of ablation in any one altitude interval on the ice cap is associated with variations in the angle of slope. Snow accumulation, higher than the areal mean, occurs on steep slopes of the ice cap, which in almost every case face in the direction of the ice-cap edge. There may be no snow accumulation on the brow of slopes. As a result, ablation of the ice surface in summer begins soonest on the brows, and a negative balance is often measured there while a positive balance is measured on a nearby steep slope. However, the scatter of mass-balance measurements is much smaller on the ice cap than on the valley outlet glaciers. For example, for the 6 years 1961-66 in the north-west region the standard error of estimate of bn (Sb n ) ranges from 9.0 kg kg m-2 a-1 in 1961 to 77.0 kg m-2 a-1 in 1966. However, Sb n ranges from 128.0 kg m-2 a-1 in 1965 to 263.0 kg m-2 a-1 in 1962 on the Sverdrup Glacier. The standard error of estimate for the ice cap section of the regression analyses has been considered low enough to use Equation (1) in determining the mass balance there. The results are shown in Table I. The mass-balance stake network was set up to give an even distribution with altitude and errors in bn in for any altitude interval resulting from the variability of individual values of bn are self-cancelling rather than cumulative. This being so the final error of Bt is less than the standard error of estimate of bn which has a mean value of 46 kg m-2 a-1. However, the mean net balance bn in Table I also includes errors from the Sverdrup Glacier net ablation maps. Errors there are difficult to assess as the total variability of bn is unknown. However, the error of Bt for the Sverdrup Glacier is estimated to be not more than ± 15% which is calculated to contribute a 5% error to the value of Bt in the northwest region. Assuming the standard error of the ice cap mass balance is equal to Sbn , the maximum total error of b n in Table I becomes ±54.0 kg m-2 a -1. The error of b n in the south-west and south-east parts of the ice cap is estimated to be ±70 kg m-2 a-1.
Pit stratigraphy as a climatic record
To determine whether the mean net balance in the firn zone has varied during the past few decades, a 10 m pit was dug well above the wet-snow line (Reference Benson and ÖuraBenson, 1967) at an elevation of 1 787 m. As the pit was dug in the percolation facies each annual layer consists of one series of soaked snow layers overlying a series of dry-snow layers. Occasionally, massive percolation down ice glands obscures part of the stratigraphy but, by examining all four walls of the pit, the pattern of general percolation was determined in all but three cases. In each of these cases the base of the balance year accumulation was placed at the level of the thickest ice layer. This interpretation was based on observations made in August 1962 when a thick ice layer was found at the base of the 1962 balance year accumulation al various elevations above the firn line. The ice layer formed in what had previously been the basal depth-hoar layer. The results are shown in Figure 4. Although a core was taken from 10 m to 22 m depth, detailed dating of the layers was not possible due to the formation of occasional ice glands as thick as the 70 mm diameter core itself in warm summers. The results in Figure 4 therefore refer to the pit analysis only.

Fig. 4. Net balance at 1 787 m elevation on the Devon Island ice cap.
A record of the scale of melting each year is preserved in the stratigraphy of the firn zone of the ice cap. Consequently, pits and cores (where approximate dating of different levels can be calculated from the mean net balance (< b n>) measured at the surface) were studied at eight locations above the climatic firn line. The percentage of the total area formed by ice rather than firn on one face of each pit or core (cut vertically down the middle) was measured to determine whether the amount of ice (i.e. melting) varied with depth. The results are presented in Table II. However, although it is often assumed in firn stratigraphy studies that the number of ice layers in any one balance year's accumulation above the firn line is directly associated with the amount of melting during the summer, this is not strictly correct. Ii melting occurs unusually early in a melt season percolation takes place through snow several degrees below the freezing point. General percolation may then be slight but percolation down preferred channels, i.e. ice glands, may be rapid and can take melt water deep into the snow where it refreezes as ice layers. For example Reference BensonBenson (1961) found deep percolation through snow at a temperature of — 5°C to — 10°C during a spell of warm weather in Greenland in 1954. On the other hand, heavy melt throughout a summer, beginning after the balance year snow has been warmed to near the freezing point, causes deep general percolation but does not necessarily cause the formation of numerous or thick ice layers. For example, in early June 1962 a few days of warm weather caused melting over the entire Devon Island ice cap. At high elevations several ice layers were formed throughout the 0.3 to 1.2 m thick snow pack whereas general percolation reached a depth of only a few centimeters. Further melt in July and August of the same year completely soaked the balance year's snow but did not increase the number of melt layers. A variation in the number of ice layers with depth in the percolation zone may, therefore, be associated not only with the amount of melting but also with the time of onset of the melt.
Table II. Variation of the amount of ice with depth (per cent of ice per meter of core) at different elevations on the Devon Island ice cap, July 1962


Fig. 5. Depth of percolation in each annual layer 1948-66, 1 879 m elevation, Devon Island ice cap.
Grain shape may be used to measure the scale and depth of general percolation of melt water in any annual 1ayer. Uniform and slow percolation of melt water causes rounding of firn grains. Angular firn grains are found in dry snow or fini or in snow where rapid percolation of melt water has taken place below the level of general percolation. When the deep pit at 1 789 m elevation was studied, ice lenses, layers and glands were recorded in detail but grain shape was only cursorily examined. Therefore, in 1963 the depth of general percolation was recorded accurately by a close study of grain shape in a pit at 1 879 m elevation. The results are shown in Figure 5.

Fig. 6. Mass balance and elevation, north-west region of the Devon Island ice cap, 1961-66.
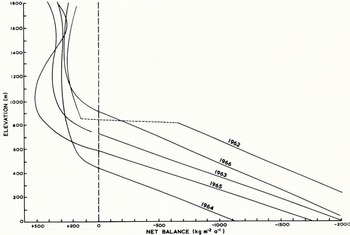
Fig. 7. Mass balance and elevation, south-east region of the Devon Island ice cap, 1962-66.
Results
Relation between mass balance and elevation
The slopes of the negative balance gradients are markedly steeper than the positive balance gradients (Figs. 6 and 7). In the ablation zone the balance gradient is associated chiefly with the temperature lapse rate during the melt season whereas in the accumulation zone the slope of the balance gradient is not associated with melting, except in the zone of superimposed ice, as melt water is refrozen in the firn. Instead, the balance gradient there is associated with accumulation throughout the year which on the Devon Island ice cap bears little relation to elevation (Reference KoernerKoerner, 1966).
Because of the significantly different slopes the regression analyses between mass balance and elevation for each traverse and year have been considered in two parts, the parts approximating to the positive and negative sides of the balance. The mass-balance measurements were fitted to first-, second- and third-order regression equations. For the fifteen positive balance regressions the best fit is obtained in all but three cases with a third-order regression, whereas for the negative balance results there is no significant increase in the coefficient of correlation beyond a linear fit. The 196a negative balance results form an exception and a curvilinear regression line has been fitted to that year's results.
Relation between elevation of the equilibrium line and mean net balance
The negative balance gradient is much steeper than the positive balance gradient on the Devon Island ice cap and, as it is linear, is given by the y coefficient in
where b n(z0) is the net balance at sea-level and z the elevation in meters. The y coefficient in the equations for the south-east region mass-balance-elevation relationship is similar to Reference MeierMeier's (1962)) activity index (E) as the negative balance regression line continues (except for 1962) beyond the equilibrium line elevation without a change of slope (Fig. 7).

Fig. 8. Mean net balance and the elevation of the equilibrium line, north-west region of the Devon Island ice cap, 1961-66.
The theoretical elevation of the equilibrium line (zel) is given by bn(zo)/y in (2). For the six years of mass-balance results obtained so far an association is emerging between the theoretical elevation of the equilibrium line and the mean net balance (b n) in the north-west region (Fig. 8) where
zel is measured in meters above sea-level and b n in kg m-2 a-1. The coefficient of correlation for this relationship is — 0.95 (significant at the less than 1% level). The association indicates that the north-west part of the ice cap would be in a steady state ( b n = 0) with an equilibrium line at 920 m (±80 m) elevation.
Contrast between north-west and south-east
Table III. Comparison of the mean net balance (< b n>) exchange (e) total ablation at sea-level (at (z0 )), accumulation area ratio (AAR) and activity index (E) In the south-east and north-west regions of the Devon Island ice cap for the period 1962-66


Fig. 9. Area-elevation curves, north-west and south-east regions of the Devon Island ice cap.
There is a great, contrast between the glacier regimes in the north-west and south-east regions (Reference KoernerKoerner, 1966). Total accumulation is 2 to 6 times greater in the south-east than in the north-west and total ablation, as represented by the 5-year mean at sea-level, is almost two times greater in the south-east (Table III). A modified exchange figure (e) has been calculated by summing numerically the figures for the net balance in the accumulation and ablation regions. The exchange in the south-east is more than twice that in the north-west. Despite these differences of regime the accumulation area ratios (AAR) are similar and consequently the mean net balance < b n>) in the south-east and north-west regions for the period 1962 66 are not as dissimilar as the regime differences would lead one to expect. Moreover, the two mean net balance figures would be more similar if calving was considered in the calculations (there is insignificant calving in the north-west region but a considerable amount along the 37 km ice front in the south-east region). To achieve similar mean net balances (< b n>) in the two regions the higher accumulation in the south-east must be balanced both by higher ablation there and by the presence of a greater area of ice in the ablation zone. The area/elevation relationships in the south-east and north-west regions are, in fact, quite different (Fig. 9). In the south-east region 41% of the ice cap is below an elevation of 800 m whereas in the north-west the figure is only 16%. The difference between the ice cap area-elevation relationships in each region is on such a massive scale (Figs. 1 and 9) that it must have taken at least several hundreds and possibly, thousands of years to build up. As the difference is caused by a contrast between accumulation conditions (greater total ablation in the south-east reduces the contrast) then the present pattern of accumulation on the ice cap must itself have existed for several hundreds or thousands of years. In this respect the Devon Island ice cap may be typical of many of the Canadian Arctic ice caps, the majority of which are located on the eastern side of the easternmost islands.
Typicality of the period of study
The study of the mass balance of the Devon Island ice cap has continued for six years and one of the most striking results is the variability of summer conditions. During the period of study the altitude of the equilibrium line has ranged between 610 m and 1 510 m in the northwest balance region and the mean net balance (b n) in the same region has varied from -360 kg m-2 a-1 to + 125 kg m-2 a-1. To relate the six years of study to the previous approximately 30 years the firn stratigraphy was examined and compared with that developed each year above the firn line between 1961 and 1966. A comparison between the Devon Island ice cap mass balance and the Resolute Bay weather records was abandoned after it became apparent that there was little correlation between the two.
Variation in net balance and amount of summer melting since 1934
No great confidence is placed on values for individual years but the 5-year running mean of mean net balance at 1 787 m elevation (Fig. 4) shows a trend consisting of a decrease of net balance from about 250 kg m-2 a-1 to 150 kg m-2 a-1 between 1934 and 1950 followed by an increase to 200 kg m-2 a-1. The six years of surface measurements of net balance at the same location show no sign of any present trend of increasing or decreasing net balance there.
Studies of the amount of ice formed in each annual layer in pits and cores at various locations above the climatic firn line (Table II) and of the depth of percolation each year in a pit at 1 879 m elevation (Fig. 5) show no evidence of any significant change in the amount of summer melting in the three or four decades ending with the summer of 1962 when all but one of the pits and cores were studied.
To relate the mean net balance b n each year in the north-west region for the period 1961-66 to the mean net balance (< b n>) for the previous 3 to 4 decades the elevations of the firn and equilibrium lines have been compared to the elevation of both the climatic firn line and the climatic equilibrium line. The elevation of a climatic (or long-period) equilibrium line was determined by a study of crystal size in the zone of superimposed ice (Reference KoernerKoerner, 1970). The results are shown in Table IV where rough comparisons between the percolation in each of the annual layers deposited between 1961 and 1966 and the percolation in each layer in the pit at 1 787 m elevation are included.
Table IV. Elevation or the climatic firn line and climatic equilibrium lines and the firn and equilibrium lines in the north-west region of the Devon Island ice cap, 1961-66

It is assumed in the following discussion that the lower the elevation of the firn and equilibrium lines the more positive the mass balance. This assumption seems justified considering the high level of association that exists between the elevation of the equilibrium line and the mass balance each year (Fig. 8). From the results in Table IV and Figure 5 we may conclude that, compared to the mean net balance (< b n>) and melt each summer from 1934 to 1960: 1960-61 was very close to the mean, the balance year 1961-62 had a much warmer summer and much more negative mean net balance, and 1962-63, 1963 64, and 1964-65 had colder summers and more positive mean net balances. Although there was more than average melt in the 1965-66 balance year, the mean net balance was more positive than the 26 year mean due to the effect of thick layers of firn left from the previous three balance years below the climatic firn line. This firn acted as a reservoir to hold a lot of melt water that would otherwise have run off over a bare ice surface.
Although only one year between 1961 and 1966 had a more negative mean net balance than the 1934-60 mean the mean net balance (< b n>) for the 6 year period is still negative ( —76 kg m-2 a-1 ± 54 kg m-2 a-1) so that at least the north-west region and probably the whole ice cap has had an overall negative mean net balance since at least 1934. It would appear, though, that if the cooling trend continues and summers like those of 1963, 1964 and 1965 recur more frequently, the Devon Island ice cap will pass from a state of negative net balance to one of positive net balance.
Acknowledgements
This study has been sponsored throughout by the Arctic Institute of North America, who also administered grants from the Canadian Defence Research Board for data reduction in 1964 and 1965. The 1965 field season was also supported by funds from the Royal Geographical Society and the U.S. Army Natick Laboratories, Natick, Massachusetts. The 1967 programme was supported by funds from the Institute of Polar Studies, Ohio State University, and the Arctic Institute of North America. The Polar Continental Shelf Project has given logistic support throughout the study. The author would like to thank S. Apollonio, leader of the Devon Island Expedition 1961 to 1963, for organizing the logistics during that period and Dr F. Müller for discussions and the loan of equipment. The author is grateful to S. Ekman for the loan of his field books for the period June-July 1961. Thanks are also due to Dr C. Bull. Dr W. S. B, Paterson, I. Whillans and I. McSeveny who critically reviewed the manuscript.


