INTRODUCTION
Cowpea (Vigna unguiculata L. Walp) is an important grain legume cultivated in many parts of the world (Ehlers & Hall Reference Ehlers and Hall1997; Kimiti & Odee Reference Kimiti and Odee2010; De Freitas et al. Reference De Freitas, Silva and Sampaio2012), with the key production area being West Africa (Hamdy Reference Hamdy1989). It is an important crop in low-input and traditional agricultural systems because of its ability to fix nitrogen (N) and reduce its reliance on expensive commercially produced fertilizers (Odion et al. Reference Odion, Asiribo, Ogunlela, Singh and Tarawali2007). Cowpea is often intercropped with cereals such as millet and sorghum in the Guinea savannah region (Mohammed et al. Reference Mohammed, Olufajo, Singh, Miko and Mohammed2008) or planted in rotation with cereals and other crops, and supplements part of the cereals’ N requirement through N fixation (Carsky et al. Reference Carsky, Vanlauwe, Lyasse, Fatokun, Tarawali, Singh, Kormawa and Tamò2002). Yield increases of >50% have been observed in maize and millet when in rotation with cowpea compared with rotations with other cereals (Dakora et al. Reference Dakora, Aboyinga, Mahama and Apaseku1987; Reddy et al. Reference Reddy, Visser, Klaij and Renard1994).
Phosphorus (P) is essential for growth, pod formation and N fixation in legumes. According to Adu-Gyamfi et al. (Reference Adu-Gyamfi, Fujita and Ogata1989), legumes generally have a high P requirement for adequate growth, nodulation and N fixation. However, the available P content of soils in West Africa (averaging 8 mg/kg) is seldom adequate for optimal plant growth (Manu et al. Reference Manu, Bationo and Geiger1991; Bationo et al. Reference Bationo, Ntare, Tarawali, Tabo, Fatokun, Tarawali, Singh, Kormawa and Tamò2002). Consequently, production of cowpea in West Africa and many parts of sub-Saharan Africa is hindered by low soil-available P, which is also a characteristic of about 5·7 billion ha of land worldwide (Bationo et al. Reference Bationo, Mughogho, Mokwunye, Mokwunye and Vlek1986; Hinsinger Reference Hinsinger2001). Furthermore, the soils of many sub-Saharan regions of Africa are characterized by low-activity clays with high P-fixing capacities, which render P less available to plants. Smalberger et al. (Reference Smalberger, Singh, Chien, Henao and Wilkens2006) observed that soil P deficiency in sub-Saharan Africa was so severe that other technologies such as optimum seeding rate, improved germplasm and inoculation would not work without some form of P addition such as fertilizers. It has therefore been suggested that crops with high P use efficiency (PUE) should be developed for use in P-deficient soils, as this provides benefits in both low- and high-input systems (Rose et al. Reference Rose, Pariasca-Tanaka, Rose, Fukuta and Wissuwa2010). Cowpea yield on farmers’ fields is often low, ranging between 25 and 300 kg/ha (Ajeigbe et al. Reference Ajeigbe, Singh, Musa, Adeosun, Adamu and Chikoye2010); however, high yields of >1000 kg/ha are possible with application of P fertilizers (Jemo et al. Reference Jemo, Abaidoo, Nolte and Horst2006).
One of the major benefits of cowpea production in many parts of West Africa is its capacity for biological N fixation (BNF). Cowpea can fix between 20 and 100 kg N/ha with an estimated N fertilizer replacement value ranging from 10 to 80 kg N/ha (Horst & Hardter Reference Horst and Hardter1994; Carsky et al. Reference Carsky, Oyewole and Tian1999, Reference Carsky, Vanlauwe, Lyasse, Fatokun, Tarawali, Singh, Kormawa and Tamò2002; Sanginga et al. Reference Sanginga, Lyasse and Singh2000). Cowpea has therefore become important in the integrated farming system, allowing crop rotation with legumes to supply N through BNF. However, BNF in legumes can be limited or enhanced by P availability and utilization (Vance et al. Reference Vance, Udhe-Stone and Allan2003; Waluyo et al. Reference Waluyo, Lie and ‘t Mannetje2004). For example, P deficiency has been shown to reduce the number and biomass of nodules as well as nitrogenase activity in legumes (Valdez et al. Reference Valdez, Rodier, Payre and Drevon1996; Qiao et al. Reference Qiao, Tang, Han and Miao2007), which is essential for N fixation. Phosphorus concentration in nodules can be three times higher compared with that in other parts of a plant (Tsvetkova & Georgiev Reference Tsvetkova and Georgiev2003). The ability of cowpea to use P efficiently in low-P soil may enhance nitrogenase activity to increase N fixation in soil and contribute to sustainable cowpea-based cropping systems in the savannas of West Africa.
Many studies have shown that genetic improvement for P-efficiency in crops is more economical and practical than reliance on chemical fertilizers alone (Cakmak Reference Cakmak2002; Vance et al. Reference Vance, Udhe-Stone and Allan2003; Yan et al. Reference Yan, Liao, Beebe, Blair and Lynch2004). Rose & Wissuwa (Reference Rose and Wissuwa2012) suggested that breeding of P-efficient crops could give good yields with available P levels <4 mg/kg soil (Bationo et al. Reference Bationo, Waswa, Okeyo, Maina, Kihara and Mokwunye2011) may reduce the impact of grain crops on the P cycle. Several breeding research studies have been conducted on legumes for PUE (Adu-Gyamfi et al. Reference Adu-Gyamfi, Fujita and Ogata1989; Sanginga et al. Reference Sanginga, Lyasse and Singh2000; Vesterager et al. Reference Vesterager, Høgh-Jensen and Nielsen2006; Ao et al. Reference Ao, Guo, Zhu, Zhang, Wang, Ma, Han, Zhao and Xie2014), but most of them have focused on enhancing P uptake efficiency (Wissuwa et al. Reference Wissuwa, Mazzola and Picard2009). Sanginga et al. (Reference Sanginga, Lyasse and Singh2000) and Abayomi et al. (Reference Abayomi, Ajibade, Sammuel and Sa'adudeen2008) gave a PUE range of 0·19–0·27 (measured as g shoot dry weight per mg P in shoot) in cowpea under low-P input. While the literature abounds in reported genotypic differences in PUE across a range of crops, there has been little progress in breeding crop cultivars with high PUE (Rose & Wissuwa Reference Rose and Wissuwa2012). The present study measured PUE by determining the P utilization index (PUI), which was expressed as the reciprocal of P concentration (Hammond et al. Reference Hammond, Broadley, White, King, Bowen, Hayden, Meacham, Mead, Overs, Spracklen and Greenwood2009) in cowpea tissue. The PUI is the factor that determines internal utilization of P in the shoot and grain.
The International Institute of Tropical Agriculture (IITA) has developed many accessions of early-maturing cowpea in its research efforts to meet the demand of farmers. There is virtually no definitive information with respect to the PUE and BNF potential of these accessions and this undermines their potential contribution to sustainable legume–cereal cropping systems in West Africa. Principal component analysis (PCA) and cluster analysis have been reliably used to screen crops for PUE when assessing multiple parameters/traits (Li et al. Reference Li, Wang, Tong, Gao, Zhang and Chen2005; Pan et al. Reference Pan, Li, Zhang, Li and Liu2008). Both analyses allow for integrative effects of multiple parameters on P efficiency but unlike PCA, cluster analysis does not account for relative contributions of different parameters to P efficiency (Pan et al. Reference Pan, Li, Zhang, Li and Liu2008). The objective of the present study therefore was to screen 175 genotypes of early-maturing cowpea varieties for PUE and BNF potential for crop improvement for low-input and traditional cropping systems.
MATERIALS AND METHODS
Field preparation, soil nutrients and bradyrhizobial determination
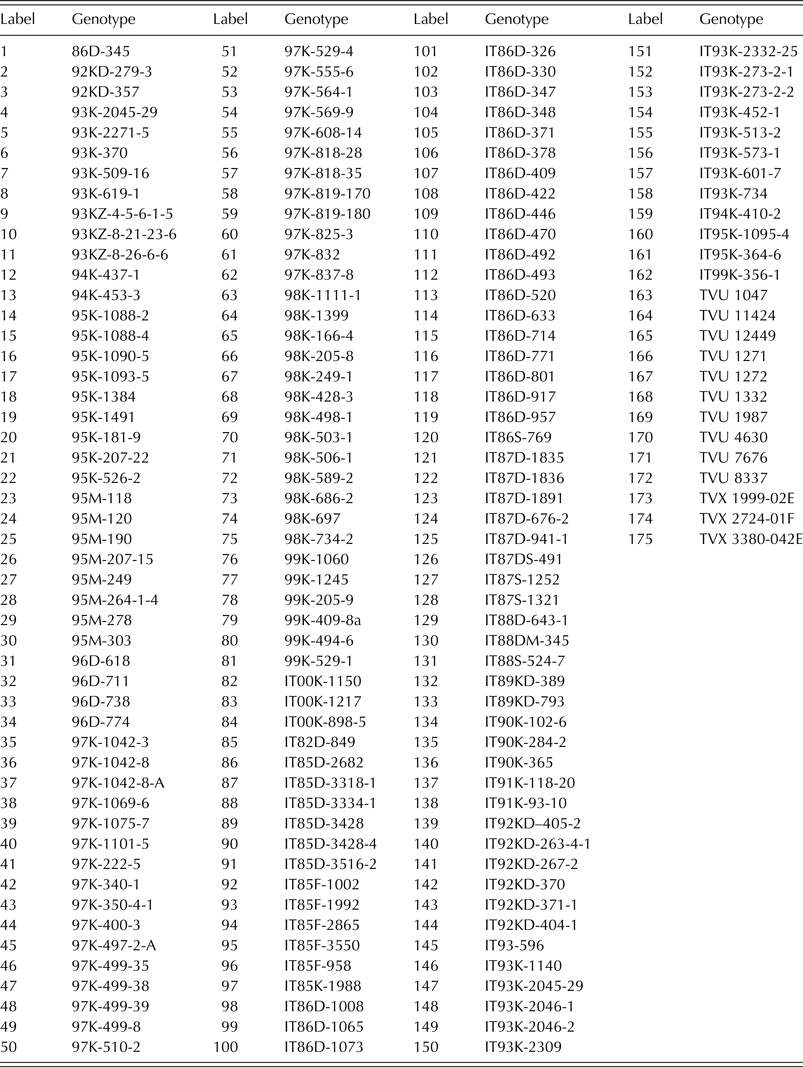
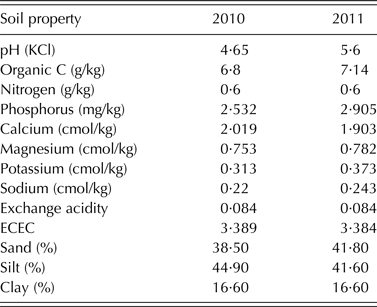
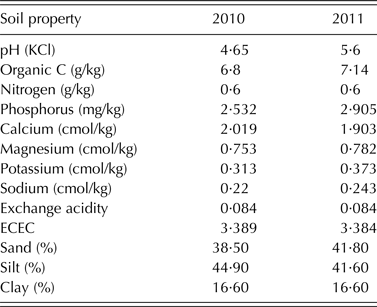
Field experiments were conducted at Shika (11°13′N, 7°12′E) in 2010 and 2011. Shika is located in the Northern Guinea savanna of Nigeria and has a unimodal rainfall pattern with c. 1100 mm rainfall per annum. Mean minimum and maximum temperatures vary between 17–23 and 27–35 °C, respectively, depending on the season. The soil type is a Ferric Lixisol (FAO/ISRIC/ISSS 1998). The field was previously cultivated with maize and sorghum in rotation with cowpea for 4 years. The two seasons before the trial were planted with maize and sorghum respectively with no P fertilizer application. Fields were cleared and ploughed, and ridges spaced 0·75 m apart were constructed with a tractor-mounted ridger. The plot size was 2·25 m2 (three rows per plot, a 1 m alley between plots and 1·5 m between replicate blocks). Phosphorus was broadcast onto the plots at a rate of 20 kg P/ha triple superphosphate (TSP). Planting was done 2 days after the application of TSP in both years. The experimental design was a Randomized Complete Block Design with three replicates. Early-maturing cowpea genotypes (Table 1) used for the trial were obtained from the germplasm collection of IITA, Nigeria. Soil physico-chemical characteristics (Table 2) were determined using standard procedures (Okalebo et al. Reference Okalebo, Gathua and Woomer1993).
Table 1. The 175 early maturing cowpea genotypes used for evaluation in 2010 and 2011

Table 2. Soil chemical and physical properties of the experimental site at Shika, Nigeria in 2010 and 2011
Soil sampled prior to planting was analysed for indigenous rhizobial population densities using the plant-infection technique of Vincent (Reference Vincent1970) and growth pouch-plant cultures described by Weaver & Frederick (Reference Weaver and Frederick1972) and Somasegaran & Hoben (Reference Somasegaran and Hoben1994). Plants growing in the pouches were provided with adequate volumes of N-free nutrient solution (Singleton Reference Singleton1983) in which the micronutrient components were replaced with a micronutrient formulation proposed by Broughton & Dilworth (Reference Broughton, Dilworth, Somasegaran and Hoben1970). Pouch-plant cultures were scored for the presence of nodules after 28 days from inoculation. The mean most probable number (MPN) of bradyrhizobia was obtained using the MPN enumeration system (Woomer et al. Reference Woomer, Bennett and Yost1990).
Field evaluation, planting and crop maintenance
Cowpea was sown at a depth of 3–5 cm along the ridges using three seeds per hole and planting, the seeds were treated with Apron plus at a rate of 10 g per 5 kg of seeds. The plots were weeded manually using hoes at 3, 6 and 10 Weeks After Planting (WAP). Sampling was assessed at 50% flowering for BNF, at pod-filling for PUE and at maturity for grain yield. Plant samples were processed for number and dry weight of nodules, and N2-fixation was measured using the hot water extraction method (Herridge Reference Herridge1982; Herridge & Peoples Reference Herridge and Peoples1990; Herridge et al. Reference Herridge, Peoples and Boddey2008). The stem and petiole of cowpea shoots were ground to pass through a 1·0 mm sieve, after which the sample was extracted with 25 ml boiling water for 2 min. The extract was filtered, made up to 50 ml volume with distilled water, and stored at –15 °C until analysis for ureides and % N derived from the atmosphere (% Ndfa).
Harvested plant samples were chopped into 10- to 20-mm pieces and sub-sampled, and c. 200 g fresh weight was oven-dried at 70 °C for 48 h before grinding to pass through a 0·5 mm sieve for measurement of N and P contents. At the last harvest, plant samples were separated into reproductive (grains) and vegetative parts (shoots) after oven drying. The grains were threshed from the pods and further dried to 70–80 g moisture content/kg. Plant shoots, nodules and straw were dried in the oven at 70 °C to a constant weight before weights were recorded. Total N in the grain, shoot and straw (biomass) fractions was determined by the Kjeldahl procedure (Bremner & Mulvaney Reference Bremner, Mulvaney, Page, Miller and Keeny1982). Phosphorus content in tissues was determined using the procedures described by Okalebo et al. (Reference Okalebo, Gathua and Woomer1993). Phosphorus utilization index was expressed as the inverse of P concentration in the plant.
Statistical analysis
Combined analyses of variance (ANOVA) were conducted for 11 variables measured in 2010 and 2011 using GENSTAT Discovery edition package (GENSTAT 2011). Number of nodules and Ndfa (%) were transformed using logarithm to base 10 and square root transformation, respectively, before the data were subjected to ANOVA for presentation in Supplementary Table S1 (available online from: http://journals.cambridge.org/AGS). Treatment means were separated using Standard Errors of Differences of Means (s.e.d.) at significance level of P < 0·05. Principal component analysis based on correlation matrix was conducted on the mean values of the ten variables for each genotype using Principal Components of Multivariate Analysis of GENSTAT. Ten variables were used because PUI, which was a derived variate (reciprocal of P content), was not included in PCA and cluster analysis to avoid multicollinearity which may confound the analyses. Variables that accounted for most of the variance in the whole set of the data were identified and grouped into axes using biplots of variates and principal components. Hierarchical cluster analysis was also performed using a complete link method to classify the cowpea genotypes into different clusters based on the plotted dendrogram. Correlation among variables was determined using the PROC CORR of the Statistical Analytical System (SAS 2003).
RESULTS
The soil used for the study was acidic and low in organic carbon in both years. The total N and available P in the soil were low for both 2010 and 2011 cropping seasons (Table 2). The combined ANOVA showed that genotype was significant (P < 0·05) for all the 11 variables tested (Table 3). Interaction between year and genotype was also significant (P < 0·05) for all the traits except total plant N and P contents, and PUI (Table 3). The grain yield, crop biomass, total N fixed, PUI and % Ndfa among the genotypes were in the ranges of 173–1468 kg/ha, 866–2856 kg/ha, 11·86–50 kg/ha, 2·10–4·67 and 31·3–61·86%, respectively (Table 3). The recorded ranges of the other variables were as follows: number of nodules (0·25–3·0 × 106/ha), nodule dry weight (0·84–27·85 kg/ha), biomass N content (2·24–3·78% dry matter), biomass P content (0·22–0·49% dry matter), N uptake (18·86–87·74 kg/ha) and P uptake (2·24–8·36 kg/ha).
Table 3. Summary of combined analysis of variance for the 11 variables of 175 early maturing genotypes evaluated in 2010 and 2011

N, nitrogen, P, phosphorus; PUI, phosphorus utilization index; d.f., degree of freedom; s.e.d., standard error of difference of means; ns, not significant.
* s.e.d. values significant at P < 0·05; ns, not significant.
Positive correlation (Table 4) was observed between: P uptake and total N fixed (P < 0·05, r = 0·92); P and N uptake (P < 0·05, r = 0·90); N uptake and total N fixed (P < 0·0001, r = 0·99); total N uptake and total crop biomass (P < 0·0001, r = 0·95); and crop biomass and total N fixed (r = 0·93). Crop N and P contents had negative correlations with other variables. There were negative correlations between PUI and crop P content (P < 0·05, r = –0·97) and PUI and crop N content (P < 0·05, r = –0·63). No significant correlation was observed between PUI and proportion of % Ndfa.
Table 4. Correlation coefficients for the 11 variables measured

N, nitrogen; P, phosphorus; PUI, phosphorus utilization index.
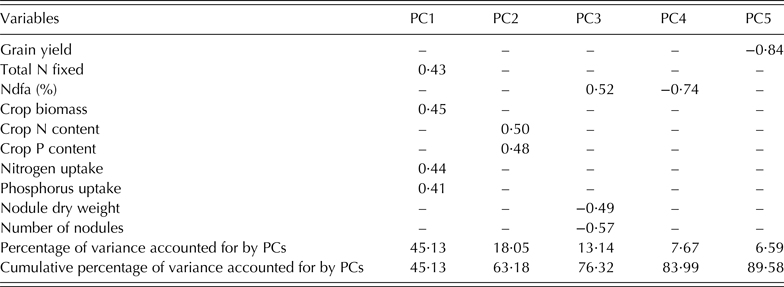
The results of the PCA (Table 5) showed that PC 1, 2, 3, 4 and 5 accounted for 0·90 of the variation with PC1 (0·45), PC2 (0·18) and PC3 (0·13) jointly contributing 0·76 of the variation. Latent vectors ⩾0·4 were identified as the logical cut-off points where each selected trait made an important contribution to the PC axis. Based on this, all the ten variables were loaded on the five PC axes with six of them on the first two axes. On PC1 were crop biomass, N and P uptake and total N fixed, while crop P and N contents were loaded on PC2. Number of nodules, % Ndfa and nodule dry weight were loaded on PC3, while % Ndfa and grain yield were loaded on PC4 and PC5, respectively.
Table 5. Latent vectors of the first five principal components (PC1, PC2, PC3 PC4 and PC5) axes for 175 early maturing cowpea genotypes evaluated for PUE and BNF

PUE, phosphorus use efficiency; BNF, biological nitrogen fixation; N, nitrogen; P, phosphorus.
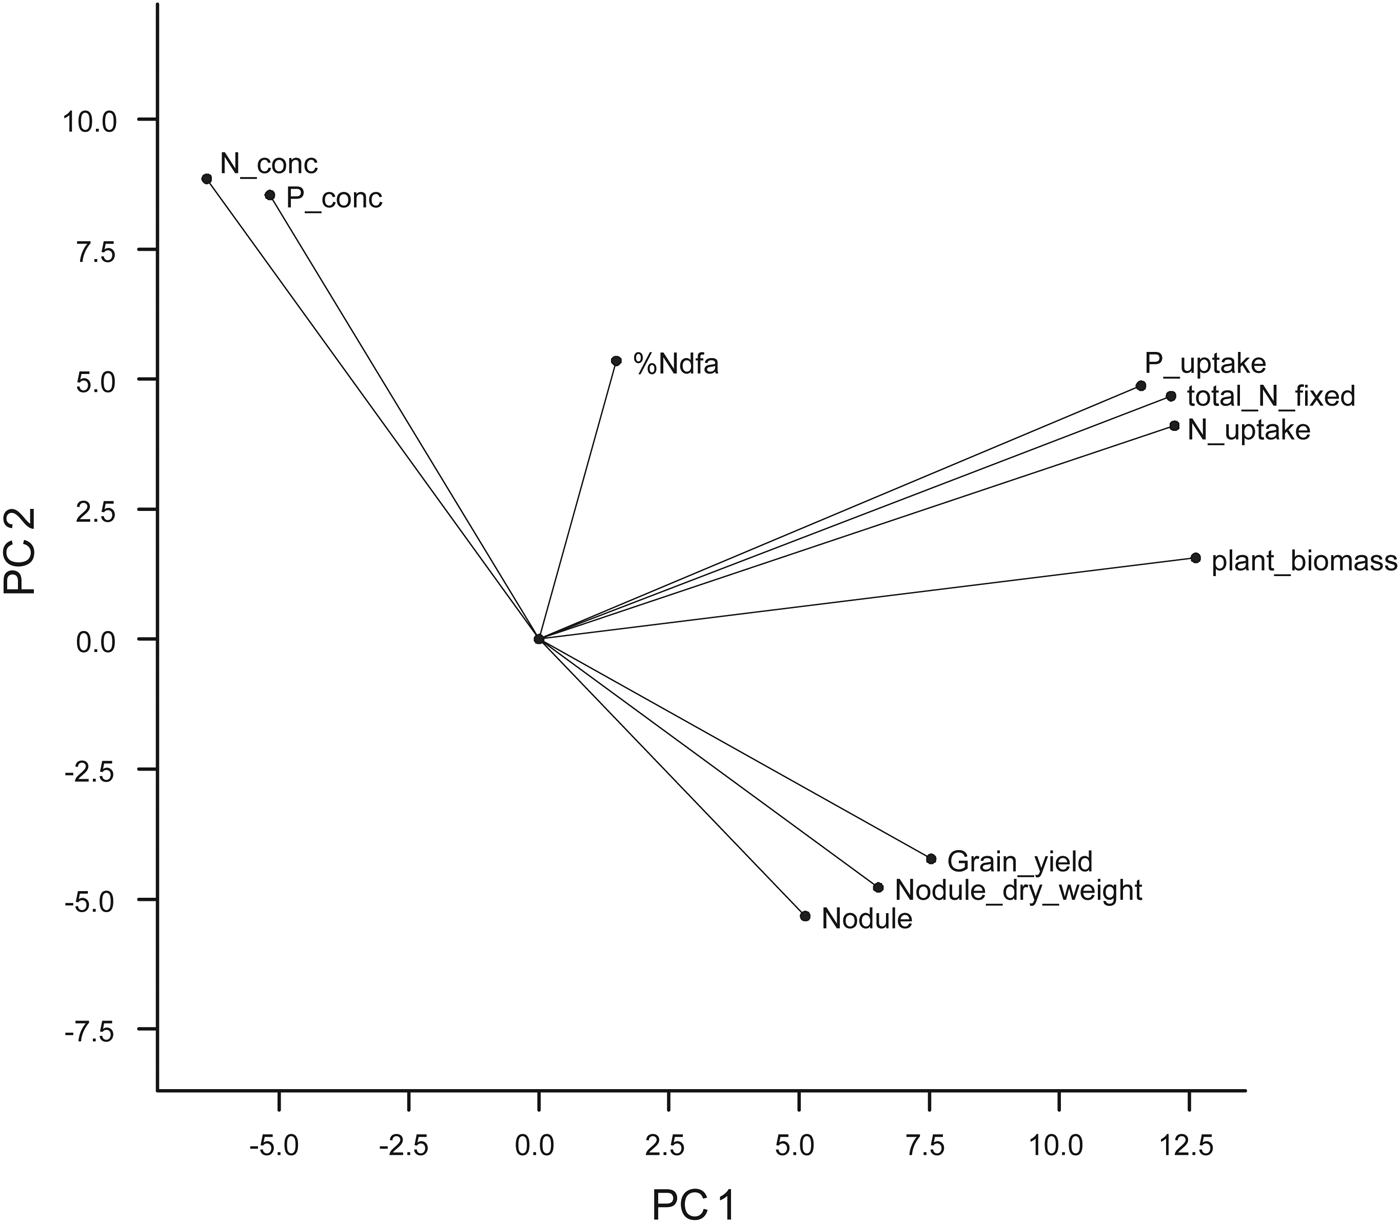
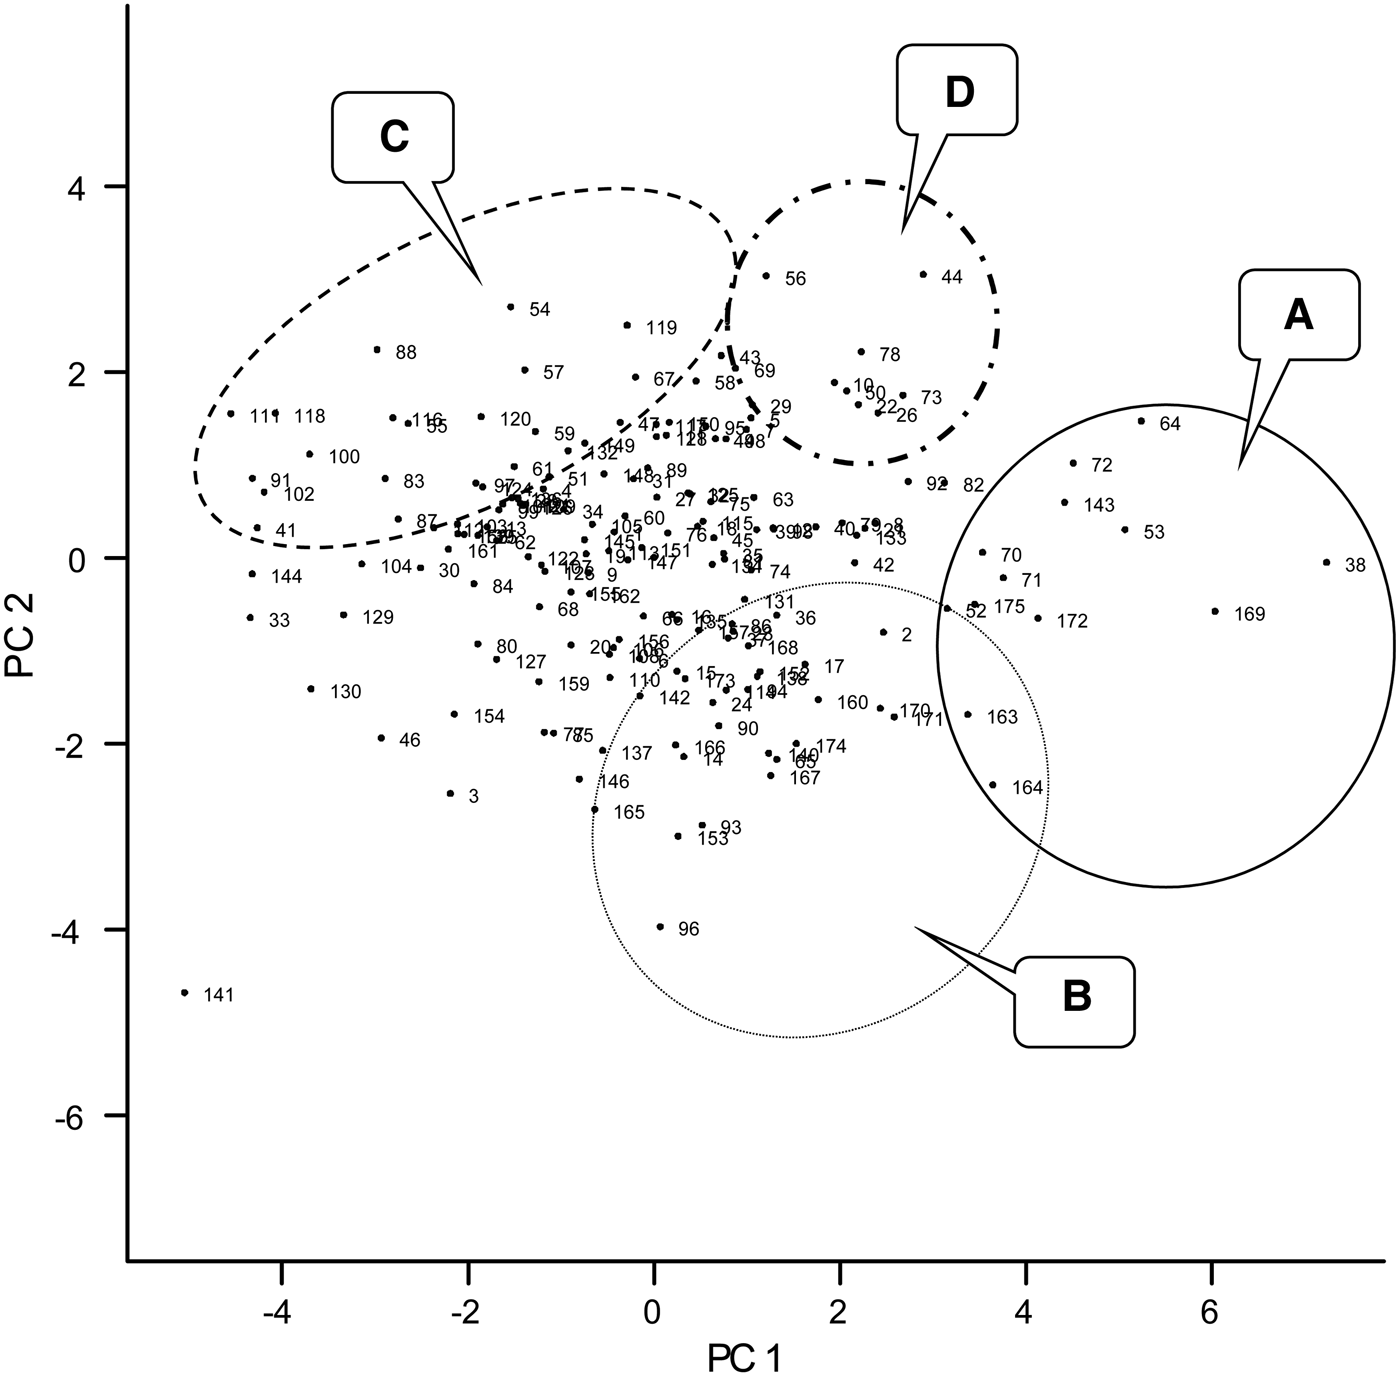
The variate biplot of the ten variables measured for cowpea genotypes revealed the relationships among the variables (Fig. 1). The projections for number of nodules, nodule dry weight and grain yield from the centre of origin of the biplot were to the positive side of PC1 (x-axis) and negative side of PC2 (y-axis), while that of crop biomass, N and P uptake, total N fixed and Ndfa (%) were to the positive sides of PC1 and PC2. Crop N and P contents were projected to the negative side of PC1 and positive side of PC2. None of the variables were projected to the negative sides of PC1 and PC2. On the PC biplot (Fig. 2), some genotypes were distinctively grouped together based on their performance for the measured variables and the relationship among the variables. Group A consisted of genotypes such as 97K-1069-6 (38), 98K-1399 (64), 98K-564-1 (53), TVu 1987 (169), IT92KD-371-1 and 98K-589-2 (72), which had high values for crop biomass, N and P uptake and total N fixed as revealed on the variate biplot (Fig. 1). Group B consisted of genotypes that were most likely to be differentiated from others based on the nodulation and grain yield as loaded on the variate biplot (Fig. 1). Among the genotypes were 95M-120 (24), 92KD-370 (142), IT93K-1140 (146), IT95K-1095-4 (160), IT93K-273-2-2 (153), TVu 7676 (171) and TVx 1999-02E (173). Group C consisted of genotypes that were high in biomass N and P contents and included genotypes such as 97K-569-9 (54), IT86D-771 (116), IT86D-917 (118) and IT86D-957 (120). Group D consisted of genotypes that had high % Ndfa such as 97K-818-28 (56), 97K-350-4-1 (43) and 98K-498-1 (69). Other genotypes were not clearly differentiated based on the ten variables that were used in the study.

Fig. 1. The variate biplot (from principal component analysis) of the 11 variables that were measured for the 175 early maturing cowpea genotypes in 2010 and 2011, showing the projection of each variable on the biplot (P_conc = crop P content; N_conc = crop N content; plant biomass = crop biomass; nodule = number of nodules).

Fig. 2. Graph of PC1 and PC2 scores of 175 early maturing cowpea genotypes evaluated for phosphorus use efficiency (PUE) and biological nitrogen fixation (BNF) in 2010 and 2011. A–D are different groups of genotypes that can be identified based on their performances. Labels correspond to the genotypes as listed in Table 1.
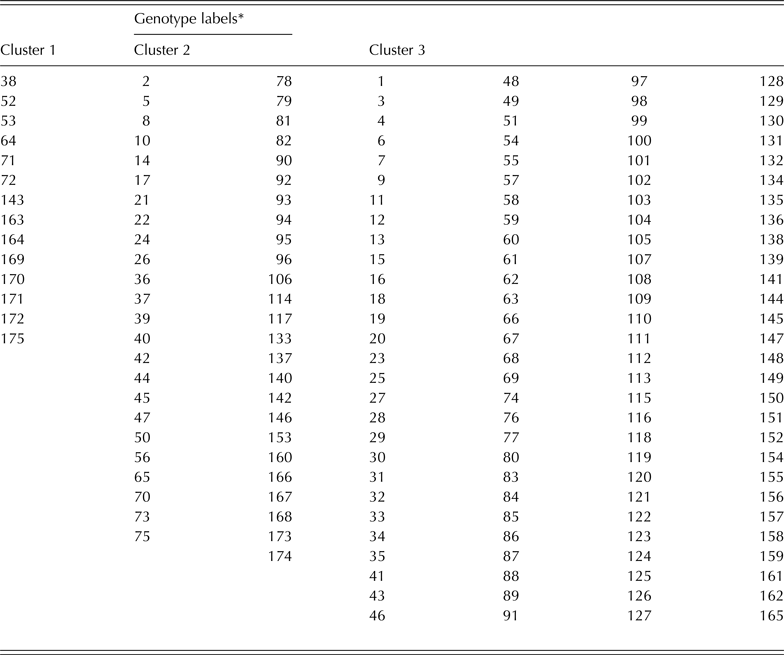
The complete linkage cluster analysis revealed a total of three clusters based on the normalized distance of 0·75 on the dendrogram (Fig. 3). There were a total of 14, 49 and 112 genotypes for clusters 1, 2 and 3, respectively (Fig. 3 and Table 6). The clusters showed a remarkable closeness to the PCA as most of the genotypes that were grouped as A and B the PC biplot (Fig. 2) were listed in clusters 1 and 2, respectively (Fig. 3). The genotypes in cluster 1 include 97K-1069-6 (38), 98K-1399 (64), 98K-564-1 (53), TVu 1987 (169), IT92KD-371-1 and 98K-589-2 (72), while cluster 2 includes genotypes such as 92KD-279-3 (2), 92KD-370 (142), IT93K-1140 (146), IT95K-1095-4 (160), IT93K-273-2-2 (153) and TVx 1999-02E (173). Cluster 3 was further divided into two main sub-clusters with one sub-cluster comprising just one genotype, IT92KD-267-2.
Table 6. Genotype labels in each of the three clusters shown on the dendrogram

* Name of the genotypes for each label is provided in Table 1.
DISCUSSION
The primary objective of the present study was to screen for variation in PUE within 175 early-maturing cowpea genotypes and identify candidate genotypes for introgression into existing farmer-preferred genotypes. Plant efficiency for nutrient uptake and utilization may improve yield potentials in situations of soil nutrient stress, reducing plant nutrient demands for a given level of crop yield. The purpose of screening such a large set of germplasm and the use of PCA and cluster analysis in identifying P-efficient genotypes was to obtain results, as previously reported for other crops (Ozturk et al. Reference Ozturk, Eker, Torun and Cakmak2005; Raghothama & Karthikeyan Reference Raghothama and Karthikeyan2005; Pan et al. Reference Pan, Li, Zhang, Li and Liu2008), that take into consideration the integrative effects and relative contributions of different parameters to PUE in early maturing cowpea.
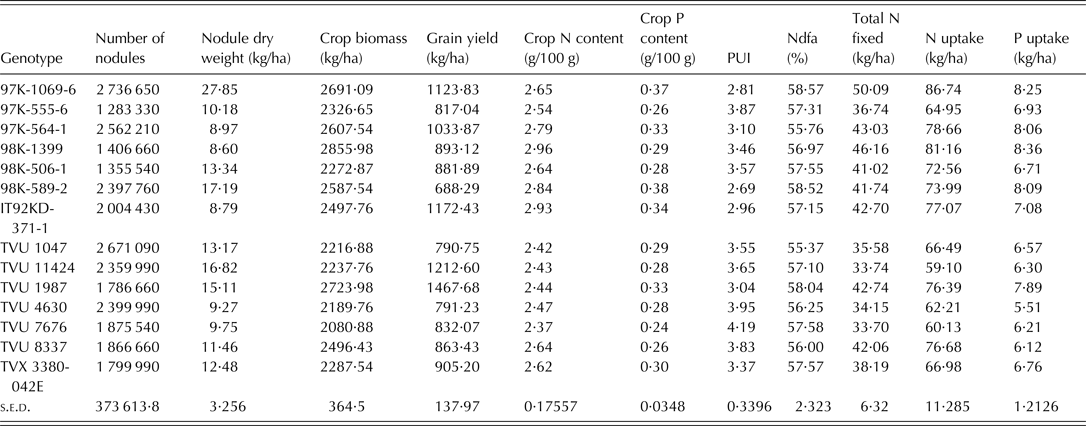
Dry matter production is directly related to N and P supply. The positive relationship among crop biomass, N and P uptake and total N fixed was expected since N and P uptake are functions of dry matter accumulation and total N fixed was derived from N uptake and %Ndfa. Significant relationships among N and P uptake, total biomass production and grain yield have also been observed for crops such as soybean and pigeon pea in previous studies (Vesterager et al. Reference Vesterager, Høgh-Jensen and Nielsen2006; Pan et al. Reference Pan, Li, Zhang, Li and Liu2008; Abbasi et al. Reference Abbasi, Manzoor and Tahir2010). Having correlated positively with PUI (r = 31), biomass dry weight would be an important variable when screening cowpea varieties for dual purpose of PUE and N fixation effectiveness. Pan et al. (Reference Pan, Li, Zhang, Li and Liu2008) reported that shoot dry weight is an effective and simple indicator of screening for P-efficient soybean genotypes. The PUI in the present study was the reciprocal of P content in the cowpea tissue and therefore the negative correlation between two variables and also N content which had a strong positive relationship with P content. The negative correlation was consistent with the work of Nwoke et al. (Reference Nwoke, Okogun, Sanginga, Diels, Abaidoo and Osonubi2009), who observed negative correlations between internal PUE and N and P contents when soil was treated with single superphosphate fertilizer. The PUI was used as a measure of P efficiency because it provides an understanding of the internal mechanisms associated with conservable use of absorbed P at the cellular level (Bates & Lynch Reference Bates and Lynch2001; Vance et al. Reference Vance, Udhe-Stone and Allan2003). A complete picture of inter-relationships between traits or variables can be revealed by PCA and cluster analyses that consider multiple traits. Badu-Apraku et al. (Reference Badu-Apraku, Menkir, Fakorede, Fontem-Lum and Obeng-Antwi2006) reported that PCA considers underlying inter-relationships in the whole set of data, selects the best linear combination of traits that explains the largest proportion of the variance in the data set, and loads them on the first principal component axis. The outputs from the PCA revealed that the variables with the most discriminating power for the grouping of genotypes were biomass dry weight, total N fixed, and N and P uptake, since they accounted for more of the variance (0·45) in the set of data than other traits. Among the traits loaded on PC1, P uptake and biomass dry weight have been identified as important traits for selection of P-efficient genotypes (Manske et al. Reference Manske, Ortiz-Monasterio, Van Ginkel, Gonzalez, Fischer, Rajaram and Vlek2001; Osborne & Rengel Reference Osborne and Rengel2002; Pan et al. Reference Pan, Li, Zhang, Li and Liu2008). Ding et al. (Reference Ding, Chen, Cheng, Li and Zhang2006) concluded that P uptake was one of the most important indices for evaluating the ability of soybean cultivars to absorb P under deficient conditions. Since the focus of the present study was to screen for genotypes that can use P efficiently in low-P soil and are able to biologically fix adequate N, the traits listed on PC 1 are the best for selection purposes in the present study. These traits were characteristically high in c. 14 genotypes as revealed by group A and cluster 1 of PCA and cluster analyses, respectively. The 14 genotypes represent c. 8% of the total number of genotypes used for the study and can be considered to be a relatively substantial gene pool for further breeding. In addition to breeding, the information on genotype characterization is of particular use for farmers utilizing low-input/traditional cropping systems. The 14 genotypes identified in this group were; IT92KD-371-1, 97K-1069-6, 97K-555-6, 97K-564-1, 98K-506-1, 98K-589-2, 98K-1399, TVu(s) 1047, 1987, 4630, 7676, 8337, 11424 and TVx 3380-042E. Interestingly, genotype TVu 1987, TVu 11424, 97K-1069-6 and IT92KD-371-1 produced the highest grain yields (Table 7), which could also qualify them as P-efficient genotypes for the dual purpose of biomass/grain production and N fixation.
Table 7. Means of 11 variables measured for the genotypes that were grouped in cluster 1

N, nitrogen; P, phosphorus; PUI, phosphorus utilization index; s.e.d. represents standard error of difference for genotype (obtained from the analysis of variance for the 175 genotypes).
Defining P efficiency in terms of biomass production has been consistently used in most PUE studies (Pan et al. Reference Pan, Li, Zhang, Li and Liu2008; Rose & Wissuwa Reference Rose and Wissuwa2012). However, in legumes, there is a tendency to relate P efficiency to BNF because P is one of the components of adenosine triphosphate (ATP), which provides energy and activates nitrogenase in the atmospheric N fixation process. It would therefore be expected that genotypes with high PUI would be able to fix more N than those with low PUI. This was not observed in all cases in the present study. In fact, there was weak negative correlation between PUI and % Ndfa. One reason why the positive influence of a PUI on %Ndfa could be affected is the size of the rhizobia population and its effectiveness. Al-Niemi et al. (Reference Al-Niemi, Kahn and McDermott1997) reported that bacteroids can be P-limited even when plants have received otherwise adequate P. The presence of ineffective rhizobia in the nodules can also result in lower or even negligible N fixation (Cassman et al. Reference Cassman, Munns and Beck1981; Kiers et al. Reference Kiers, Hutton and Denison2007) even when PUI is high in the plant. The current results revealed that even though PUI had a positive influence on crop biomass, N fixation was indirectly affected, as reflected in the total N fixed (kg/ha) in the soil. This observation was in agreement with that of Ankomah et al. (Reference Ankomah, Zapata, Hardarson and Danso1996), who concluded that the P effect on N2 fixation was mainly in the total amount of N fixed rather than on the percentage derived from the atmosphere. Therefore, incorporation of residues of dual purpose cowpea genotypes with potential for high PUI can improve the residual N content of soils.
CONCLUSION
Genotypic variation in PUE among the 175 early maturing cowpea genotypes evaluated in low-P soil was influenced by P uptake and biomass dry weight and it was demonstrated that the potential range of high P use efficient genotypes was narrow. However, early-maturing cowpea genotypes provided sources of useful gene pools for PUE and N fixation breeding programmes. A number of genotypes were identified as good candidates for further breeding programmes. It was concluded from the results that crop biomass, total N fixed, N and P uptake are effective indicators for the screening of early maturing cowpea populations for PUE and N fixation efficiency. High N fixation and P-efficient genotypes could be integrated into traditional cropping systems that are normally practiced on N and P deficient soils.
The study was supported by the International Institute of Tropical Agriculture (IITA). The technicians and technologists of the Soil Microbiology Unit IITA are acknowledged for managing the trials.
SUPPLEMENTARY MATERIAL
The supplementary material for this paper can be found at dx.doi.org/10.1017/s0021859611500115X.


