In 2018, nearly 2·5 million infants worldwide died in the first month of life, with preterm birth (<37 completed weeks of gestation) as a leading cause(1,2) . Further, one in every seven infants in the world is born low birth weight which can result in neonatal mortality and affect growth and cognition in the long term(3). Low- and middle-income countries are disproportionately affected by pregnancy-related complications, for example, India alone accounts for about 23 % of total preterm births worldwide, and 7·5 million neonates are born with a low birth weight (<2500 g) in India(2,Reference Sankar, Neogi and Sharma4) .
The US National Academy of Medicine has outlined the need for appropriate gestational weight gain based on pre-pregnancy BMI for optimal birth outcomes(5). Adequate diet quality and intake of adequate energy, protein and micronutrients during pregnancy are crucial for appropriate gestational weight gain and optimal birth outcomes(Reference Jebeile, Mijatovic and Louie6,Reference Kramer and Kakuma7) . A systematic review shows that dietary patterns comprising higher vegetables, fruits, whole grains, nuts and seeds and legumes had a lower risk of preterm birth(Reference Raghavan, Dreibelbis and Kingshipp8). Black et al. also describe the importance of vitamins (including A, C, E, D, folic acid, cobalamin, thiamine, riboflavin, pyridoxine) and minerals (including Fe, Zn and iodine) to prevent poor fetal growth, especially in low- and middle-income countries(Reference Black, Allen and Bhutta9). In addition to birth outcomes and fetal growth, diet quality during pregnancy also influences fetal neurodevelopment and cognitive development in children(Reference Borge, Aase and Brantsæter10). In instances where specific nutrients are deficient, supplementation with micronutrients (Fe, folic acid, other micronutrients) and macronutrients (carbohydrate, protein and fat) has shown to improve maternal–infant health outcomes(Reference Haider and Bhutta11).
Accurate measurement of diet and nutrition among pregnant women is needed to determine adequacy of dietary intake. However, this is challenging because pregnancy encompasses a life stage with changes in numerous physiological processes leading to fluctuations in food intake through different trimesters(Reference Soma-Pillay, Nelson-Piercy and Tolppanen12,Reference Looman, Geelen and Samlal13) . Although 24-h dietary recalls (24-HDR) can be utilised for measuring dietary intake, 24-HDR can be time and resource intensive, especially because multiple recalls are needed for each participant to capture their usual intake. Usual dietary intake at a population level can also be estimated using an FFQ, an effective and inexpensive instrument that is used to assess dietary intakes over the long term, that can be either self-administered or interviewer-administered(Reference Willett14). However, in resource-limited settings such as India, there are limited options for an FFQ in pregnant populations. Most of the previously developed FFQ in India were for individuals living in northern or southern states of India(Reference Pandey, Bhatia and Boddula15–Reference Bharathi, Kurpad and Thomas17), and only a few of these investigations included pregnant women(Reference Pandey, Bhatia and Boddula15–Reference Kuppuswamy, Venugopal and Subramaniam19). Instruments to capture the dietary intake in the central region/western region, home to some of the major cities such as Mumbai with a population of 12·4 million and Pune with 3·1 million, are lacking(20,21) . In addition, as dietary patterns in India vary by region(Reference Green, Milner and Joy22), it is inappropriate to use an FFQ that has been developed for one region to assess intakes from another region.
Daniel et al. developed an FFQ for adults in three regions of India, one of which is the west – the region of our interest(Reference Daniel, Kapur and McAdams16). However, this FFQ has not been evaluated for validity among pregnant populations(Reference Carpenter, Nyamathi and Kapur23). Here, we aim to evaluate the validity of the New Interactive Nutrition Assistant - Diet in India Study of Health (NINA-DISH) FFQ developed by Daniel et al. to determine if this FFQ can be used in place of multiple 24-HDR as a tool to assess dietary intake among pregnant women in western India. We adapted this FFQ for use in our study of pregnant women from Pune(Reference Daniel, Kapur and McAdams16). Correlation coefficient r was considered as the index of validity when comparing the nutrient intake from FFQ and that from multiple 24-HDR(Reference Willett14).
Methods
Design and study population
The validation study was conducted between August 2016 and July 2019 among seventy women as a sub-study of a prospective longitudinal cohort study of HIV-infected and uninfected pregnant women investigating immune responses to latent tuberculosis infection during pregnancy and postpartum. The parent prospective study enrolled pregnant women aged ≥18 years, with gestational age between 13 and 34 weeks seeking antenatal care at BJ Government Medical College (BJMC) at Sassoon General Hospital, a tertiary care hospital serving primarily low-income urban residents of Pune, India. Women with active tuberculosis disease, severe anaemia, history of autoimmune or immunosuppressive disease, use of immunosuppressive drugs and currently taking antibiotics >14 d were excluded from the parent study. Any pregnant women who met the eligibility criteria and consented to study participation were enrolled into the study. Women who were 18–26 weeks of gestation were enrolled from the parent study into the sub-study. Using convenience sampling (i.e. same eligibility criteria as parent study except for gestational age at enrolment), those consenting to study participation were enrolled into the sub-study. The sub-study cohort was stratified by HIV status (thirty-five HIV-uninfected and thirty-five HIV-infected pregnant women). The stratification by HIV status was for a different sub-study objective related to gut microbiome, rather than dietary intake.
Research was conducted according to the Declaration of Helsinki, and the study was approved by the Institutional Review Board or ethics committees at Johns Hopkins University, Columbia University, Cornell University and BJMC.
Collection and computation of nutrient information
To estimate the usual dietary intake, FFQ was used with 3–5 24-HDR considered reference diet.
The NINA-DISH FFQ was used to estimate usual dietary intake and compared with three to five 24-HDR considered reference diet. NINA-DISH uses a meal-based approach to assess usual dietary intake from three different regions of India: New Delhi in the North, Mumbai in the West and Trivandrum in the South(Reference Daniel, Kapur and McAdams16). The FFQ was designed to collect usual dietary intake information including frequency and portion sizes of 236 foods by mealtime (early morning tea, breakfast, mid-morning snack, lunch, afternoon, tea, evening snack, dinner and bed-time snack).
We adapted NINA-DISH for our study by using foods pertaining to the Mumbai region, resembling the dietary patterns of the study population in Pune (also in Maharashtra State). Focus group discussions were conducted with female study counsellors and staff of the same age range as the participants to further refine the FFQ: some foods pertinent to the study population were included and those rarely or never consumed were removed. For example, beef and its related food preparations were removed from the list, since the local government regulations do not permit their sale and consumption. Another example included the addition of ‘Chinese Hakka noodles’, a popular local Indo-Chinese noodle-based preparation.
The FFQ was administered during the third trimester parent study visit (28–34 weeks of gestation) and queried usual dietary intake from the beginning of the second trimester, after the dietary pattern was expected to have stabilised, through early third trimester (i.e. prior 4–5 months). Study staff, who had access to reliable gestational age information from early ultrasound data, helped participants estimate time since initiation of second trimester. The study staff were trained to collect dietary data from study participants using an electronic data collection system built on Salesforce.com Inc. by Persistent Systems Pvt. Ltd. The data were exported into.csv format for further analyses.
Cooking and eating utensils of sizes commonly utilised locally were used to collect information on portion size. For foods such as chapati (flat bread), cardboard cut-outs of different diameters were used to determine portion sizes. Estimates of nutrients for foods in the NINA-DISH, as well as additional foods that were not part of NINA-DISH but were added during the adaptation of the FFQ to our study population, were derived from one of seven databases (UK, FNDDS, Singapore, Malaysia, NUTTAB, USDA, WorldFood)(Reference Daniel, Kapur and McAdams16,24–29) . If information was not available for food items from these databases, recipes were developed based on culinary use and consensus among study personnel, followed by computation of nutrient information using the Indian Food Composition Tables 2017(Reference Longvah, Ananthan, Bhaskarachary and Longvah30). However, we were not able to evaluate the validity of the fibre content as the available information in the FFQ databases was not present in a consistent format. For example, in the UK database, values for many relevant foods were presented as ‘N’ (where a nutrient is present in significant quantities, but there is no reliable information on the amount) or ‘Tr’ (trace values). This was also the case for folate and vitamin B12, two important nutrients for pregnancy and fetal development.
We collected multiple 24-HDR (up to five recalls per woman) at 2-week intervals, with at least 1 d capturing intake from the weekend. The multiple recalls were scheduled to cover the same time period queried by the FFQ (i.e. second and third trimester). Staff were trained to collect 24-HDR in the local languages of Marathi or Hindi using the multiple-pass approach on paper(Reference Gibson and Ferguson31,Reference Raper32) . In brief, the study staff first asked the participants for a list of all foods and beverages consumed the previous day followed by probing for any forgotten foods and the times at which the foods were consumed. Thereafter, for each food listed, the staff probed for more details such as ingredients used to cook the recipes at household level, the amount, method of cooking, amount cooked in bulk and amount consumed by the participant. Lastly, the participants were asked again if they consumed anything else. The process of portion size estimation was similar to that mentioned for FFQ, that is, using the local utensils. A study investigator with training in nutrition and native knowledge of local foods and recipes including cooking techniques translated the 24-HDR from Marathi or Hindi to English and extracted the information onto spreadsheets. The reported portion size was converted into quantity of food consumed in g by multiplying the density of food and volume of the utensil used to indicate portion size. Volume of the local-sized utensils was calculated by weighing water on a weighing scale (assumption 1 g = 1 ml at room temperature) (Etekcity). The densities of foods were obtained from different sources such as FAO/INFOODS Density Database or Aquacalc(33,34) . Manual calculation of densities was conducted only when the density of a food was not available from other sources. In such a situation, especially for some local fruits, vegetables and dishes, the foods were procured from local grocery stores or street-side vendors by a study personnel to compute the densities. Fresh vegetables and fruits were cleaned, cut and weighed in standard utensils of known volume. Nutrient intakes for each recall obtained from the participant were calculated using Indian Food Composition Tables 2017. This database provides information at the raw ingredient level (and not mixed dishes) which was used to compute nutrient information for the recipes consumed by the participant. For comparison with the nutrient intake from FFQ, average of nutrient intake from multiple recalls per participant was considered.
Analysis
Medians (Q1, Q3) were used to describe continuous demographic variables and nutrient intakes. Difference in median intake from FFQ and that from 24-HDR was compared prior to transformation using the Kruskal–Wallis test. As has been done in previous investigations(Reference Talegawkar, Tanaka and Maras35), we excluded data of individuals (n 6) with implausible energy intakes (defined as <2092 or >20 083 kJ/d) based on either FFQ or 24-HDR(36). We also excluded data of participants (n 3) who had less than three 24-HDR. First, recalls with implausible energy intakes were excluded. Thereafter, those participants who had <3 recalls were excluded. The variables were transformed on the natural logarithmic scale, which met the assumptions of normal distribution, for subsequent analyses. Crude Pearson’s correlation coefficient (r) as an index of validity was calculated using the log-transformed estimates obtained from the FFQ and mean of the 24-HDR. To understand the correlation of the same nutrient from FFQ and 24-HDR after accounting for differences in energy intake, we obtained estimates of energy-adjusted correlations of nutrient intake estimates (other than energy). This was performed by including in the model the residuals from regressing the nutrient intake on energy intake(Reference Willett14). We accounted for multiple testing (i.e. seventeen nutrients) by Bonferroni correction, that is those with P values less than 0·003 were considered significant. To correct for random measurement error, variance was partitioned as intra- and inter-person variance by ANOVA that was calculated from multiple 24-HDR. Thereafter, the relationship between true correlation and observed crude correlation coefficient, that is, de-attenuated correlation, was calculated using the following formula(Reference Willett14):
 $${r_t} = {r_0}\sqrt {(1 + {\rm intra}_{\rm{x}}/{\rm inter}_{\rm{x}}/{n_{\rm{x}}}) $$
where r t is the de-attenuated correlation coefficient; r 0 is the crude correlation coefficient; intrax is the within-person variance; inter x is the between-person variance; n x is the average of number of recalls per person (weighted average was 4·69).
We explored the percentage agreement in nutrient intake between the two methods by calculating those falling in the extreme tertiles. Bland–Altman plots were also used to visualise the bias between the two methods(Reference Bland and Altman37). In the Bland–Altman plots, the average of the nutrient intake measured using FFQ and 24-HDR (x axis) was plotted against the mean difference in nutrient intake measured using FFQ and 24-HDR (y axis).
Power analysis
The sample size for the present study was based on feasibility of recruitment but was within the range of published validation studies(Reference Pandey, Bhatia and Boddula15,Reference Bharathi, Kurpad and Thomas17,Reference Dwarkanath, Soares and Thomas18) . With fifty-eight subjects included in the analysis, the minimally detectable crude correlation with 80 % power is 0·36 for a two-sided, 0·05-level test.
Analyses were conducted in either SAS 9·4 (SAS University Edition, SAS Institute Inc.), Stata13 (StataCorp.) or Microsoft Excel 2016 (Microsoft Corp.), and a P-value <0·05 was considered statistically significant.
Results
Of the seventy women enrolled in the study, data from fifty-eight women were analysed. The reasons for excluding twelve women from the analysis were missing FFQ (n 3), had less than three recalls (n 3), had implausible energy intakes (n 6: four on the basis of FFQ alone, one on the basis of FFQ and 24-HDR, and one on the basis of 24-HDR alone). The median (Q1, Q3) age at enrolment of the study participants was 23 (20, 25) years. The median (Q1, Q3) gestational age at the time of enrolment and at the time of administering the FFQ was 20·4 (17·2, 22·3) weeks and 28·9 (28·3, 29·5) weeks, respectively (Table 1). Majority (62 %) had completed middle to high school, although a large proportion of the study participants (29 %) either never attended school or had completed only primary school. Nearly half of the study population had a household monthly income of < INR 10 255 (about USD 135), that is, India’s poverty line. More than 80 % of the women were housewives. The median (Q1, Q3) mid-upper arm circumference during the second and third trimester visits was 23·5 (21·9, 25·5) and 24·1 (22·5, 26) cm, respectively. Using a pregnancy mid-upper arm circumference cut-off of ≤23 cm to define undernutrition and risk of low birth weight, 44 and 31 % of women were undernourished in the second and third trimester, respectively(Reference Vasundhara, Hemalatha and Sharma38,Reference Tang, Chung and Dong39) . The median (Q1, Q3) gestational weight gain from enrolment through delivery for this population was 2·79 (0·7, 6·4) kg with a maximum weight gain of 15·5 kg and a maximum weight loss of 5·9 kg. The median difference in weight gain between the second and third trimester visits was 4·15 kg. In addition, two women (3·5 %) had babies born preterm, and fifteen women (27 %) had babies who were born low birth weight.
Table 1. Demographic characteristics of pregnant women living in the urban areas of Pune, India, between 2016 and 2019 and participating in the FFQ validation study (n 58)
(Medians and interquartile ranges (Q1, Q3); numbers and percentages)

MUAC, mid-upper arm circumference; INR, Indian rupees (currency code for India).
* Cut-offs represent India’s poverty line.
Median (Q1, Q3) energy intake among our urban pregnant population in Pune was 10 552 (8000, 11 958) and 10 673 (8510, 13 962) kJ from the multiple 24-HDR and FFQ, respectively (Table 2). Macronutrient intake as a percentage of energy intake from 24-HDR is as follows: protein 11 %, carbohydrate 55 % and fat 26 %. Similarly, macronutrient intake as a percentage of energy intake from FFQ is as follows: protein 13 %, carbohydrate 57 % and fat 31 %. When compared with the means of multiple 24-HDR, the FFQ overestimated intakes for all nutrients, and the overestimation ranged 4–20 % for macronutrients and 7–536 % for micronutrients. Among the macronutrients, the median overestimation was highest for fat (20 %), and among micronutrients, the median overestimation was highest for vitamin A (536 %) and lowest for Zn (7 %). Energy had the lowest median overestimation (1 %). A comparison of medians demonstrated no significant difference in the energy and carbohydrate intake when measured using 24-HDR and FFQ. However, the medians of all the micronutrients and other macronutrients including protein and fat were significantly different between the two methods.
Table 2. Daily nutrient intake from FFQ and 24-h dietary recall (24-HDR) among pregnant women living in the urban areas of Pune, India, between 2016 and 2019 and participating in the FFQ validation study (n 58)
(Medians and interquartile ranges (Q1, Q3))

* RDA by National Institute of Nutrition (NIN) for a pregnant woman with a body weight of 55 kg and sedentary lifestyle.
† Difference between the medians (Kruskal–Wallis test)
The Pearson correlations (Table 3) between log-transformed estimates from FFQ and multiple 24-HDR were similar for macronutrients including carbohydrate (0·45), protein (0·48) and energy (0·47) but lower for fat (0·33). Among fat, cholesterol had the highest correlation (0·54), and PUFA the lowest (0·11). Among the micronutrients, Fe (0·4) and Zn (0·54) had good correlations from FFQ and 24-HDR. Energy adjustment improved the correlation only for some nutrients, that is, carbohydrate, saturated fat, vitamin B1, vitamin A, vitamin C, Ca, Fe and Na. When the within-person variation was accounted for by performing de-attenuation analysis, the correlation (r 0·52) between energy intake estimated using the two methods lie in the same range as that described by Willet of 0·4–0·7(Reference Willett14). The de-attenuation of log-transformed correlations and energy-adjusted correlations significantly improved the correlations for almost all nutrients except cholesterol, and a larger magnitude of improvement was observed for PUFA, vitamin C and Na. When we repeated these analyses by further adding individuals who had 24-HDR with average totally energy intakes above 20 083 kJ, our correlation results were similar (data not shown). The unadjusted correlations were significant after Bonferroni correction for the following nutrients: energy, protein, carbohydrates, cholesterol, vitamin B2, Ca, Fe, P and Zn. After adjusting for energy and Bonferroni correction, correlations of almost all nutrients were significant (P < 0·003).
Table 3. Correlation between nutrient intake FFQ and average of multiple 24-hour dietary recalls among pregnant women living in the urban areas of Pune, India, between 2016 and 2019 and participating in the FFQ validation study (n 58)
(Correlation coefficients and 95 % confidence intervals)

* Adjusted for total energy intake using residuals generated from the model with energy as independent variable and nutrient intake as dependent variable.
† Correlation coefficients de-attenuated to account for random measurement error calculated by ANOVA.
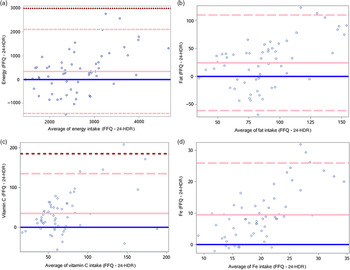
The highest misclassification into extreme tertiles was observed for fat (22 %), saturated fat (21 %) and Na (21 %) (Table 4). However, there was good agreement between the FFQ and 24-HDR for these nutrients when visualised by Bland–Altman plots (Fig. 1, online Supplementary Fig. S1). Despite this good agreement, the FFQ showed poor agreement with 24-HDR for these nutrients at higher intake levels, especially fat, saturated fat and PUFA. Among the macronutrients, intakes of protein and fat were estimated with more bias by the FFQ compared with carbohydrate, especially at higher intake levels, but overall there was good agreement as most points fell within 2 sd of the mean difference. It is, however, important to note that there was variation. FFQ showed very poor agreement for vitamins with the most bias observed for vitamin A. Similarly, while the FFQ showed good agreement with 24-HDR for most minerals, Fe performed very poorly with respect to agreement between the two methods.
Table 4. Comparison of percentage agreement and misclassification of nutrient intake from FFQ and multiple 24-hour diet recall among pregnant women living in the urban areas of Pune, India, between 2016 and 2019 and participating in the FFQ validation study (n 58)
(Numbers and percentages)


Fig. 1. Bland–Altman plots between the 24-h diet recall (24-HDR) and FFQ among pregnant women living in the urban areas of Pune, India, between 2016 and 2019 and participating in the FFQ validation study (n 58). Blue line = 0; solid pink line = mean difference; dashed pink line = 2 sd; dashed brown line = 3 sd. (a–d): Bland–Altman plots of difference in nutrient intake measured using FFQ and 24-HDR plotted against the average of the nutrient intake measured using FFQ and 24-HDR; (a) energy intake, (b) fat intake, (c) vitamin C intake, (d) iron intake.
Discussion
We conducted a validation study of the NINA-DISH FFQ among a sample of pregnant women with or without HIV in their second and third trimesters living in the urban areas of Pune, India. We demonstrated that the NINA-DISH FFQ adapted for the study population measured most macronutrients and micronutrients (energy, protein, carbohydrates, cholesterol, vitamin B2, Fe, P and Zn) with correlation coefficient r > 0·4 when compared with multiple 24-HDR. In most studies conducted previously, nutrient estimates from FFQ were considered valid when r > 0·4(Reference Willett14). This FFQ can therefore be used in this and similar populations to examine the role of diet during pregnancy in population-based studies.
The total energy intake estimated was found to be greater than the RDA for pregnant women for sedentary lifestyle (RDA for energy = 9414 kJ/d) but less than the RDA for moderate lifestyle (RDA = 10 794 kJ/d), as outlined by the National Institute of Nutrition-Indian Council of Medical Research(40). Our study population resides in urban low-income areas of Pune, India, and very few were skilled workers or professionals. While previous studies have demonstrated low physical activity among women of reproductive age residing in urban slums of India(Reference Yadav and Krishnan41,Reference Nagarkar and Kulkarni42) , our study population likely has a lifestyle between sedentary and moderate activity. Under an assumption of sedentary lifestyle, the average total energy and fat intakes exceeded the RDA for sedentary lifestyle, and the protein intakes were lower than the RDA, whereas this was not the case under an assumption of moderate lifestyle where the intakes did not meet the RDA. In a systematic review of dietary intake among pregnant women in low- and middle-income countries, women were found to be consuming inadequate nutrients during pregnancy with lowest levels of intake in Asian and African countries(Reference Lee, Talegawkar and Merialdi43). This was also true in the case of rural pregnant women in Pune (India) involved in agricultural activities with inadequate energy and protein intake(Reference Rao, Kanade and Yajnik44). On the contrary, our study participants were likely to be at least meeting their energy intake RDA.
In 2014, Dwarkanath et al. conducted a study of the validity of an FFQ among urban pregnant women in southern India and report an average energy consumption of 7334 kJ/d (about 1834 kcal/d) and 7987 kJ/d (about 1997 kcal) in the second and third trimesters, respectively(Reference Dwarkanath, Soares and Thomas18). Despite differences in the absolute values of energy and nutrient intake within our study, the percentage overestimation of nutrient intakes by the FFQ in their study was similar to or higher than those we report. In our study, overestimation was lowest for energy (1·17 %) followed by protein (4 %), whereas in the study by Dwarkanath et al. (Reference Dwarkanath, Soares and Thomas18), overestimation ranged between 12–29 % for protein and 10–27 % for energy across the three trimesters. Systematic measurement error such as under or overreporting stemming from recall bias is often not easy to detect, but FFQ often tend to overestimate intake(Reference Willett14).
The reasons for the significant overestimation of vitamin A and cholesterol in our study were further explored. We found that vitamin A-rich foods, primarily green leafy vegetables such as fenugreek leaves, spinach, were reported a greater number of times on the FFQ compared with 24-HDR. In addition, we found that cholesterol was overestimated because FFQ captured eggs and meat consumption which the 24-HDR did not at several instances. Potential reasons for 24-HDR not capturing this include day of the week when participants visit the clinic coupled with different occasions when women fast for cultural or religious reasons, especially when observing some form of food abstinence. The frequency of occurrence of above-mentioned situations was not quantified. Further, nutrients such as vitamin A and fat require more replicates of 24-HDR per person to capture usual intakes and the intra-individual variance accurately, for example, 28 d(Reference Willett14). Thus, we could be underestimating these intakes in our study with limited number of recalls. Despite being overestimated, there was a high correlation for cholesterol estimates from the two methods, comparable to those reported by other investigations(Reference Cheng, Yan and Dibley45,Reference Zhang, Qiu and Zhong46) .
Most intake estimates had moderate correlations, for example, correlation of energy when comparing the FFQ and 24-HDR was 0·47. The correlations are either comparable with or lower than (e.g. for fat) those reported by other studies: carbohydrate, 0·44–0·76; protein, 0·28–0·63 and fat, 0·41–0·64(Reference Dwarkanath, Soares and Thomas18,Reference Cheng, Yan and Dibley45–Reference Whitton, Ho and Tay48) . Among the micronutrients, correlation of Fe had a wider variation across the different studies (0·17–0·43) and ours was within this range (0·40). Similarly, correlations of vitamin C, vitamin A and Ca in our study are comparable with other studies. Cade et al. in their review of validation studies highlight that typically Ca and fat have the highest correlations among micronutrients, whereas vitamin A has the lowest correlation(Reference Cade, Burley and Warm49). In our study, some of the lowest correlations were observed for micronutrients including vitamin A, Ca and fat. However, within fat, cholesterol had a high correlation, whereas saturated fat and PUFA had very low correlations. Whitton et al. also report a poor correlation for saturated fat (0·35 and 0·27 in two rounds) and PUFA (0·04 and 0·16 in two rounds) in a very diverse multi-ethnic population in Singapore(Reference Whitton, Ho and Tay48). These values are similar to ours, that is, saturated fat 0·23 and PUFA 0·11.
Whitton et al. attribute the poor correlation of saturated fat and PUFA to differences in portion sizes as well as a higher frequency of consuming ‘outside foods’, that is, foods purchased and not cooked at home. Street foods/outside foods were also consumed abundantly in our study. We did not have detailed recipe information to accurately and quantitatively measure nutrient intakes of these ‘outside foods’, many of which were fried, and for which we had to presume the type of fat used. For the variation in correlations for micronutrients, a reason could be seasonality of fruit and vegetable consumption, adding to intra-individual variation, especially for vitamin A and C intakes. For example, mango is a fruit available throughout summer alone. Therefore, long-term reporting on FFQ of mango consumption gets averaged out for the period, but that reported in a 24-HDR is representative only for the previous 24-h period.
Adjusting for energy reduced the correlations in other studies(Reference Dwarkanath, Soares and Thomas18,Reference Zhang, Qiu and Zhong46,Reference Shatenstein, Xu and Luo47) . In our study, energy adjustment and de-attenuation improved correlations of most nutrients (except protein, cholesterol and Zn) and were comparable to that found by Branstaeter et al. among pregnant women in the Norwegian Mother and Child Cohort Study (MoBA)(Reference Brantsæter, Haugen and Alexander50). As previously reported, it is common for the energy-adjusted correlations to lie between 0·45 and 0·7, and our findings align with the same(Reference Willett14,Reference Thompson and Byers51) . From the Bland–Altman plots (Fig. 1), we observe a likely bias at higher intake levels, a pattern observed in other studies as well(Reference Mouratidou, Ford and Fraser52).
To quantify bias between nutrient estimates obtained from FFQ compared with 24-HDR, we assessed the percentage agreement of nutrients between the categories. Misclassification generally increased as correlations decreased, as can be seen for fat, saturated fat and Na. Similarly, nutrients such as cholesterol and Zn had good correlations and also had fewer people who were misclassified. Vitamin A data, however, did not follow this pattern, where despite the poor correlation, nobody was misclassified. We also assessed bias using another method, proposed by Bland–Altman, by determining the difference in the nutrient intakes estimated FFQ and 24-HDR and comparing with the average of intakes from the two methods(Reference Bland and Altman37). Bland–Altman plots in our study confirmed our findings from correlation analysis for macronutrients and most micronutrients, specifically minerals, indicating agreement between the two methods.
FFQ in general tend to overestimate intakes and this could be a consequence of random between-person errors or systematic within-person errors, such as incorrectly reporting quantity of liquids or foods that have irregular or varied shapes (e.g. circular flat breads made of wheat, sorghum or pearl millet)(Reference Willett14). In addition, overestimation could stem from underreporting on 24-HDR, for example, among those who are overweight/obese or among those who consume small portion sizes. Regardless of the specific source of error, the presence of these errors in a diet-disease model can attenuate the effect estimates towards the null. Using nutrient residuals after adjustment for energy in the diet-disease models can partially mitigate the impact of random error and overestimation(Reference Willett14).
Strengths and limitations
One of the strengths of our study is that we were able to collect three to five 24-HDR in the second and third trimester for individuals in this analysis, and the FFQ also queried the diet in the same period. Due to day-to-day variability in dietary intake, an average of multiple 24-HDR is used to estimate usual intake. Approximately, 97 % of our participants had four or more 24-HDR with a 96 % retention rate. However, for various nutrients, even five recalls are insufficient to appropriately capture the random variability in dietary intake. As this random error results in an attenuation of correlation coefficients, we used an approach that accounts for this measurement error by de-attenuating the correlation coefficient by using intra-individual variation data obtained from multiple recalls. Another strength of the study is that we were able to adapt the FFQ prior to administering to the cohort. In addition, trained personnel collected data that helped with better data quality. However, the present study also has a few limitations. We had a relatively small sample size, especially after removing those with implausible energy intakes from the analysis. In addition, as is common in self-report, both FFQ and 24-HDR require the participant to rely on their memory, resulting in recall bias, especially for FFQ that seeks to capture long-term consumption(Reference Willett14). In addition to what was consumed, information on portion size also relies on memory. In the present study, we used local-sized containers to inquire portion size as opposed to containers with standard volume which the participants do not use. Despite using local containers, recall error cannot be completely eliminated with regard to portion size estimation.
Further, we were not able to evaluate the validity of the content of fibre, folic acid and vitamin B12, as information on the content of these nutrients for various foods was missing in some of the databases. Future work to expand the FFQ food items queried and the nutrient database should be conducted to enhance the value of the tool for future investigations.
Conclusion
Our study demonstrates that the NINA-DISH FFQ is a useful and feasible tool that can be used to query and estimate dietary intakes among pregnant women from an urban area in western India. This FFQ is valid for use in pregnancy when compared with multiple 24-HDR, especially for macronutrients and minerals among the micronutrients. Therefore, it can be used to evaluate the relationship between diet and various maternal–infant health outcomes in this population and similar populations.
Acknowledgements
The authors thank the study participants for their time and contributions as well as the study staff who meticulously collected detailed dietary information. We also thank Dr. Rashmi Sinha and Sriram Hariharan for their help with the NINA-DISH questionnaire and database information.
This work was supported primarily by the United States National Institutes of Health (NIH), Bethesda, MD, USA (R00HD089753 to R. S. and R01HD081929 to A. G.). This research was also funded in part by a 2015 developmental grant to R. S. from the Johns Hopkins University Center for AIDS Research, an NIH-funded programme (1P30AI094189), which is supported by the following NIH Co-Funding and Participating Institutes and Centers: NIAID, NCI, NICHD, NHLBI, NIDA, NIA, NIGMS, NIDDK, NIMHD. J. S. M. received support from NIAID (K23AI129854). Additional support for this work was the NIH-funded Johns Hopkins Baltimore-Washington-India Clinical Trials Unit for NIAID Networks (U01AI069465 to A. G.). The content is solely the responsibility of the authors and does not necessarily represent the official views of the NIH.
K. R. translated all the recalls from Marathi to English, analysed data and drafted the manuscript. M. A. contributed to study design and interpretation and led the data collection. S. N., N. P., S. M. and R. B. contributed to data collection and writing of this manuscript. C. L. contributed to data interpretation and review of the manuscript. J. S. M., L. E. C. and A. G. contributed to the study design, implementation and interpretation of the findings. S. T. and R. S. led the conceptual design and contributed to study implementation, analysis and writing of the manuscript. All authors have approved the final manuscript and agreed to publication.
The authors had no conflict of interest relevant to this article to disclose.
Supplementary material
To view supplementary material for this article, please visit https://doi.org/10.1017/S0007114520005188