


IHD is a leading cause of morbidity and mortality worldwide with an estimated 7·4 million deaths due to IHD in 2015(1). Addressing modifiable risk factors such as dietary intake may support the prevention of IHD(Reference Van Horn, McCoin and Kris-Etherton2–4).
In the Nordic countries, science-based public health messages on diet include dietary reference values and dietary guidelines (DG). These dietary messages are based on the totality of evidence with the goal of guiding the prevention of pertinent non-communicable diseases, including CVD, certain types of cancers, type 2 diabetes, overweight and obesity, osteoporosis and tooth health(5). The Danish official (OFF) DG from 2013 was based on a systematic literature review on the relationship between dietary intake and physical activity and relevant non-communicable diseases, on knowledge of the habitual Danish dietary habits and on the Nordic Nutrition Recommendations 2012(Reference Tetens, Andersen and Astrup6).
Dietary adherence to the Danish OFF DG is generally described as ‘low’(Reference Knudsen, Fagt and Trolle7). Data from the Danish National Survey of Diet and Physical Activity 2011–2013 with 3014 adults (18–75 years) showed that <1 % complied with all five of the ten guidelines, and when adherence was assessed as a relative measure with a dietary quality score from 0 to 5, only 22 % of the participants had a relatively healthy diet with scores above 3·8(Reference Sørensen, Matthiessen and Holm8). The longitudinal Danish Diet, Cancer and Health cohort study of adults aged 50–64 years (n 55 021) concluded that adherence to the 2013 Danish DG was inversely associated with risk of myocardial infarction(Reference Hansen, Overvad and Tetens9). In the same line, The Danish Copenhagen General Population Prospective Study of adults (n 100 191) aged 58·0 (sd 13·1) years at recruitment showed that cardiovascular mortality at follow-up was 30 % higher in individuals with very low adherence to the DG compared with those which a high adherence after appropriate adjustments(Reference Ewers, Marott and Schnohr10). As the prevalence of IHD is still relatively high, new effective dietary message strategies to prevent further development are needed(3).
Several randomised controlled intervention studies (RCT) have been conducted earlier to study the effects of DG on dietary intake and CVD risk factors(Reference Knudsen, Fagt and Trolle7–Reference Ewers, Marott and Schnohr10). Jenkins et al. conducted a 6-month RCT with or without free food provision and dietary counselling via a leaflet and telephone advice by health professionals, measuring the effects of the Health Canada’s food guide in healthy overweight participants on dietary intake and CVD risk factors(Reference Knudsen, Fagt and Trolle7). In the 12-week Cardiovascular disease risk REduction Study, Reidlinger et al. compared the effects in healthy middle-aged participants of following the UK DG with a traditional British diet on vascular and lipid CVD risk factors(Reference Sørensen, Matthiessen and Holm8). Free food provision and a combination of face-to-face meetings, e-mails and phone calls from health professionals were part of the intervention. Uusitupa et al. compared in their 18- or 24-week SYSDIET (The Systems Biology in Controlled Dietary Interventions and Cohort Studies) RCT in participants with features of metabolic syndrome the effects of a healthy Nordic diet and a habitual (control) diet on dietary intake and CVD risk markers, providing free foods and face-to-face dietary advice meetings with a dietitian(Reference Hansen, Overvad and Tetens9). Also, in the 4·8 years, Primary Prevention of Cardiovascular Disease with a Mediterranean Diet, Estruch et al. provided free extra-virgin olive oil or mixed nuts together with dietary advice via face-to-face meetings with a dietitian, studying in participants with high cardiovascular risk the effects on major cardiovascular events(Reference Ewers, Marott and Schnohr10). The UK, the Nordic and the Mediterranean studies all found health beneficial effects of the investigated DG on dietary intake and CVD risk factors or major cardiovascular events(Reference Sørensen, Matthiessen and Holm8–Reference Ewers, Marott and Schnohr10) whereas the Canadian study found small benefits in CVD risk factors and an increased retention in the dietary intake in the group that was provided with free foods, only. Thus, previous RCT shows that provision of free key foods together with the intensity of the dietary advice are important factors for the outcomes of an RCT.
Dietary advice and communication of DG are key aspects of effective intervention studies and they should be clear, simple, and action-oriented reaching out for different target audiences(Reference Tetens, Birt and Brink11). Substitution (SUB) DG that specify what foods to substitute for what, e.g. eat fish instead of meat, or whole grain products instead of refined cereal products, may be an new way of expressing DG that may be easier to understand and apply.
In relation to population groups at risk of IHD, the dietary messages can be targeted by building on convincing scientific evidence from both cohort studies and RCT. Thus, studies have convincingly shown that SFA substituted with PUFA is beneficial for CVD(Reference Jakobsen, O’Reilly and Heitmann12,Reference Mozaffarian, Micha and Wallace13) . Results from cohort studies suggest that SUB of foods high in SFA with foods with low glycaemic index values but not high glycaemic index is associated with a lower risk of IHD(Reference Jakobsen and Overvad14). Likewise, consumption of whole grain as part of a healthy diet has consistently been associated with a lower risk of developing CVD(Reference Aune, Keum and Giovannucci15,Reference Tang, Wang and Long16) . The Danish diet is characterised by a relatively high intake of whole grain(Reference Af, Mejborn and Hess17), high intake of total fat and SFA and alcohol(Reference Pedersen, Christensen and Matthiessen18).
Our hypothesis is that the use of dietary SUB targeted a specific non-communicable disease is an effective dietary advice strategy. The objective of this study was to investigate the effects of SUB DG targeted at prevention of IHD on dietary intake and IHD risk factors in middle-aged Danish adults with minimum one self-assessed IHD risk factor.
Methods
Study design
A 6-month, single-blinded, parallel group, RCT with a follow-up at month 12 was conducted in a real-life setting and included adult participants with one or more self-reported risk factor for IHD.
As the current ten OFF DG had just been launched in 2013 during the design phase of the present study, we planned to include both a SUB DG group and an OFF DG group to allow us to exclude that the effects from the SUB DG were related to the OFF DG. A dietitian and several nutritionists were involved in the development of the design of the study, the materials distributed online and the dietary assessment. At baseline participants were assigned to either a control group advised to follow their habitual diet (HAB) or to one of two intervention groups receiving either SUB DG or the Danish OFF DG. The study was conducted from February 2014 to May 2015. This study was part of the research project ‘Diet and Prevention of Ischemic Heart Disease: a Translational Approach’ (DIPI) (www.dipi.dk) which aimed at providing novel and comprehensive knowledge of foods and macronutrients on IHD by emphasising specified SUB of foods and macronutrients through several longitudinal cohort studies and in an RCT.
All study participants were informed about the purpose of the study and signed informed consent consciously and voluntarily, and they received a renumeration of around thrity-four Great Britain Pound for their participation in the study. The study was conducted according to the guidelines laid down in the Declaration of Helsinki and was approved by The Capital Region of Denmark Ethics Committee (journal no. H-1-2013-110) and by the Danish Data Protection Agency (journal no. 2013-54-0571). The study was registered at ClinicalTrials.gov (registry name ‘Diet and Prevention of Ischemic Heart Disease: a Translational Approach (DIPI)’, ID no. NCT02062424). The study follows The CONSORT Statement.
Study participants
Potential participants were identified using a unique personal identification number assigned to all Danish citizens in the Civil Registration System (108). In total, 5000 men and women born during 1949–1984 and living in a defined area of Greater Copenhagen were invited by letter to participate in the study. The number of invited participants was based on previous experience of a low response when recruiting participants for RCT. All together, 334 potential participants responded to the invitation (Fig. 1). In a self-administered questionnaire, the potential participants reported their height in metres, weight in kg, their waist circumference at a height 2 cm above the umbilicus and whether they were moderately physically active during leisure time for more than 15 min/d. This cut-off point for physical activity was chosen as a compromise of the OFF guideline from the Danish Health Authority of minimum 30 min of moderate physical activity per d and knowledge from an earlier national survey that showed that less than half of the Danish adult population fulfils this guideline(Reference Matthiessen, Rothausen and Sørensen19). The questionnaire also included questions related to the exclusion criteria (see below). Eligible participants were invited to an information meeting, where they were informed verbally about the study with time for questions. All together, 222 participants signed the informed consent form.
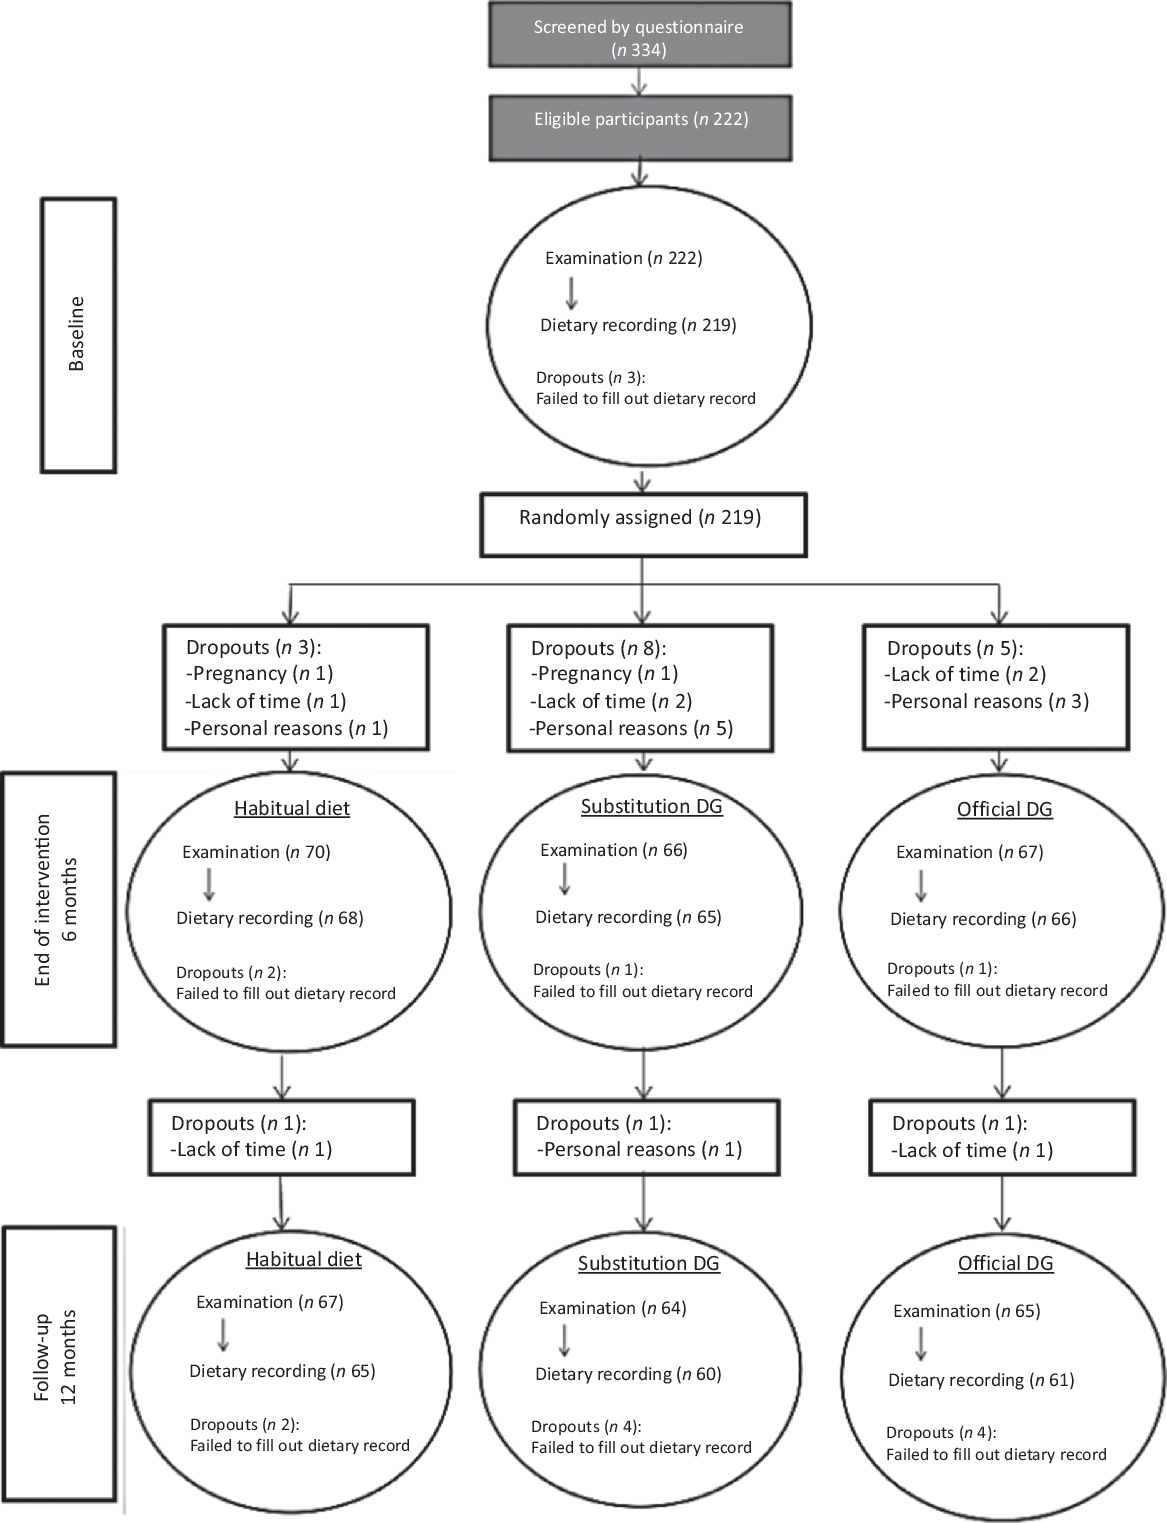
Fig. 1. Participant flow diagram. DG, dietary guidelines.
Inclusion and exclusion criteria
The inclusion criteria were age between 30 and 65 years and one or more of the self-assessed risk factors for IHD at screening: overweight or obesity (BMI ≥25 kg/m2), waist circumference ≥ 80 cm for women and ≥ 94 cm for men and/or physical inactivity defined as being moderately physically active during leisure time for 15 min or less per week.
Exclusion criteria were current smoking, pregnancy or plans to become pregnant within the next 12 months, breast-feeding, history of CVD, type 2 diabetes, chronic diseases/disorders that could affect the results of the study (chronic diseases reported by participants were evaluated by the physician responsible), drug abuse within the last 12 months, regular alcohol consumption > 14 units/week for women or > 21 units/week for men (one unit equals 12 g of pure alcohol), allergies or intolerance of the food groups included in the Danish DG, consumption of dietary supplements with high doses of nutrients that could have a potential effect on IHD risk factors (e.g. fish oils) and/or no access to a computer or the Internet.
Randomisation and intervention
After the baseline examination, eligible participants were randomly assigned (1:1:1), stratified by sex, to one of the three study groups using a computer randomisation plan (www.randomization.com) by a member of the project group. The responsible persons for assessing the outcomes were blinded.
The SUB DG group received five DG formulated as advice on which specific foods to substitute for what (Table 1). The SUB DG were targeted IHD and based on the scientific evidence for a relationship between specific foods and IHD outcomes found to be convincing or probable during a systematic literature update of the Danish OFF DG the previous year(Reference Tetens, Andersen and Astrup6). Futher, the SUB DG were based on insights to the habitual dietary intake of the general population(Reference Jakobsen and Overvad14), leading to a priority to emphasise fish rather than meat. Also, the SUB DG on coarse vegetables instead of fine vegetables’ were based on previous calculations that showed that unless vegetables had a high content of dietary fibre (DF) (DF > 2 g/100 g), the average dietary intake of DF would be insufficient in relation to the Dietary Reference Values (NNR2012). The OFF DG group received the OFF Danish ten DG on food, beverages, and physical activity (Table 1) that were based on convincing or probable evidence for a relationship between dietary intake and all non-communicable diseases relevant in the Danish context, on knowledge of the Danish dietary habits and the Nordic Nutrition Recommendations 2012(Reference Tetens, Andersen and Astrup6). The HAB group received no dietary advice.
Table 1. Targeted substitution dietary guidelines and Danish official dietary guidelines
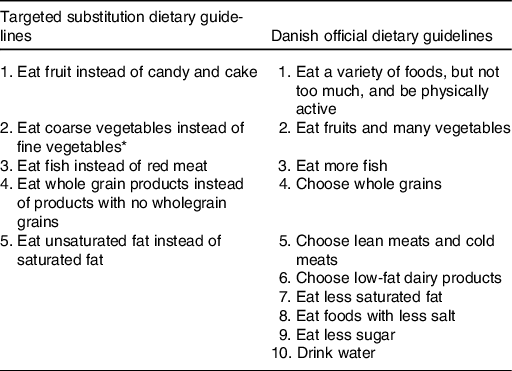
* Vegetables classified as ‘coarse vegetables’ have a dietary fibre content >2 g/100 g (e.g. all types of cabbage, root vegetables and onions) and vegetables classified as ‘fine vegetables’ have a dietary fibre content up to around 2 g dietary fibre/100 g (e.g. tomatoes, cucumber and green salad).
The two dietary intervention groups received a letter with a leaflet containing the respective guidelines and the link and a personal password to a website with the DG and supporting recipes (www.dipi.food.dtu.dk). Every 2 weeks during the 6-month intervention, the participants received new recipes for preparing meals and dishes that followed the specific set of DG. The SUB DG included dishes with fish, vegetables, whole grain and preparation with vegetable oil – reflecting the five DG-targeted IHD, and the participants in the OFF DG received recipes for preparing meals with lean meat, low-fat dairy products, fish, whole grain many vegetables and fruits. All recipes were developed by the Danish Veterinary and Food Administration and were labelled with the Keyhole, a nutrition label ensuring a high content of dietary fibre and a low content of total fat, saturated fat, sugar and salt, developed to make it easier for Nordic consumers to select healthy products(20). All recipes were constructed to serve a family of four and were energy unrestricted. The HAB group also received an e-mail every second week with a ‘thank you for still participating’ greeting.
At the end of the 6-month intervention period, the intervention terminated but the participants were reinvited to a follow-up examination at the follow-up at 12 months (Fig. 1).
Dietary assessment
Study participants recorded their dietary intake for seven consecutive days following their visit to the study site, using a self-administered web-based dietary assessment software(Reference Biltoft-Jensen, Bysted and Trolle21). Dietary assessment was done at baseline, at the end of the intervention (month 6) and at the end of the follow-up (month 12). The software was based on a validated 7-d food record, which has been used for the past two decades in the Danish National Survey of Dietary Habits and Physical Activity(Reference Pedersen, Christensen and Matthiessen18,Reference Biltoft-Jensen, Matthiessen and Rasmussen22) . The web-based dietary assessment software was originally developed and validated for children aged 8–11 years and was customised to fit the adult participants in the DIPI study(Reference Biltoft-Jensen, Bysted and Trolle21,Reference Biltoft-Jensen, Trolle and Christensen23,Reference Biltoft-Jensen, Damsgaard and Andersen24) . At least 4 d of food records had to be completed for participants to be included in the analysis(Reference Biltoft-Jensen, Matthiessen and Rasmussen22). If a participant did not start the dietary recording the day after the examination, they were reminded by mail or phone. If the participant did not start the food record 3 weeks after the visit to the study site the subject was considered a drop-out.
The web-based dietary assessment software was structured according to a typical Danish meal pattern covering breakfast, lunch, dinner and three in-between meals. The participants selected the amount consumed by choosing portion sizes from four different digital images in an eighty-photo series. Reminders for frequently overlooked foods (e.g. spreads, sugar, sauces, dressings, snacks, candy and beverages) were included in the software. Participants reported the intake of nutritional supplements and whether each day represented a usual or an unusual intake and included reasons for unusual intakes, such as illness. Intakes of food items, energy and nutrients were calculated for each study participant as an average of 7 d using the software system General Intake Estimation System (GIES) version 1.000.i6 (National Food Institute, Technical University of Denmark, Kgs. Lyngby, Denmark) and the Danish Food Composition Databank version 7.0 (National Food Institute, Technical University of Denmark, 2009).
Under- and over-reporters
Under- and over-reported energy intake was defined as a ratio of reported mean energy intake to BMR (EI:BMR) and classified using cut-offs suggested by Black(Reference Black25,Reference Goldberg, Black and Jebb26) . Under-reported energy intake was defined as EI:BMR ≤ 1·05, and over-reported energy intake was defined as EI:BMR ≥ 2·28, using a physical activity level 1·55 (data not shown). BMR was calculated using the equations by Henry(Reference Henry27).
Blood samples
Fasting blood samples from venepuncture were collected and analysed for concentrations of TAG, total cholesterol, HDL-cholesterol, high-sensitivity C-reactive protein, glucose, HbA1c and insulin. The blood samples were collected during the study visits and handled according to hospital routines. TAG, total cholesterol, HDL-cholesterol and glucose were measured in plasma by reflection spectroscopy, with peaks at 540 nm; high-sensitivity C-reactive protein was measured in the same way, with peaks at 660 nm (VITROS 5,1 FS; Ortho Clinical Diagnostics). HbA1c was measured in plasma using high-performance liquid chromatography (D-100; Bio-Rad). Fasting plasma insulin was measured using the sandwich ELISA analysis principle (ADVIA Centaur XP; Siemens). Within-run variation (CV%) for the biochemical measurements was 0·7–11 %. VLDL-cholesterol was calculated from TAG using the following equation: plasma VLDL-cholesterol = plasma TAG × 0·45(Reference Friedewald, Levy and Fredrickson28). LDL-cholesterol was calculated using the Friedewald equation(Reference Friedewald, Levy and Fredrickson28). Homoeostatic model assessment-insulin resistance was used to estimate insulin resistance and was calculated using the following formula: homoeostatic model assessment-insulin resistance = (glucose (nmol/l) × insulin (mU/ml)/22·5), using fasting values(Reference Matthews, Hosker and Rudenski29).
Plasma alkylresorcinol concentrations
Plasma alkylresorcinols (AR) that have been validated as an objective biomarkers for whole grain wheat and rye intake(Reference Ross30,Reference Magnusdottir, Landberg and Gunnarsdottir31) in studies in adults(Reference Ross, Pineau and Kochhar32–Reference Kyrø, Olsen and Landberg35) were measured in plasma samples as a validity marker of the dietary assessment method. Total AR was extracted and purified from plasma samples and analysed using GC–MS (Finnigan TRACE GC Ultra Gas Chromatograph coupled to a Finnigan TRACE DSQ II mass detector; Thermo Fisher Scientific), according to a method described in detail elsewhere(Reference Wierzbicka, Wu and Franek36).
Blood pressure and heart rate
Blood pressure and heart rate were measured in duplicate on the left arm, with the participant seated and after a 5-min rest, using an electric sphygmomanometer according to standard procedures. Participants were asked to empty their bladder before measurement and were not allowed to converse during the measurements or to have their legs crossed. If the diastolic blood pressure differed more than 5 mmHg between measurements, further readings were taken until diastolic blood pressure differed ≤ 5 mmHg between at least two consecutive measurements. Average values of the two blood pressure and heart rate measurements were calculated.
Anthropometric measurements
Height was measured to the nearest 0·5 cm using a wall-mounted stadiometer (Seca). Fasting body weight in kg and total body fat mass were registered on a body composition analyser (BC-418MA; Tanita), based upon bioelectrical impedance. Waist circumference was measured at the point midway between the iliac crest and the lower rib or 2 cm above the umbilicus. The hip circumference was measured at the point where the circumference was greatest, seen from the side. Waist and hip circumference was measured twice using an anthropometric tape (Seca 201) and the average was reported. BMI was defined as weight in kg divided by squared height in metres (kg/m2).
Background questionnaires
Questionnaires were used to obtain information about the participant’s education level (primary school/high school, associate degree, undergraduate degree, graduate degree) and level of physical activity during leisure time (extremely active, moderately active, sedentary or inactive) during the previous 6 months was based on the Danish National Health Profile questionnaire(37).
Statistical methods
Statistical power calculations were based on data from previous similar studies with a parallel design(Reference Estruch, Martínez-González and Corella38–Reference Goff, Cowland and Hooper40), suggesting that sixty-two participants in each intervention arm were sufficient to detect a difference of 0·25 mmol/l LDL-cholesterol concentration from baseline to the end of the intervention at month 6 for both SUB and OFF DG (sd 0·49) (α = 0·05, β = 0·8). The justifications for using a secondary endpoint in the statistical power calculation were our even interest in the secondary end points; the results of preliminary power calculations on individual food groups (fish and vegetables) that showed much lower number of participants per study arm and the main objective to study changes in dietary intake that is a composite of several food groups. To allow for a dropout of 20 %, the number of participants was set to a total of 225. Baseline characteristics and dietary intake of the participants were summarised using medians and 80 % central range for continuous variables and proportions for categorical variables.
Two multiple linear regression models were applied to evaluate changes from baseline to month 6 (primary outcome) and from baseline to follow-up at month 12 in the SUB DG group and the OFF DG group as compared with the HAB group. Model 1 was adjusted for baseline value of the outcome variable, and model 2 which was the primary analysis model was further adjusted for sex, age group (<50 and ≥50 years) and BMI group (BMI 18·5–25 kg/m2 as normal weight, >25–30 kg/m2 overweight and >30 kg/m2 obese). In model 2, interactions between the interventions and sex, age and BMI were additionally tested for statistical significance. If an interaction was observed, separate results were provided according to the level of the effect modifier. All analysis were performed with intention-to-treat principles. To check the model assumptions, the standardised residuals of the final models were examined for normality, variance homogeneity and linearity.
Sensitivity analyses excluding under- and over-reporters were conducted to investigate the impact of under- and over-reported energy intake.
To validate the whole grain intake estimated using the web-based dietary assessment, Spearman’s correlation analysis between whole grain intake (g/d) and total plasma AR was used for baseline data, and for data at month 6 and 12, with pooled groups (HAB, SUB and OFF) to strengthen power.
The statistical analyses were carried out using RStudio (version 0.99.441 – © 2009–2015 RStudio, Inc.). Statistical significance was established at P < 0·05.
Results
Baseline characteristics of the participants
A total of 222 participants met the inclusion and exclusion criteria and were enrolled into the study, which was 67 % of the initially screened potential study participants. Three participants dropped out of the study before randomisation (a full baseline examination was not obtained) and they were therefore excluded, see flow chart (Fig. 1). Baseline characteristics of the remaining 219 study participants, by randomised intervention group, are presented in Table 2. No adverse effects were reported during the study.
Table 2. Baseline characteristics of the study participants by randomised intervention group
(Median values and interquartile ranges (p25–p75), n 219)
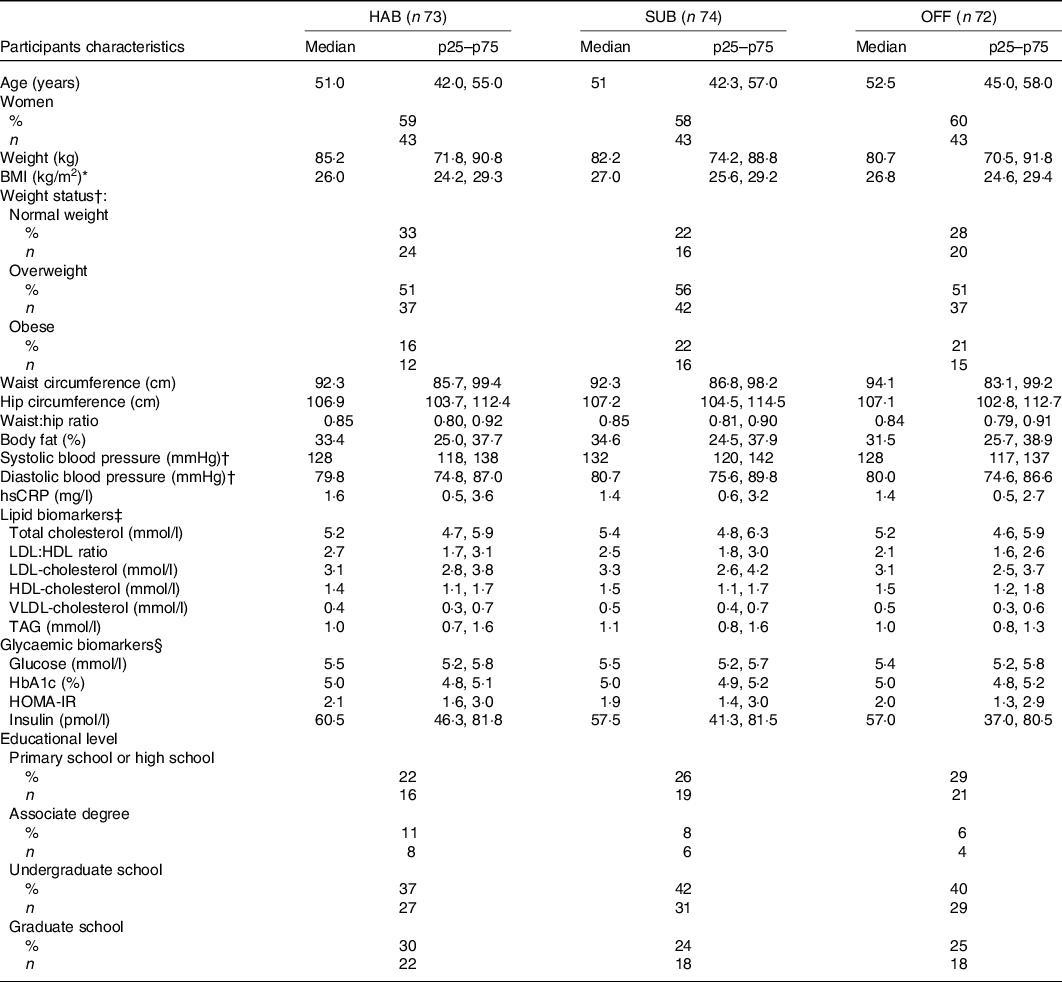
HAB, habitual diet; SUB, substitution dietary guidelines; OFF, official dietary guidelines; hsCRP, high-sensitivity C-reactive protein; HOMA-IR, homoeostatic model of insulin resistance.
* BMI 18·5–25 kg/m2 = normal weight, 25–30 kg/m2 = overweight, >30 kg/m2 = obese.
† n 216 after exclusion of those using blood pressure-lowing medication.
‡ n 214 after exclusion of those using cholesterol-lowering medication.
§ n 218 as it was not possible to draw enough blood for the glycaemic biomarkers analysis.
Altogether, 199 completed the intervention, corresponding to a retention rate of 90 % at 6 months and 186 participants completed the follow-up corresponding to a retention rate of 85% at month 12. Reasons for non-compliance are given in the flow chart.
Underreporting and sensitivity analysis
The percentage of under-reporters at baseline, at month 6 and at month 12 was 21, 35 and 31 %, respectively (data not shown). The sensitivity analysis did not change the findings for the two sets of DG compared with the HAB.
Dietary differences from baseline to 6 months
Table 3 presents the between-group differences in dietary changes from baseline to month 6. Compared with the HAB group, the group following the SUB DG significantly increased the intakes of whole grains, dietary fibre, fine vegetables and significantly decreased the percentage of energy intake from SFA. In addition, women in the group significantly increased their overall intake of vegetables and normal-weight participants in the group significantly increased their E% intake from PUFA.
Table 3. Baseline intake and between-group differences in changes in diet from baseline to month 6, energy-adjusted diet composition (g/10 MJ per d), total energy (MJ/d), energy contribution (percentage energy; E%) of macronutrients and dietary fibre (g/MJ)
(Median values and 10th to 90th percentiles (p10–p90); mean values and 95 % confidence intervals, n 199)
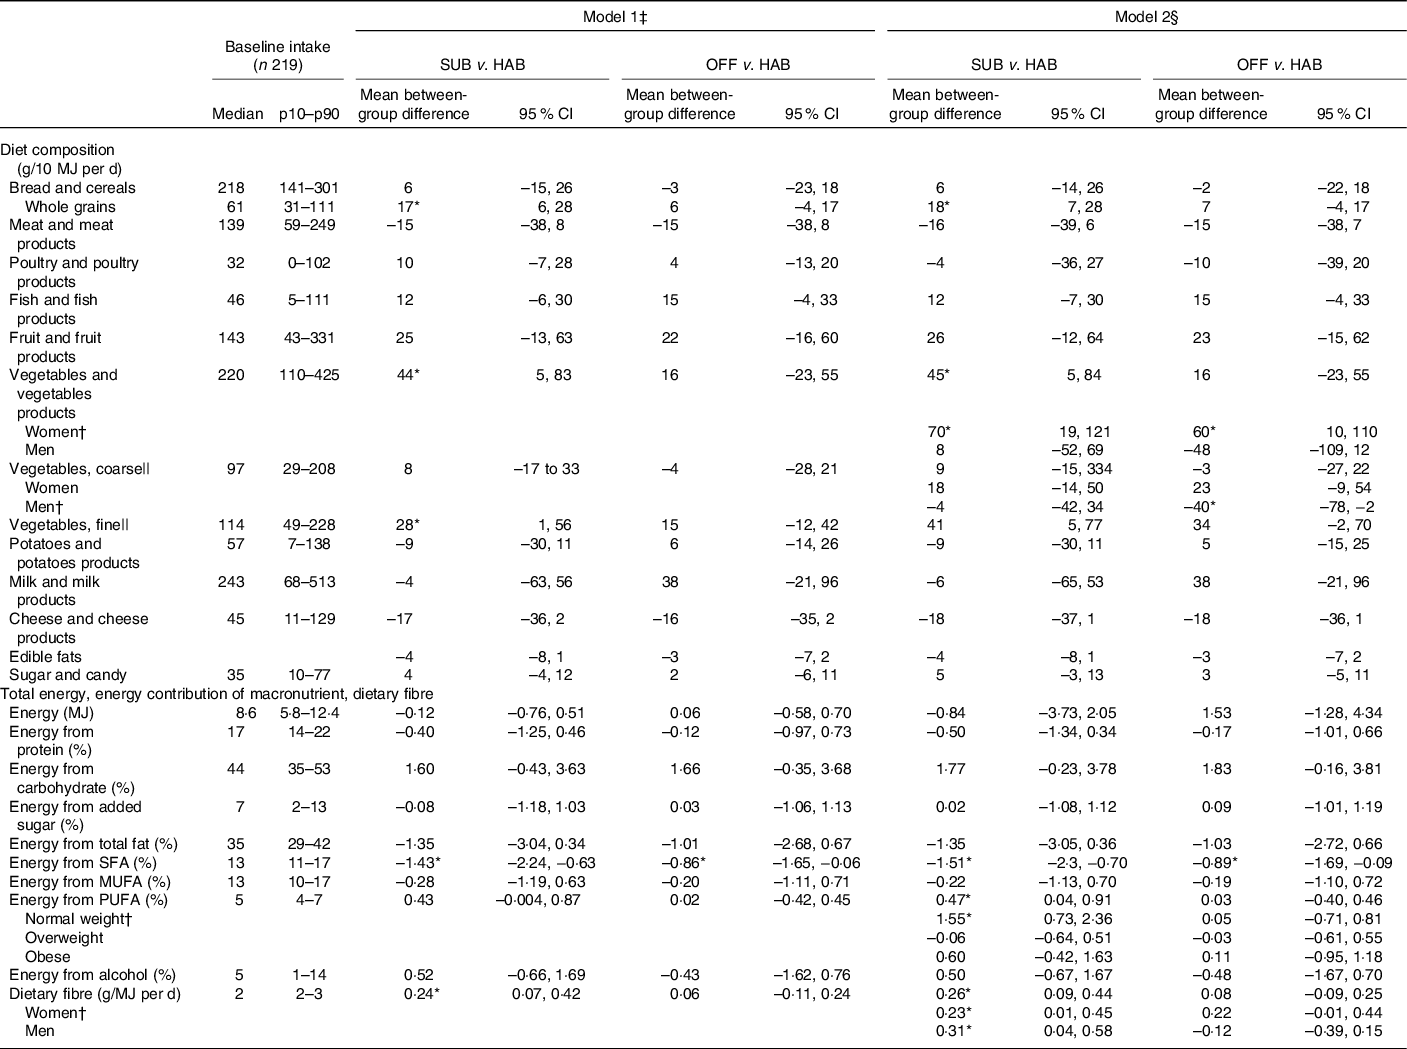
SUB, substitution dietary guidelines; HAB, habitual diet; OFF, official dietary guidelines.
* Difference statistically significant.
† A significant interaction was found for vegetable and vegetable products × women; for vegetables, coarse × men; for energy from PUFA × normal weight; for dietary fibre × women and dietary fibre × men.
‡ Simple linear regression models adjusted for baseline intake of the outcome variable.
§ Multiple linear regression model adjusted for baseline intake of the outcome variable, sex, age group (<50 and ≥50 years), BMI group (18·5–25 kg/m2 = normal weight, >25–30 kg/m2 = overweight, >30 kg/m2 = obese) and interactions between intervention group and sex, intervention group and age group and intervention group and BMI group.
|| Vegetables classified as ‘coarse vegetables’ have a dietary fibre content > 2 g/100 g (e.g. all types of cabbage, root vegetables and onions) and vegetables classified as ‘fine vegetables’ have a dietary fibre content up to around 2 g dietary fibre/100 g (e.g. tomatoes, cucumber and green salad).
Compared with the HAB, the OFF group significantly decreased the E% intake from SFA. Furthermore, the women in the group significantly increased their overall intake of vegetables. Men in the group significantly decreased the intake of coarse vegetables.
Dietary differences from baseline to follow-up at month 12
Table 4 presents the between-group differences in dietary changes from baseline to follow-up at month 12. Compared with the HAB diet, the group following the SUB DG continued to have an significantly increased intake of whole grains from baseline to follow-up at month 12 and significantly increased intake of fish. Obese study participants in the group significantly increased their vegetable intake in general. Participants in the group significantly increased their intake of sugar and candy and those aged ≥50 years significantly increased their E% intake from carbohydrates.
Table 4. Between-group differences in changes in diet from baseline to follow-up at month 12 in energy-adjusted diet composition (g/10 MJ per d), total energy (MJ/d), energy contribution (percentage energy; E%) of macronutrients and dietary fibre (g/MJ)
(Mean values and 95 % confidence intervals, n 186)
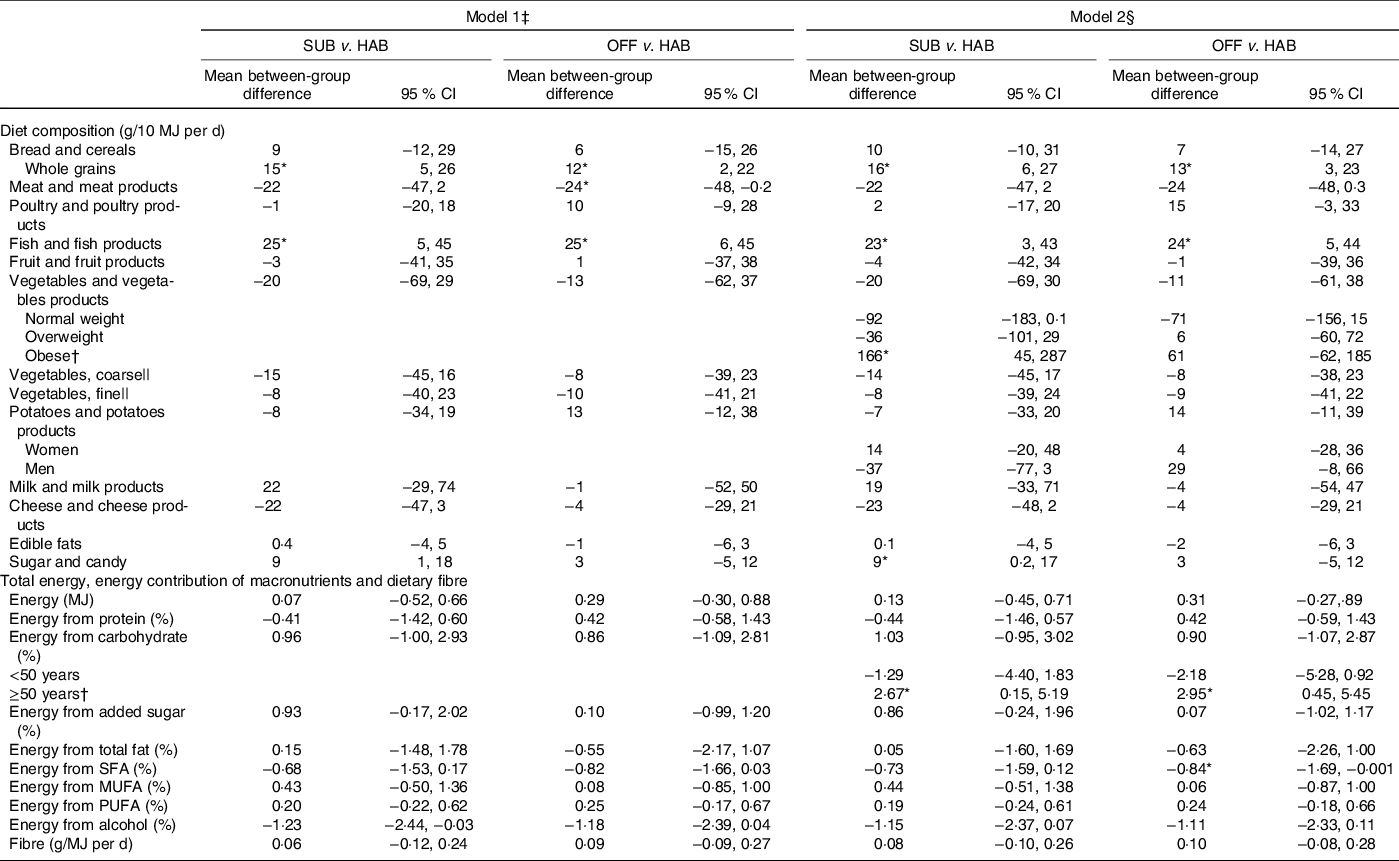
SUB, substitution dietary guidelines; HAB, habitual diet; OFF, official dietary guidelines.
* Difference statistically significant.
† A significant interaction was found for vegetables and vegetable products × obesity; energy from carbohydrates × subjects ≥50 years.
‡ Simple linear regression models adjusted for baseline intake of the outcome variable.
§ Multiple linear regression model adjusted for baseline intake of the outcome variable, sex, age group (<50 and ≥50 years), BMI group (18·5–25 kg/m2 = normal weight, >25–30 kg/m2 = overweight, >30 kg/m2 = obese) and interactions between intervention group and sex, intervention group and age group, and intervention group and BMI group.
|| Vegetables classified as ‘coarse vegetables’ have a dietary fibre content > 2 g/100 g (e.g. all types of cabbage, root vegetables and onions) and vegetables classified as ‘fine vegetables’ have a dietary fibre content up to around 2 g dietary fibre/100 g (e.g. tomatoes, cucumber and green salad).
Compared with the HAB diet, from baseline to follow-up at month 12, the OFF group significantly increased the intake of whole grains and fish and the significantly decreased E% intake from SFA remained. Participants aged ≥50 years in the group significantly increased the median E% intake from carbohydrates.
Correlations between whole grain intake and plasma alkylresorcinols
Statistically significant correlations were found between whole grain intake (g/d) and total plasma AR at baseline: (Spearman’s correlation ρ) 0·33, P < 0·001; at month 6: 0·23, P = 0·001 and at month 12: 0·44, P < 0·001.
Differences in IHD risk factors
Tables 5 and 6 present the between-group differences in IHD risk factors from baseline to month 6 and from baseline to follow-up at month 12, respectively. Overall, no significant differences were found in cardiometabolic risk factors for either of the two dietary guideline groups when compared with the HAB. A significant decrease was found in waist circumference from baseline to follow-up at month 12 among obese study participants following the OFF DG, compared with the HAB group.
Table 5. Between-group differences from baseline to month 6 in cardiometabolic risk factors
(Mean values and 95 % confidence intervals, n 203)
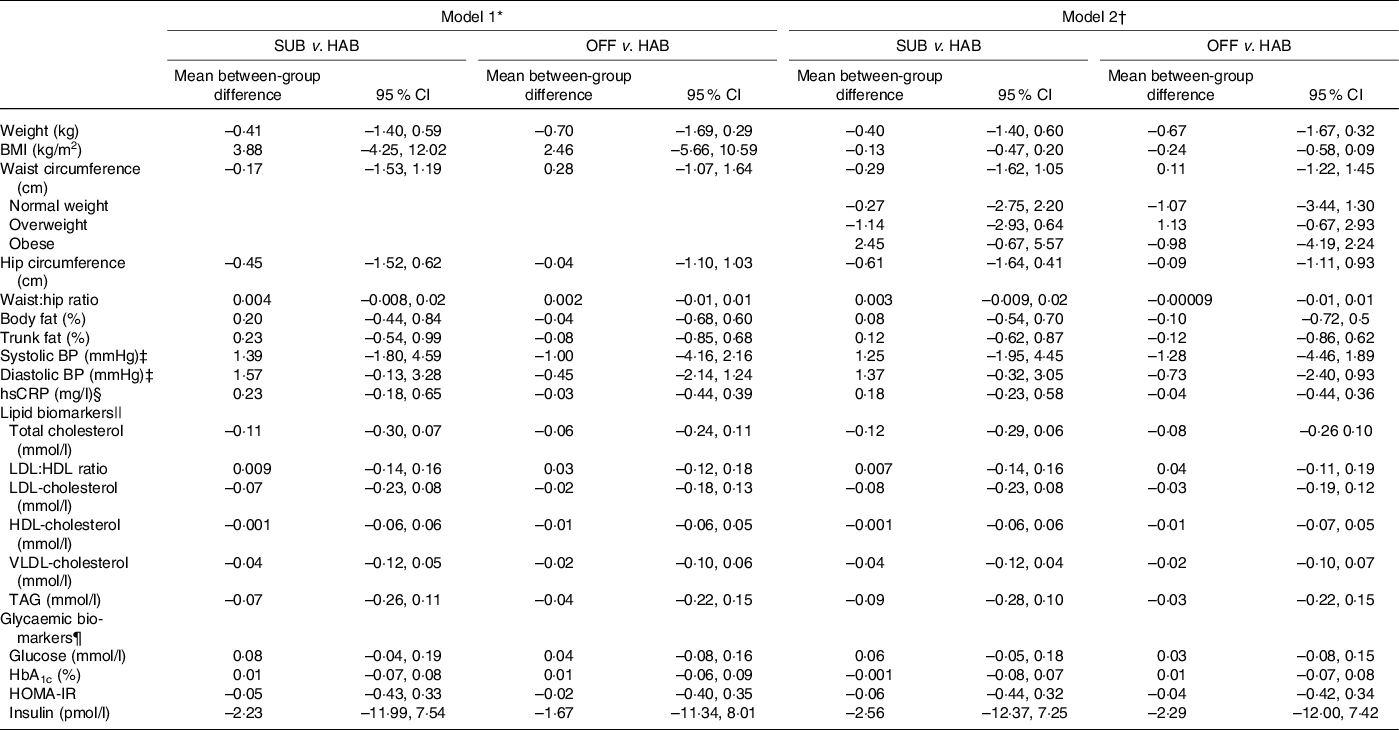
SUB, substitution dietary guidelines; HAB, habitual diet; OFF, official dietary guidelines; BP, blood pressure; hsCRP, high-sensitivity C-reactive protein; HOMA-IR, homoeostatic model of insulin resistance.
* Simple linear regression models adjusted for baseline intake of the outcome variable.
† Multiple linear regression models adjusted for baseline intake of the outcome variable, sex, age group (<50 and ≥50 years), BMI group (18·5–25 kg/m2 = normal weight, >25–30 kg/m2 = overweight, >30 kg/m2 = obese) and interactions between intervention group and sex, intervention group and age group and intervention group and BMI group.
‡ n 201 after exclusion of those using BP-lowering medication.
§ n 196 due to lack in biochemical analysis of hsCRP.
|| n 196 after exclusion of those using cholesterol-lowering medication.
¶ n 201 as it was not possible to draw enough blood for the glycaemic biomarkers analysis.
Table 6. Between-group differences in cardiometabolic risk factors from baseline to follow-up at month 12
(Mean values and 95 % confidence intervals, n 196)
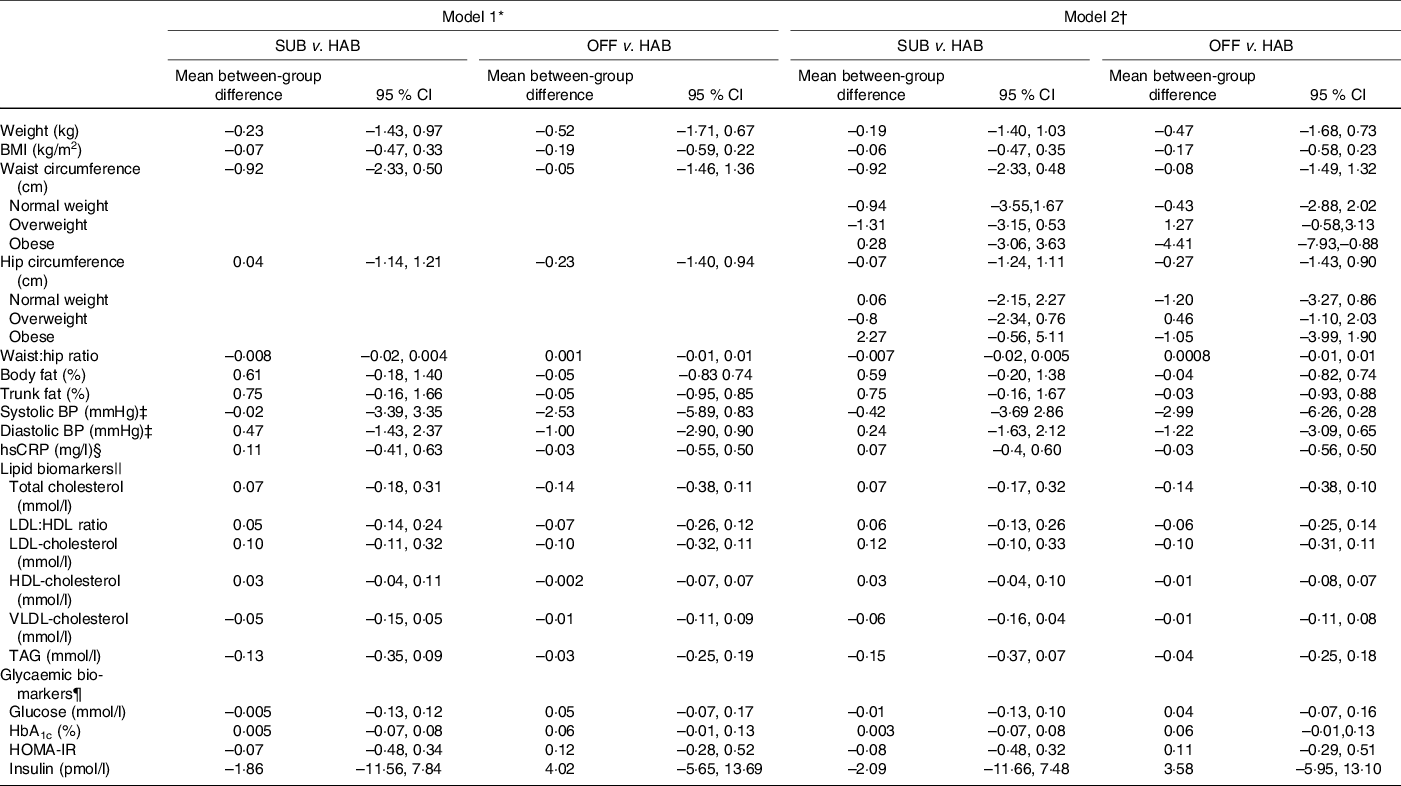
SUB, substitution dietary guidelines; HAB, habitual diet; OFF, official dietary guidelines; BP, blood pressure; hsCRP, high-sensitivity C-reactive protein; HOMA-IR, homoeostatic model of insulin resistance.
* Simple linear regression models adjusted for baseline intake of the outcome variable.
† Multiple linear regression models adjusted for baseline intake of the outcome variable, sex, age group (<50 and ≥50 years), BMI group (18·5–25 kg/m2 = normal weight, >25–30 kg/m2 = overweight, >30 kg/m2 = obese) and interactions between intervention group and sex, intervention group and age group and intervention group and BMI group.
‡ n 190 after exclusion of those using BP-lowering medication.
§ n 185 due to lack in biochemical analysis of hsCRP.
|| n 193 after exclusion of those using cholesterol-lowering medication.
¶ n 195 as it was not possible to draw enough blood for the glycaemic biomarkers analysis.
Discussion
In the present study, we found that the SUB DG had a greater impact on the extent of dietary change relative to HAB than OFF DG at the end of the intervention at month 6, whereas the extent of dietary changes relative to HAB diet was similar for the SUB and OFF DG groups at the follow-up at month 12. All dietary changes were in a more cardioprotective direction. However, neither the SUB DG nor the OFF DG resulted in any overall effects on the selected intermediate risk factors for IHD.
The results of the present study are in line with results of the RCT by Jenkins et al. who investigated the effects of dietary advice with and without food provision in healthy overweight adult men and women(Reference Jenkins, Boucher and Ashbury41). Comparable with the findings of an increased whole grain intake in the present study, Jenkins et al. also observed an increase in whole grain intake in their intervention group provided with dietary advice only, suggesting that an increased whole grain intake may be relatively easy DG to follow. In contrast, Jenkins et al. observed increased intake of other food groups in the groups where free foods were provided, and they found no significant changes in dietary intake in the intervention group only receiving dietary advice. In line with the results of the present study, Jenkins et al. found no difference in CVD risk factors after 6 months of intervention or after the 12-month follow-up period, among any of the three intervention groups, in comparison with the control group(Reference Jenkins, Boucher and Ashbury41).
The two other dietary RCT conducted in real-life settings (the Cardiovascular disease risk REduction Study(Reference Reidlinger, Darzi and Hall42) and the SYSDIET study(Reference Uusitupa, Hermansen and Savolainen43)) both found a beneficial effect on dietary intake in the groups on the UK OFF DG and the healthy Nordic diet, respectively, which were broadly similar to both the OFF DG in our study. However, in contrast to the results of the present study, both the Cardiovascular disease risk REduction Study(Reference Reidlinger, Darzi and Hall42) and the SYSDIET study(Reference Uusitupa, Hermansen and Savolainen43) found beneficial effects of the intervention on selected CVD risk factors, potentially leading to prevention of CVD.
In contrast to the results of the present study, a sub-study of the long-term dietary RCT, PREDIMED(Reference Estruch, Ros and Salas-Salvadó44), found short-term beneficial effects on CVD risk factors in two groups following the two Mediterranean diets that were provided with either extra-virgin olive oil or mixed nuts together with regular counselling with a dietitian, in comparison with a low-fat diet(Reference Estruch, Martínez-González and Corella38).
In the present study, a favourable decrease in energy percentage from SFA was found after the 6-month intervention with significant reduction in both the SUB and the OFF DG groups. In addition, normal-weight participants in the SUB DG increased their energy percentage from PUFA. At the follow-up at month 12, these changes in dietary fat composition were maintained only in the OFF DG. The other RCT using a different intervention strategy, namely provision of key foods during the intervention period, obtained similar beneficial dietary changes in dietary fat composition and further obtained beneficial changes in CVD risk factors(Reference Reidlinger, Darzi and Hall42–Reference Estruch, Ros and Salas-Salvadó44). Thus, while these studies confirm that the provision of key foods together with dietary advice is a prudent strategy to sustain dietary changes, our study suggests that a SUB dietary advice strategy targeted specific NDC as well as OFF DG may be as effective for changing dietary intake as food provision and individual councelling, at least in the shorter term.
Despite the favourable dietary changes found in the present study, the study participants’ habitual intake of key foods and nutrients may have contributed to the lack of changes in IHD risk factors. Our study may have suffered from the so-called healthy participant effect, which suggests that the lower the risk factor levels, the less can the risk factors be reduced by interventions(Reference Estruch and Ros45). We tried to mitigate this effect by including participants with at least one risk factor for IHD.
We found the most important dietary changes in the intake of whole grains, fish and SFA in both dietary guideline groups. However, the participants’ median baseline/habitual intake of whole grains and fish was already relatively high, nearly reaching the recommended 75 g/10 MJ per d and 50 g/10 MJ per d, respectively(5). By comparison, the mean baseline intake of whole grains in other studies(Reference Jenkins, Boucher and Ashbury41,Reference Reidlinger, Darzi and Hall42,Reference Estruch, Ros and Salas-Salvadó44) was 1·0–1·5 servings/d (one serving is approximately 30 g) or approximately 30–45 g/d (whole grain intake was not presented in the Uusitupa et al.’s study(Reference Uusitupa, Hermansen and Savolainen43)). An earlier meta-analysis including dose–response analysis of whole grain intake and CVD mortality found that each 28 g/d of whole grain intake was associated with a 14 % lower risk of CVD mortality in the lower range of whole grain intake whereas in the upper range of the whole grain intake the effect was non-linear(Reference Zhang, Zhao and Guo46). Our findings that the habitual whole grain intake was high (median of 61 g/10 MJ per d; 95 % CI 31–11) support that an increased intake of whole grain above the habitual intake may not have further beneficial metabolic effects on the IHD risk factors.
Conversely, study participants in the present study had a median baseline intake of meat and meat products (prepared weight) that was higher (139 g/10 MJ per d) than the recommended maximum of 70 g/10 MJ per d(Reference Tetens, Andersen and Astrup6) and a lower intake of fruit and vegetables (388 g/10 MJ per d) than the recommended 600 g/10 MJ per d(Reference Tetens, Andersen and Astrup6). No significant differences in changes for meat or fruit and vegetable intake were observed in the present study, suggesting that these food groups may be particularly difficult to change in the present setting.
In the present study, a higher adherence to the DG, especially with an additional reduction in meat intake and higher intake of fruit and vegetables, may have led to a change in IHD risk factors and had the intensity of the intervention been higher. Although too small to have a beneficial effect on IHD risk factors, the dietary changes found in both the SUB DG and OFF DG groups nearly all constituted improvements, compared with the HAB.
The results of the above-mentioned dietary interventions reveal the many challenges related to imposing dietary changes, which may influence the disease course of IHD. Therefore, addressing the intensity of the intervention – in the case of SUB or OFF DG supporting written DG with individualised councelling with a dietitian, with further recipes, cooking classes, peer-involving activities – or other modifiable risk factors, such as smoking or physical activity, may be other plausible contributions to the prevention of IHD. Several RCT have been conducted with the purpose of primary prevention of CVD through investigating multiple behavioural risk factors such as smoking cessation, healthy food choices and increased physical activity(Reference Ebrahim, Taylor and Ward47–Reference Karmali, Persell and Perel50). However, these multiple risk factor interventions that use counselling and education appear to have only a small effect on CVD risk factors and appear to have no effect on CVD events in the general population(Reference Ebrahim, Taylor and Ward47,Reference Alageel, Gulliford and McDermott48,Reference Karmali, Persell and Perel50) . Our approach of using SUB DG as a dietary message strategy in an intervention study has not been reported previously.
Strengths and limitations
The strengths of this study is that it was conducted in a real-life setting where participants were free living and empowered to modify their dietary pattern, thus making the application of the results more straight forward. Another strength is the design where we together with the SUB DG included the OFF DG and a control group. A further strength of this study is the availability of detailed dietary intake data collected using a web-based 7-d dietary record(Reference Pedersen, Christensen and Matthiessen18,Reference Biltoft-Jensen, Matthiessen and Rasmussen22) that was validated against an objective biomarker of whole grain intake. Also, a sub-analysis excluding under- and over-reporters was applied, making it possible to exclude potential information bias of under- and over-reporting in the self-reported dietary data.
Even though the present study was designed and conducted to fulfil the criteria for a RCT to the highest possible degree, the study still has some limitations. The study design made it impossible to blind participants, which may have affected the motivation within the HAB group as the HAB group was free to search information elsewhere and had access to the Danish OFF DG via official homepages and other channels. It is a limitation that dietary assessments were conducted only at three timepoints, each 6 months apart and that no other objective biomarkers compliance with of dietary intake was included apart from AR. Even though the dropout was relatively low (Fig. 1), it is a limitation that the participant number vary across the ourcome measures. It could also be considered a limitation that the DG did not include a message on salt reduction and that no direct compliance measures of understanding the DG or measures of use of the recipes were collected. Finally, the present study includes multiple primary endpoints which may lead to an increased risk of both type I and II errors.
Conclusion
In conclusion, the SUB DG had a greater impact on the extent of dietary change in a more cardioprotective direction relative to HAB than OFF DG at the end of the 6 months intervention whereas the extent of dietary changes relative to HAB diet were similar for the SUB and OFF DG groups at the follow-up at month 12. However, neither the SUB DG nor the OFF DG resulted in any overall effects on the selected intermediate risk factors for IHD.
Acknowledgements
The authors would like to thank research assistant Lise Schiff, research assistant Mia Lausten and project coordinator Majken Ege for assisting with study materials, coordination and data collecting; Senior adviser Tue Christensen for processing the dietary data. A special thanks to the staff at the study site at Gentofte Hospital, Denmark, for good collaboration during the data collection periods. Thanks to all the study participants for participating in the DIPI randomised controlled trial.
This work is part of the project Diet and Prevention of Ischemic Heart Disease – a Translational Approach study (DIPI), which is supported by the Danish Council for Strategic Research (contract 0603-00488B). The Danish Council for Strategic Research had no role in the design, analysis or writing of this article.
The authors contributions are as follows: J. L. G., K. O. and I. T. formulated the research question; J. L. G., C. H. and I. T. contributed to the study design; J. L. G. performed the statistical analyses under supervision of E. W. A. All authors were involved in the interpretation of the data and critical revision of the manuscript; J. L. G. drafted the manuscript and all authors approved the final version.
The authors declare that there are no conflicts of interest.


