


Adolescence is a critical phase of human development marked by the adoption of its own lifestyle behaviours with high probability to persist into adulthood(Reference Hayes, Dowd and MacDonncha1,Reference Movassagh, Baxter-Jones and Kontulainen2) . Adequate lifestyle behaviours are known to be major determinants of health(Reference Manz, Mensink and Finger3). Evidence has shown that an unhealthy eating behaviour(Reference Stok, Renner and Allan4) (EB) may be associated with several cardiometabolic risks among adolescents(Reference Cunha, Costa and de Oliveira5). High level of physical activity (PA) (regardless of the dietary pattern) is associated with better physical, psychological and cognitive health among children and adolescents(Reference Poitras, Gray and Borghese6) and low PA and a predominantly sedentary lifestyle with deleterious health effects(Reference Janssen and Leblanc7,Reference Carson, Hunter and Kuzik8) . The multiple PA health benefits reflect a recent holistic definition of this behaviour which is not restricted to physiological level and integrated other components (e.g. psychological, cognitive, social)(Reference Piggin9). In addition to genetic predisposition, EB, PA and sedentary time (ST) are important determinants of obesity among adolescents(Reference Leech, McNaughton and Timperio10) and evidence suggests the possible synergetic effect of these behaviours on health outcome(Reference Kim, Barreira and Kang11). All of the above highlight the importance of healthy lifestyle behaviours during adolescence to lay foundations for health in later life(Reference Sawyer, Afifi and Bearinger12).
However, most studies on EB, PA and ST show that adolescents do not achieve lifestyle behaviour guidelines(Reference Leech, McNaughton and Timperio10,Reference Al-Hazzaa, Abahussain and Al-Sobayel13,14) . The recent Étude de SanTé sur l’Environnement, la Biosurveillance, l’Activité physique et la Nutrition (Esteban) study showed that only 13 % of French children and adolescents aged 6–17 years ate more than five fruits and vegetables per d and had excessive consumption of salt and sugary drinks. Also, 51 % of boys and 33 % of girls achieved WHO PA guidelines(14). Moreover, the proportion of young people spending 2 h or more in front of a screen daily reached 70 % among 11–14-year-olds and 71 and 87 % among 15–17-year-old girls and boys, respectively.
The literature reports multiple associations between EB, PA and ST, which suggests an interdependence among these behaviours(Reference Gillis, Tomkinson and Olds15). For example, a recent German study reported high levels of PA associated with a healthy diet among boys and girls(Reference Manz, Mensink and Finger3). Moreover, in a systematic review, the most common profile reported in thirteen studies on PA and ST was ‘high PA and low ST’ and ‘low PA and high ST’(Reference Parker, Salmon and Costigan16). Lifestyle behaviours present complex groupings requiring simultaneous consideration to define homogeneous profiles to give a more integrated approach and fairly relevant clinical significance(Reference Pérez-Rodrigo, Gil and González-Gross17,Reference Ottevaere, Huybrechts and Benser18) . However, researchers mostly studied EB, PA and ST separately(Reference Hanson, Munthali and Micklesfield19,Reference Okely, Lubans and Morgan20) as shown in a recent systematic review where only one-third investigates all of them(Reference Parker, Salmon and Costigan16). Moreover, most of the studies that take into account EB, PA and ST among adolescents are often cross-sectional(Reference Parker, Salmon and Costigan16). For example, Ottevaere et al. reported five lifestyle behaviour profiles in their cross-sectional study of 2084 European adolescents(Reference Ottevaere, Huybrechts and Benser18). Such studies could not allow for investigating the complexity of combined EB, PA and ST changes over time and identifying adolescents more or less at risk of unfavourable lifestyle behaviour changes, which are important insights for health promotion. The few longitudinal studies that take into account lifestyle behaviours together frequently included children whose lifestyle behaviour is modulated by their parents or had small samples with poor statistic power(Reference Jago, Salway and Lawlor21,Reference Leech, McNaughton and Timperio22) . Therefore, the goal of the present study was to (1) identify cross-sectional lifestyle behaviour profiles and their 2-year longitudinal changes among French school-age adolescents and to (2) identify factors associated with these profiles and changes.
Methods
The PRomotion de l’ALImentation et de l’Activité Physique trial
The PRomotion de l’ALImentation et de l’Activité Physique (PRALIMAP) school-based trial was a 2-year stratified 2 × 2 × 2 factorial cluster randomised controlled trial which included adolescents from 14 to 18 years old(Reference Briançon, Bonsergent and Agrinier23). This trial aimed to assess the effectiveness of three health promotion strategies (educational; screening and care; and environmental) applied singly or in combination over a 2-year period in preventing and reducing overweight and obesity by promoting healthy EB, PA and ST among adolescents in twenty-four state high schools in Lorraine (northeastern France) between 2006 and 2009. The ‘environmental’ strategy consisted of improving EB and PA offerings in high schools; the ‘educational’ strategy consisted of nutritional lessons and working groups and the ‘screening and care’ strategy consisted of detecting overweight or obesity and eating disorders among adolescents and proposing, if necessary, an adapted care management programme of seven educational sessions. Every academic year, an information letter was given to parents by high schools. If parents did not want data about their children to be collected, they could inform high schools through a letter in which they indicated their refusal. Adolescents were also given written and oral information and had the right not to participate. The main result was that of the three strategies implemented in the trial, the screening and care strategy may be an effective way to prevent and reduce overweight and obesity among adolescents and was not the focus of the present study(Reference Bonsergent, Agrinier and Thilly24). The PRALIMAP trial was approved by the French consultative committee for treatment of information in health research (no. 06.376), the French data protection authority (no. 906312) and is registered at ClinicalTrials.gov (NCT00814554). Totally, 5354 adolescents were included in the PRALIMAP trial.
Study sample
This study was a secondary analysis of data from the PRALIMAP trial. From the initial PRALIMAP sample (n 5354), adolescents without complete data on EB, PA and ST at T0 (baseline) and T2 (2 years) were excluded. A total of 2390 had complete data and constituted our study sample (online Supplementary Fig. S1).
Measurements
Lifestyle behaviours: eating behaviour
EB was measured with the specifically designed Boire Manger Bouger FFQ developed by the local school office of the Nancy-Metz academy(Reference Briançon, Bonsergent and Agrinier23,25) . This questionnaire measures the frequency of meals on a day (breakfast, lunch, dinner, snacks) and their composition (fruits and vegetables, dairy products, meats, eggs and fishes, starchy foods, drinks, sugar products, salty and fatty foods) during the past week. It allows measuring the daily number of different food groups’ portions ingested by the adolescents.
Lifestyle behaviours: physical activity and sedentary time
PA and ST were measured using the short version of the International Physical Activity Questionnaire. The International Physical Activity Questionnaire is a valid and reliable questionnaire that assesses the frequency (d/week) and duration (min) of sitting, walking, and moderate and vigorous PA during the previous 7 d(Reference Craig, Marshall and Sjöström26).
Variables related to EB were dichotomised (low and high intake) using French public health plan guidelines (PNNS 2006–2010)(27). Those guidelines were based on international bodies recommendations and scientific expertise. High intake referred to adolescents who nibbled, ate more than five fruits and vegetables/d, ate starchy foods more than 3/d, ate sugar products more than 4/d, ate dairy products more than 4/d and ate salty and fatty foods more than 1/d. The duration of each PA intensity (i.e. walking, moderate or vigorous) and ST were dichotomised (low and high). High walking, moderate or vigorous PA was considered adolescents practised at least 1-h/d of walking, moderate or vigorous PA. High ST referred to adolescents spent more than two consecutive hours in a sitting position per d.
Associated factors
Sociodemographic characteristics were age at entry in grade 10, sex, area of residence, type of high school and socio-economic status (SES). SES was measured by using the student social position index (Indice de Position Sociale des Elèves (IPSE)). IPSE summarises the student’s family characteristics (parents’ diploma, income, cultural practices, housing conditions, etc.) and was designed by the French Ministry of Education. IPSE is derived from both parents’ occupation, and each student is assigned an IPSE ranging from 40 (low SES) to 179 (high SES)(Reference Rocher28). Then, the IPSE was re-scaled from 1 to 10 and classified in five SES categories (1–2: highly less advantaged, 3–4: less advantaged, 5–6: intermediate, 7–8: advantaged and 9–10: highly advantaged)(Reference Manneville, Omorou and Legrand29).
Weight status was defined as prevalence of overweight or obesity according to the International Obesity Taskforce (IOTF) age- and sex-specifıc cut-off values (yes/no)(Reference Cole, Bellizzi and Flegal30).
Intervention strategies were screening and care, educational and environmental strategies.
Statistical analyses
Descriptive analyses
Study sample and non-completers were compared by Student’s t test for continuous variables and the χ 2 test for categorical variables. Quantitative variables are expressed as mean values and standard deviations and qualitative variables as numbers and percentages.
Identification of lifestyle behaviour profiles at T0 and their changes from T0 to T2
Lifestyle behaviour profiles at T0 and their changes from T0 to T2 were identified by using latent transition analysis. Latent transition analysis allows for identifying homogeneous unobserved subgroups (latent status) in a heterogeneous population and their changes(Reference Lanza, Bray and Collins31) by using an incremental number of latent status process. The optimal number of latent status selection is based on maximisation of statistical and parsimony criteria (Akaike information criteria and Bayesian information criteria), and interpretability of latent statuses. This model determines latent status membership probabilities at T0 and T2; transition probability between two latent statuses at T0 and T2 and item-response probabilities conditional to latent status membership at T0 and T2. Lifestyle behaviour profiles changes were classified into three groups according to EB, PA and ST changes: ‘unfavourable’, ‘favourable’ and ‘mixed’.
Measurement invariance is a condition to interpret latent transition analysis and aims to ensure that lifestyle behaviour profiles have the same meaning at T0 and T2 and that changes result from lifestyle behaviour changes and not measurement variations across time(Reference Lanza, Bray and Collins31). Measurement invariance is tested by comparing a model with item-response probability freely estimated across time (T0 and T2) to a model in which these probabilities were constrained to be equal across time by using a difference G 2 test. The more parsimonious model (higher degrees of freedom, lower Akaike information criteria and Bayesian information criteria) should be opt for.
Identification of factors associated with lifestyle behaviour profiles at T0 and their changes
Factors associated with lifestyle behaviour profiles at T0 and their changes from T0 to T2 were identified using univariable (one factor) and multivariable (all factors) multinomial logistic regression models. Factors consisted of sex, age at entry in grade 10, SES, weight status and PRALIMAP intervention strategies. OR and 95 % CI were estimated.
Data were analysed by using SAS 9.4 (SAS Institute). Two-sided P < 0·05 was considered statistically significant.
Results
Sample characteristics
As compared with non-completers, study sample had more girls, classical or advanced placement at school (≤15 years old in grade 10) and socially advantaged SES (Table 1). Adolescents in the study sample had higher intake of fruits and vegetables, starchy food, dairy products and lower intake of salty and fatty foods and exhibited less nibbling than non-completers (Table 2).
Table 1. Comparison of baseline characteristics between the study sample and non-completers
(Numbers and percentages; mean values and standard deviations)
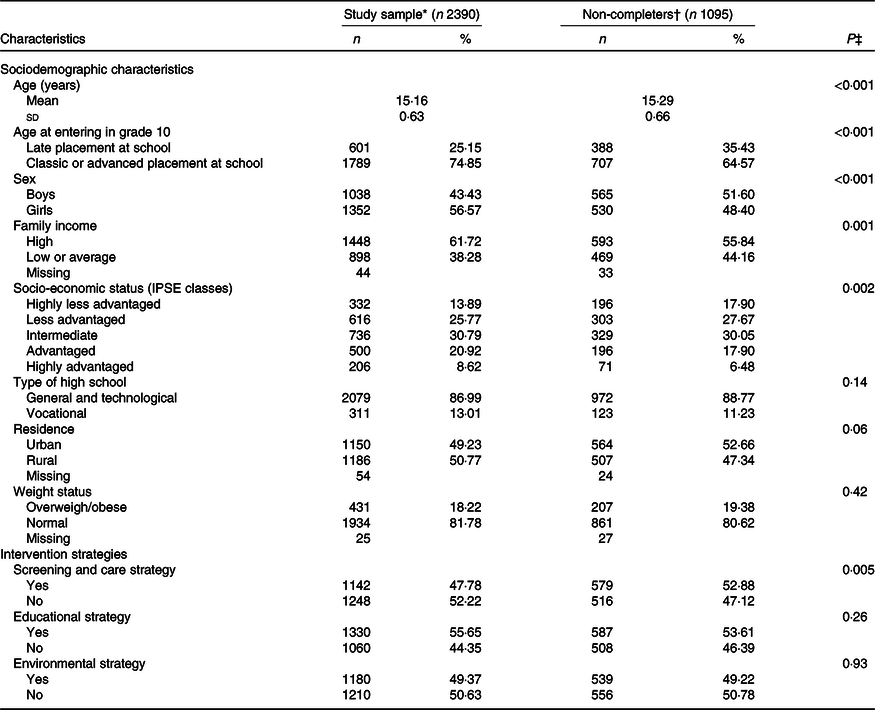
IPSE, Indice de Position Sociale des Elève; IPAQ, International Physical Activity Questionnaire; BMB, Questionnaire Boire Manger Bouger.
* Adolescents with complete data on BMB and IPAQ at T0 (baseline) and complete BMB and IPAQ at T2 (2 years).
† Adolescents with complete data on BMB and IPAQ at T0 and no data on BMB and IPAQ at T2.
‡ P value of χ 2 test (for categorical variables) and Student’s t test (for continuous variables) comparing characteristics of study sample and non-completers.
Table 2. Comparison of baseline lifestyle behaviours between the study sample and non-completers
(Numbers and percentages)
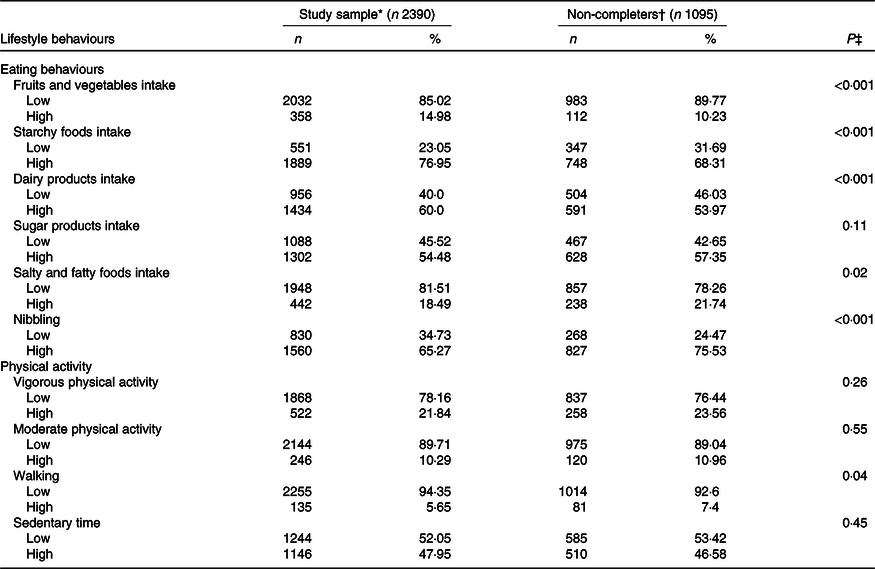
IPAQ, International Physical Activity Questionnaire; BMB, Questionnaire Boire Manger Bouger.
* Adolescents with complete data on BMB and IPAQ at T0 (baseline) and complete BMB and IPAQ at T2 (2 years).
† Adolescents with complete data on BMB and IPAQ at T0 and no data on BMB and IPAQ at T2.
‡ P value of χ 2 test comparing eating behaviours, physical activity and sedentary behaviours of study sample and non-completers.
Identification of lifestyle behaviour profiles at T0 and their changes from T0 to T2
On the basis of statistical and interpretability criteria, a model with five latent statuses was fitted (online Supplementary Table S1). The five lifestyle behaviour profiles did not differ on ST and were as follows (online Supplementary Fig. S2):
Profile 1, ‘Healthy diet and high PA (n 188, 7·9 %)’: adolescents of this profile had a high probability of fruits and vegetables intake (24·3 %), low probability of sugar products (32·1 %) and fatty and salty foods (6·9 %) intakes and the lowest nibbling probability (35·2 %). They were also characterised by a high level of vigorous (83·6 %) and moderate (25·9 %) PA.
Profile 2, ‘Big eater and moderate to high PA (n 570, 23·8 %)’: adolescents in this profile had the highest intake probabilities of all food groups: fruits and vegetables (26·4 %), starchy foods (95·9 %), dairy products (94·5 %), sugar products (97·7 %), fatty and salty products (49·6 %) and high nibbling probability (88·1 %). Adolescents in this profile manifested moderate to vigorous PA.
Profile 3, ‘Healthy diet and low PA (n 745, 31·2 %)’: characterised by low probability of sugar products (35·9 %), fatty and salty foods (7·7 %) intakes and nibbling (45·5 %). They had also the lowest probabilities of vigorous (0·02 %) and moderate (3·7 %) PA.
Profile 4, ‘Restrictive diet and moderate PA (n 493, 20·6 %)’: the profile of lowest probabilities of fruits and vegetables (1·8 %), starchy foods (31·2 %), dairy products (19·9 %), fatty and salty foods (0·6 %) intakes associated with moderate PA.
Profile 5, ‘Sugar products, nibbling and moderate PA (n 394, 16·5 %)’: adolescents were sugar products consumers (90·4 %), nibblers (94·1 %) with moderate PA.
The online Supplementary Table S2 showed that the model with measurement invariance was preferable because more parsimonious than the one with measurement variance signifying lifestyle behaviour profiles had the same meaning at T0 and T2, and allowing the interpretation of lifestyle behaviour profiles changes from T0 to T2.
At both times, profile 3 was the greatest with 31·2 % of adolescents at T0 and 31·3 % at T2 (Table 3 and Fig. 1). In contrast, profile 1 was the smallest with 7·9 % at T0 and 10·8 % at T2. Overall, adolescents remained mostly in the same profile from T0 to T2 (range: 61–78·8 %). Adolescents did not change from profile 5 to profile 1 and very few from profile 1 to profile 5 (1·4 %). Larger changes were observed from profile 4 to profiles 2 (14·5 %) and 3 (12·2 %), from profile 5 to profile 4 (16·3 %) and from profile 2 to profile 3 (13·6 %). Changes were as follows: ‘Mixed’ (n 905, 37·87 %), ‘Favourable’ (n 671, 28·07 %) and ‘Unfavourable’ (n 814, 34·06 %).
Table 3. Prevalence of lifestyle behaviour profiles and their changes from T0 (baseline) to T2 (2 years) (Percentages)

T0, entering in grade 10; T1, entering in grade 12; Profile 1, ‘Healthy diet and high PA’; Profile 2, ‘Big eater and moderate to high PA’; Profile 3, ‘Healthy diet and low PA’; Profile 4, ‘Restrictive diet and moderate PA’, Profile 5, ‘Sugar products, nibbling and moderate PA’.
* Transition probabilities correspond to memberships in the same lifestyle behaviour profiles at both times.

Fig. 1. Changes between lifestyle behaviour profiles from T0 (baseline) to T2 (2 years). PA, physical activity.
Identification of lifestyle behaviour profiles and changes associated factors
Table 4 provides factors associated with lifestyle behaviour profiles at T0. As compared with profile 3:
Boys were more likely to be in profile 1 or 2 than girls;
Old adolescents were about two times more likely to be in profiles 5, 2 or 4 than young adolescents;
The likelihood of being in other profiles increased with decreasing SES, especially for profiles 2, 4 and 5 and
Overweight or obese adolescents were half as profile 2 or 5 than normal-weight ones.
Table 4. Factors associated with lifestyle behaviour profiles at T0 (baseline): multivariable analyses†
(Odds ratios and 95 % confidence intervals)

PA, physical activity; Ref., reference.
* P < 0·05.
† For all analyses, inactive group was the reference group.
‡ Socio-economic status (Indice de Position Sociale des Elèves classes) used as a discrete variable.
Results in Table 5 show that as compared with girls, for boys, odds were higher for ‘favourable’ and most importantly ‘unfavourable’ changes (OR 1·85; 95 % CI 1·5, 2·3) than ‘mixed’ changes. Similar results were observed among older than younger adolescents (OR 1·77; 95 % CI 1·4, 2·2) and among highly less advantaged adolescents than highly advantaged ones (OR 2·35; 95 % CI 1·5, 3·6). Adolescents with overweight or obesity were less likely to exhibit ‘unfavourable’ than ‘mixed’ changes (OR 0·46; 95 % CI 0·3, 0·6). There was no evidence of associations between the three health promotion strategies and lifestyle behaviour profiles changes.
Table 5. Factors associated with lifestyle behaviour profiles changes using multinomial logistic regression model: multivariable analyses
(Odds ratios and 95 % confidence intervals)

Ref., reference; EB eating behaviour; PA, physical activity.
* P < 0·05.
† Adolescents with improvement in EB and PA, or improvement in PA and no change in EB, or reciprocally from T0 to T2.
‡ Adolescents with improvement in EB and deterioration in PA from T0 to T2, or reciprocally.
§ Adolescents with deterioration in EB and PA, or deterioration in PA and no change in EB, or reciprocally from T0 to T2.
|| Socio-economic status (Indice de Position Sociale des Elèves classes) used as a discrete variable.
Univariable results of factors associated with lifestyle behaviour profiles and their changes are presented in online Supplementary Tables S3 and S4.
Discussion
This 2-year prospective study highlighted five lifestyle behaviour profiles among school-age adolescents in France. Profile 1 (with some characteristics indicative of a healthy profile: healthy diet and high PA) was half as sizable as profile 5 (with some characteristics indicative of an unhealthy profile) and reported in previous studies(Reference Manz, Mensink and Finger3,Reference Parker, Salmon and Costigan16) . The review of Elders et al. showed that more active individuals are motivated to eat healthier than are less active individuals, confirming interdependence between EB and PA(Reference Elder and Roberts32). Profile 2 was characterised by favourable EB and unfavourable PA, and the opposite for profile 3. These profiles are reported elsewhere(Reference Ottevaere, Huybrechts and Benser18) and could be explained by the fact that some people try to compensate, consciously or unconsciously via the complex neurological pathway of energy homoeostasis, an unfavourable behaviour by showing favourable habits for another dimension(Reference Horvath, Diano and Tschöp33).
The lifestyle behaviour profiles we identified differed mainly in terms of EB, PA in a lesser extent, but not ST and highlighted the importance of CA in public health intervention among adolescents. The absence of ST differences between profiles may be due to the fact that sitting time during weekdays consisted mainly of coerced behaviour among school-age adolescents (i.e. sitting at school). Thus, ST could be homogeneous among adolescents. European and Brazilian studies showed discrepant results by identifying profiles with different ST levels(Reference Ottevaere, Huybrechts and Benser18,Reference Matias, Silva and Silva34) . The distinction of ST during weekdays and weekend days in those studies (only weekdays ST in our study) and country differences could explain the discrepancy.
Lifestyle behaviour profiles differed by sex, weight status, age and SES. First, girls were more ‘healthy diet and low PA’ than ‘healthy diet and high PA’ or ‘big eater and moderate to high PA’, meaning that they had a more balanced diet but lower PA level than boys. This agrees with the literature(14,Reference Ottevaere, Huybrechts and Benser18) . The French Esteban study reported that as compared with boys, adolescent girls were more physically inactive, with a downward trend in PA with age mainly affecting girls(14). In the HELENA study, boys were highly represented in the cluster with high levels of moderate to vigorous PA and low-quality diet, whereas clusters with low levels of moderate to vigorous PA and high-quality diet contained more girls(Reference Ottevaere, Huybrechts and Benser18). Second, adolescents with overweight or obesity were more represented in profiles characterised by healthy diet and low PA (profile 1) than in those characterised by unhealthy diet and/or moderate/high PA (profiles 2 and 5). It could suggest that (1) adolescents spontaneously changed their EB before the intervention (i.e. reverse causality) and were actively trying to lose weight by adopting a healthy diet(Reference Leech, McNaughton and Timperio10) and (2) adolescents with overweight or obesity underreported their food intake (information bias), specifically sugar products and nibbling, and possibly reported their lifestyle behaviours according to what is socially desired to avoid stigmatisation. Third, young adolescents presumed healthier diet, than older ones which agrees with most studies in which profiles characterised by unhealthy dietary patterns seemed to consistently feature predominantly older adolescents(Reference Leech, McNaughton and Timperio10). Finally, having a ‘healthy diet and low PA’ v. another profile increased with SES and suggests expected healthier EB but unexpected lower PA with increasing SES(Reference Ottevaere, Huybrechts and Benser18,Reference Stalsberg and Pedersen35) . Ottevaere et al. reported that adolescents with higher-educated parents were more likely to be in healthy profile and healthy eating, low PA and low ST profile than other adolescents. The authors considered that SES is rather an indicator of affluence rather than knowledge and cognitive performance, which is correlated more with lifestyle behaviours(Reference Leech, McNaughton and Timperio10,Reference Ottevaere, Huybrechts and Benser18) .
The sizes of lifestyle behaviour profiles were similar at the beginning and the end of intervention, and adolescents remained mostly in the same lifestyle behaviour profile during the intervention (61–78·8 %), possibly due to no environment (i.e. school) change, and were consistent with results of the Esteban study not showing a significant change in food consumption and PA among adolescents(14). However, a notable proportion of adolescents moved between lifestyle behaviour profiles, few of which concerned changed towards profile 1. It suggests adolescents continued to carry health favourable and unfavourable lifestyle behaviours, which is expected for this population. Larger ‘unfavourable’ changes among boys, older and less advantaged adolescents are in line with the literature. First, Béghin et al. showed a significant decrease in PA among adolescent boys with no difference among girls(Reference Béghin, Vanhelst and Drumez36). Askovic et al. (Reference Askovic and Kirchengast37) reported that sex differences in EB intensified from early to late adolescence. These sex differences are explained by sex-specific energetic demands and culture typical beauty ideals(Reference Askovic and Kirchengast37). Second, in their meta-analysis, Winpenny et al. evidenced a decrease in PA and diet quality from late adolescence to early adulthood, suggesting that higher ‘unfavourable’ changes among older than younger adolescents could reflect an increase in freedom and obesogenic behaviours(Reference Winpenny, Smith and Penney38). Third, on one hand, a recent systematic review evidenced a higher probability of low SES adolescents to follow an inactive rather active trajectory(Reference Lounassalo, Salin and Kankaanpää39), and on the other hand, Winpenny et al. showed a positive association between leaving education and sugar-sweetened beverages intake(Reference Winpenny, van Sluijs and White40). This could be embedded in a life-course approach, in which low SES adolescents accumulate barriers to healthy behaviours such as EB and PA and translate into its deterioration through life. Moreover, higher ‘unfavourable’ changes among low than high SES adolescents could ultimately increase existing social inequalities in EB and PA(Reference Elgar, Pförtner and Moor41). Finally, our hypotheses of reverse causality and information bias are supported by the fact that adolescents with overweight or obesity exhibit less unfavourable changes.
There was no evidence of associations between the three PRALIMAP health promotion strategies and lifestyle behaviour changes. This result does not mean that PRALIMAP strategies were ineffective to change lifestyle behaviours (absence of evidence is not evidence of absence). Indeed, the high number of lifestyle behaviour profile changes (n 25, Table 3) and the low number of adolescents in most of these changes did not allow for showing significant PRALIMAP strategies effects (lack of power). That is why profile changes were clustered as ‘favourable’, ‘unfavourable’ and ‘mixed’ but their high heterogeneity made clustering difficult and could explain our results. In addition, there was a tendency of adolescents with overweight or obesity who benefited from the screening and care strategy to exhibit more favourable lifestyle behaviour changes than those who did not benefit from it (data not shown). This tendency was less clear among adolescents without overweight or obesity and could suggest that the screening and care strategy effect was attenuated in our results. It would have been interesting to investigate this hypothesis, but the small numbers of most lifestyle behaviour changes did not allow it (lack of power).
This study has some limitations. First, EB, PA and ST were measured by self-reporting questionnaires, which can imply social desirability bias or memory bias. Nonetheless, questionnaires are frequently used to assess lifestyle behaviours, and the International Physical Activity Questionnaire is reliable and valid(Reference Craig, Marshall and Sjöström26). Moreover, the Boire Manger Bouger questionnaire is a FFQ designed by a school office and is composed of items similar to the existing validated questionnaires(Reference Vereecken, Covents and Sichert-Hellert42,Reference Kolodziejczyk, Merchant and Norman43) . Second, to be more illustrative of sedentary behaviour, it would be interesting to investigate ST contexts (e.g. television viewing, playing with computer or console games, uses of the Internet for non-study reasons and use of Internet for study, and studying/homework) but such data were not assessed in the present study. Third, there was a high number of non-completers, but the study sample size remained substantial. In addition, characteristics of non-completers were less favourable than adolescents of the study sample and could induce a selection bias that must be kept in mind before generalising results.
Despite these limitations, our study has several strengths including the latent transition analysis method which compared with cluster analysis uses greater reliable statistical criteria to identify lifestyle behaviour profiles(Reference Beets and Foley44). The large sample (2390 participants) of the present study and its longitudinal design that allowed exploring lifestyle behaviour changes over time are additional strengths.
Conclusion
This study identified five lifestyle behaviour profiles relatively stable over 2 years, with about two times more adolescents in the least than in the most favourable one. Profiles differed mainly in terms of EB, PA in a lesser extent but not ST, highlighting the EB importance during adolescence. Associations of adolescents’ sociodemographic and weight characteristics with lifestyle behaviour profiles and their changes suggest a consideration of those characteristics in interventions aimed at acting on adolescents’ behaviours.
Acknowledgements
In the name of the PRALIMAP trial group, the authors thank all those who, through their various roles, led to the implementation of this project. The PRALIMAP Trial Group: N. Agrinier, N. Angel, R. Ancellin, E. Aptel, F. Bailly, L. Barthelemy, D. Bezaz, E. Bonsergent, S. Briançon, J. F. Collin, R. De Lavenne, E. Dietz, P. Enrietto, E. Favre, M. Gentieu, E. Gouault, M. Helfenstein, S. Hercberg, F. Kurtz, J. Langlois, P. Laure, E. Lecomte, K. Legrand, E. Lecomte, J. Lighezzolo, P. Marx, A. Y. Omorou, A. Osbery, M. O. Piquee, P. Renaudin, G. Robert, A. Schichtel, S. Tessier, A. Vuillemin, E. Villemin and M. Wuillaume.
This research did not receive any specific funding from agencies/institutions in the public, commercial or not-for-profit sectors.
M. D. contributed to designing the study, carrying out the study, analysing the data, interpreting the findings and writing the article. F. M. and A. Y. O. contributed to formulating the research question, designing the study, interpreting the findings and writing the article. J. L., K. L., E. L. and S. B. contributed to interpreting the findings and proofreading the article.
The authors declare that there are no conflicts of interest.
Supplementary material
For supplementary materials referred to in this article, please visit https://doi.org/10.1017/S0007114520004316


