


In contrast to people in Western countries, people from South Asian countries (Indian sub-continents) were reported to develop metabolic diseases such as diabetes at a younger age and at a lower BMI(Reference Yoon, Lee and Kim1). The prevalence of type 2 diabetes is extremely high and continues to rise in both native and migrant South Asians(Reference Gujral, Pradeepa and Weber2). South Asian Indians also have earlier onset, more severe and more prevalent CVD than many other ethnic groups(Reference Gadgil, Anderson and Kandula3).
Previous epidemiological studies(Reference Gadgil, Anderson and Kandula3, Reference Garduno-Diaz and Khokhar4) reported a direct correlation between a Western dietary pattern, but not with eastern (vegetarian) and mixed dietary pattern, and overall risk of the metabolic syndrome in migrant South Asians in the UK(Reference Garduno-Diaz and Khokhar4) and in the USA(Reference Gadgil, Anderson and Kandula3). It has been suggested that gene–environment interaction may be the cause of the rapid increase of the prevalence of diabetes and CVD in South Asians(Reference Ramachandran, Ma and Snehalatha5). A number of comparative studies supported this hypothesis, as South Asians were found to have a higher body fat % for the same BMI as compared with Caucasians(Reference Forouhi, Jenkinson and Thomas6–Reference Rush, Freitas and Plank9). The unfavourable body composition may contribute to the susceptibility of South Asians to the negative effect of the current lifestyle in Asia and Western countries, where consumption of high-fat foods increases and physical activity decreases. Alternatively, the inability of South Asians to cope with an obesogenic environment may initiate the development of an unfavourable body composition and obesity-associated metabolic diseases.
In Caucasian populations, a large inter individual variation was reported in the susceptibility to weight gain under similar external influences such as decreased physical activity or excessive energy intake(Reference Tappy10, Reference Joosen and Westerterp11) suggesting genetic predisposition(Reference Marrades, Gonzalez-Muniesa and Arteta12). In response to changes in energy intake, either energy restriction or overfeeding(Reference Franck, Gummesson and Jernas13), alterations in body weight were found to be preceded by changes in adipocyte gene expression involved in lipogenesis, protein synthesis, β-oxidation and insulin resistance. In South Asians, reduced oxidative capacity and capacity for fatty acid (FA) utilisation at the whole body level (measured as VO2 max and fat oxidation during sub-maximal exercise) were reported to be associated with insulin resistance but were not the consequences of reduced skeletal muscle expression of oxidative and lipid metabolism genes(Reference Hall, Moran and Milne14). In that study, South Asians exhibited significantly higher skeletal muscle gene expression of carnitine palmitoyl-transferase 1α (CPT1a) and fatty acid synthase and significantly lower skeletal muscle protein expression of phosphoinositide 3-kinase (PI3K) and protein kinase B (PKB) Ser473 phosphorylation compared with Caucasians(Reference Hall, Moran and Milne14). Little is known about the molecular adaptation in the adipose tissue when South Asians are exposed to an obesogenic environment that favours fat storage rather than oxidation.
In the present study, we introduced a 3-d stay under sedentary conditions in a respiration chamber while overfeeding young South Asian and Caucasian men with a high-fat diet. To avoid potential confounders, South Asians and Caucasians were matched for body fat percentage. The objectives of the present study were (1) to investigate the molecular adaptation focusing on proteins involved in FA metabolism in the adipose tissue in response to overfeeding with a high-fat diet (OHFD) and (2) to test whether the molecular adaptations differ between South Asians and Caucasians.
For that purpose, seven proteins involved in FA metabolism were selected and measured in adipose tissue by Western blotting. Those proteins represent different processes of FA metabolism(Reference Bouwman, Wang and van Baak15): lipoprotein lipase (LPL) and fatty acid binding protein (FABP4) are responsible for FA uptake and transport inside the adipocyte, respectively; adipose TAG lipase (ATGL) and perilipin A and B (PLINA and PLINB) are responsible for FA release (lipolysis) and fat droplet turnover, respectively; short-chain 3-hydroxyacyl-CoA dehydrogenase (HADH) and CPT1a are crucial enzymes for mitochondrial β-oxidation.
Subjects and methods
Subjects
Subjects were ten healthy adult non-diabetic South Asian and ten Caucasian men. They were matched for body fat percentage. Subject characteristics are presented in Table 1. Asian subjects had four grandparents from South Asia, while Caucasian subjects were European Caucasians. Subjects were selected based on the following inclusion criteria: healthy, not having metabolic diseases (diabetes or CVD), not using medication, aged between 20 and 40 years old with BMI (in kg/m2) between 18 and 29 for South Asians and 22 and 33 for Caucasians, having a stable body weight for the last 3 months, not being on a diet and not being an athlete. All subjects received verbal and written information before giving their consent. The study was conducted according to the guidelines laid down in the Declaration of Helsinki. All procedures involving human subjects were approved by The Medical Ethics Committee of Maastricht University, MEC no. 10-3-013 and registered in the public trial registry www.ccmo.nl no. NL31217.068.10.
Table 1. Subjects’ characteristics
(Mean values, standard deviations and ranges)
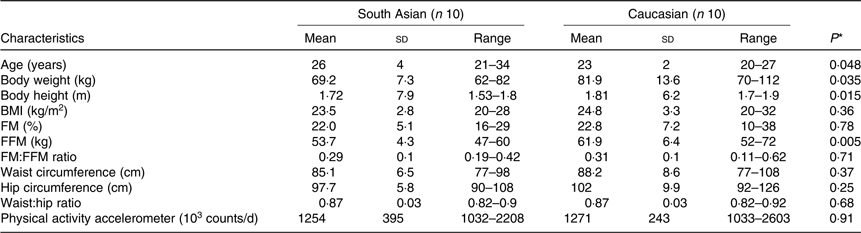
FM, fat mass; FFM, fat-free mass.
* Differences between groups in normally distributed data and non-normally distributed data were assessed using the independent-samples t test and the non-parametric Mann–Whitney U test, respectively.
Experimental design
The study was a diet-intervention study under sedentary conditions in a respiration chamber. Body composition was measured before the start of the intervention to match body fat percentage between the two ethnic groups. Energy requirements for a weight-maintenance diet for 3 d preceding the intervention were calculated based on fat-free mass (FFM) and the daily physical activity level (PAL) of each subject as measured for 7 consecutive days with an accelerometer. On the third day of the weight-maintenance diet, subjects came to the university in the morning in the fasting state; abdominal subcutaneous fat biopsies were taken for baseline measurement. On the same day, after having dinner, subjects entered the respiration chamber and stayed for the next 3 d. During this period, subjects were overfed with a high-fat diet while no exercise or strenuous physical activity was allowed in the respiration chamber. The second fat biopsies were taken in the morning after the subjects left the chamber.
Body composition
Body composition was determined according to a three-compartment model based on body weight, body volume and total body water. Body weight and body volume were determined in the morning, in a fasted state. Body volume was determined by hydro-densitometry with simultaneous measurement of residual lung volume using the helium dilution technique. Total body water was determined with 2H dilution according to the Maastricht protocol(Reference Westerterp, Wouters and van Marken Lichtenbelt16). Body composition was calculated from body density and total body water using the equation of Siri(Reference Siri17).
Daily physical activity level
The daily PAL was measured using a Direct Life triaxial accelerometer for movement registration (Tracmor-D, Philips NewWellness Solutions; http://www.directlife.philips.com). The device is a small (3·2 × 3·2 × 0·5 cm), light-weight (12·5 g) instrument. The accelerometer was attached to the lower back by means of an elastic belt. It registered accelerations minute by minute, in the mediolateral (x-axis), longitudinal (y-axis) and anterioposterior (z-axis) direction of the trunk as described elsewhere(Reference Bonomi, Plasqui and Goris18).
Subjects were instructed to wear the accelerometer for 7 consecutive days, during waking hours except during water activities. Subjects were advised to maintain their habitual PAL during the diet intervention. Accelerometer output was expressed as activity counts per minute. The activity counts per minute were summed over the entire monitoring period and divided by the number of monitoring days to determine the average counts per d.
Daily PAL was calculated based on the activity counts per d with the formula, PAL = 1·354 + 256 × 10−9 × counts/d(Reference Bonomi, Plasqui and Goris18). Total energy expenditure (TEE) was calculated with the formula of Bonomi et al., TEE accelerometer (MJ/d) = 0·04 + 0·17 FFM (kg) + 1·67 × 10−6 × counts/d(Reference Bonomi, Plasqui and Goris18), where counts/d are activity counts from the accelerometer.
Energy intake
The weight-maintenance diet to be consumed at home for 3 d before the intervention was calculated on the basis of TEE as shown above. The energy contribution of macronutrients of the weight-maintenance diet prior to the baseline measurement was 30 % fat, 55 % carbohydrate and 15 % protein.
A written instruction was given to prepare the weight-maintenance diet at home. During the weight-maintenance diet, subjects were provided with the diet in an excess amount than TEE and were allowed to eat more or less from the prescribed diet according to what they needed (ad libitum). Any additional intake from those prescribed foods was recorded. All unfinished foods were collected and returned to the university to calculate actual energy intake as described previously(Reference Wulan, Westerterp and Plasqui19, Reference Wulan, Westerterp and Plasqui20).
The OHFD was given with 50 % excess energy above the TEE of the weight-maintenance diet(Reference Joosen, Bakker and Zorenc21). The energy contribution of macronutrients of the high-fat diet was 60 % from fat, 25 % from carbohydrate and 15 % from protein(Reference Schrauwen-Hinderling, Kooi and Hesselink22, Reference Schrauwen, van Marken Lichtenbelt and Saris23). FA composition of the diet was 40 % SFA and 60 % unsaturated FA.
During overfeeding, subjects stayed in the respiration chamber. They were asked to eat all the foods prepared, but on failing to do so, the leftovers were weighed. The diet consisted of normal ready-to-eat foods combining a typical Western and Asian diet. Foods were selected by reviewing the ingredients content to ensure there was no (or only a minimal) effect of certain ingredients on fat oxidation (such as spices). During overfeeding, the subjects were also provided with decaffeinated coffee and fruit tea, as caffeine-containing coffee and tea have also been reported to increase fat oxidation. Alcohol was not allowed to be consumed in the respiration chamber. Meal time was adjusted as follows: breakfast (at 08.00 hours), morning snacks (at 10.30 hours), lunch (at 12.30 hours), afternoon snacks (at 15.30 hours), dinner (at 18.30 hours) and evening snacks (at 20.00 hours). At 21.00 hours, the remaining foods from the last meal (if any) were collected.
Fat biopsies and Western blot analysis
Abdominal subcutaneous adipose tissue biopsies (approximately 1·5 g) were obtained by needle liposuction under local anaesthesia (2 % lidocaine, Fresenius Kabi BV) after an overnight fast, at 08.00 hours in the morning before and after OHFD. The fat tissues were rinsed in sterile cold saline, frozen in liquid N2 and stored at −80°C until protein isolation.
About 200 mg frozen fat tissue was grinded in a mortar. The powder was dissolved in 200 µl of 8 M urea, 2 % (w/v) CHAPS (3-[(3-cholamidopropyl)dimethylammonio]-1-propanesulfonate), 65 mM dithiothreitol per 100 mg biopsy. The homogenate was vortexed for 5 min and centrifuged at 14000 rpm and at 10°C for 30 min. The supernatant containing the adipose tissue proteome was carefully collected and aliquots were stored at −80°C. Protein concentrations were determined by a Biorad Bradford-based protein assay(Reference Bradford24).
Samples with an equal amount of protein were run on a 12 % denaturing polyacrylamide gel (180 V, Criterion Cell; Bio-Rad). After electrophoresis, proteins were transferred (90 min, 100 V, Criterion blotter; Bio-Rad) to 0·45-mm nitrocellulose membranes. After Ponceau S staining and destaining, membranes were blocked for 1 h in 5 % non-fat dry milk powder (NFDM; Bio-Rad) in Tris-buffered saline containing 0·1 % Tween 20 (TBST) or 5 % bovine serum albumin (BSA)-TBST depending on the primary antibody. Thereafter, the blots were incubated, respectively, with antibodies against LPL (1:1000 dilution, Santa Cruz sc-58780), FABP4 (1:1000 dilution, Cayman 10004944), ATGL (1:1000 dilution, Cell Signaling 2138), PLIN 1 A/B (1:5000 dilution, ProGen GP33), HADH (1:500 dilution, Santa Cruz sc-74650) in 5 % NFDM-TBST overnight at 4°C on a shaker. For CPT1a (1:500 dilution, Abgent AP2524b) blots were incubated with the primary antibody in 5 % BSA-TBST overnight at 4°C on a shaker. Thereafter, the blots were washed three times for 10 min in TBST, and then incubated with 1:10 000 dilution of horseradish peroxidase-conjugated secondary antibody (DAKO) in 5 % BSA-TBST or 5 % NFDM-TBST for 1 h. The blots were washed three times for 10 min in TBST. A CCD (charge-coupled device) camera (XRS-system, Bio-Rad) was used to detect immunoreactive bands using chemiluminescent substrate (SuperSignal CL; Pierce). The quantification was performed with the program Quantity One version 4.6.5 (Bio-Rad). Blots were normalised to β-actin (1:1000 dilution, Santa Cruz sc-47778) to correct for differences in protein loading and between runs.
Statistical analysis
Data of subject characteristics and macronutrient intake were first tested for normal distribution by using the Kolmogorov–Smirnov and Shapiro–Wilk normality tests. When normality was met, statistical comparison was assessed using the independent-samples t test. Non-normally distributed data were compared using the non-parametric Mann–Whitney U test. Repeated-measures ANOVA was used to assess differences in protein-relative abundance before and after OHFD within groups (the effect of diet), between the groups (the effect of ethnicity) and the interaction between diet and ethnicity by including body fat percentage as a covariate. Spearman’s rho correlation was applied to assess the correlation between changes in proteins. Spearman’s rho correlation was also used to assess the correlation between baseline protein levels and adiposity measures. The SPSS statistic program version 16 (SPSS) was used for statistical analysis, and statistical significance was set as P < 0·05.
Results
Subject characteristics
South Asian subjects were Indian (n 7), Pakistani (n 1) and Nepali (n 2). White subjects were Dutch (n 2), German (n 1), Irish (n 1), Italians (n 2), British (n 1), Portuguese (n 1) and Polish (n 2). South Asians were measured within 3 years (n 2) and within 1 year (n 8) of their stay in The Netherlands. Subjects’ characteristics are presented in Table 1. Subjects were matched for body fat percentage individually. As a group, average body fat percentage did not differ between ethnicities (P = 0·78), South Asians (22·0 (sd 5·1) %) and Caucasians (22·8 (sd 7·2) %). Although absolute FFM was significantly higher in Caucasians (P = 0·005), the fat mass (FM):FFM ratio did not differ between groups (P = 0·71).
Waist circumference as a proxy of subcutaneous abdominal fat volume did not differ between ethnicities (P = 0·37) with the range in South Asians being 77–98 cm and 77–108 cm in Caucasians.
Energy intake and macronutrient composition during the dietary intervention
Caucasians had a higher energy need due to a higher FFM, hence the energy intake was higher than South Asians. During the weight-maintenance period, the actual energy intake was 11·5 (sd 1·0) MJ/d for South Asians and 12·2 (sd 2·1) MJ/d (P = 0·39) for Caucasians, where the energy contribution of the macronutrients was: fat, 29·3 (sd 0·8) % and 28·8 (sd 1·1) % (P = 0·13); carbohydrate, 55·2 (sd 1·1) % and 56·0 (sd1·5) % (P = 0·21); protein, 15·5 (sd 0·5) % and 15·4 (sd 0·6) % (P = 0·70), respectively.
During the period of OHFD under sedentary conditions, South Asians and Caucasians consumed 150 (sd 13) % and 161 (sd 27) % (P = 0·28) of weight-maintenance requirements, respectively, resulting in a positive energy balance of 8·0 (sd 1·2) MJ/d in South Asians and 8·5 (sd 1·7) MJ/d in Caucasians (P = 0·32). The macronutrient composition was 59·4 (sd 0·6) % and 59·0 (sd 0·6) % fat (P = 0·21), 26·3 (sd 0·8) % and 26·4 (sd 0·7) % carbohydrate (P = 0·77) and 14·3 (sd 0·3) % and 14·5 (sd 0·4) % protein (P = 0·14) for South Asians and Caucasians, respectively. The energy intake, energy balance and macronutrient composition information is provided in the supplementary material.
The relative abundance and the change of the proteins responsible in fat metabolism
The change in relative abundance of proteins before and after OHFD was analysed by correcting body fat percentage (Table 2). This was done because of a wide range in body fat percentage in each group, that is from lean to obese. In line with Table 2, a schematic figure to describe the different processes regulated by the proteins involved in fat metabolism is shown in Fig. 1. An example of Western blots of perilipin is also presented in Fig. 2.
Table 2. Relative abundance and the change of proteins responsible in fat metabolism
(Mean values and standard deviations, South Asians n 10, Caucasians n 10)
OHFD, overfeeding with a high-fat diet; FA, fatty acids; HADH, short-chain 3-hydroxyacyl-CoA dehydrogenase; CPT1a, carnitine palmitoyl-transferase 1α; ATGL, adipose TAG lipase; PLINA, perilipin A; PLINB, perilipin B; FABP4, fatty acid binding protein; LPL, lipoprotein lipase.
* P < 0·05 for the effect of diet.
† P < 0·05 for the effect of ethnicity.
‡ P < 0·05 for interaction (diet × body fat).
§ Repeated-measures ANOVA was used to assess differences in the changes in proteins relative abundance within the groups (effect of diet*) and between the groups (effect of ethnicity†) by including body fat as a covariate (correcting for differences in body fat) and the interaction between diet and ethnicity (P diet × ethnicity), as well as the interaction between diet and body fat.
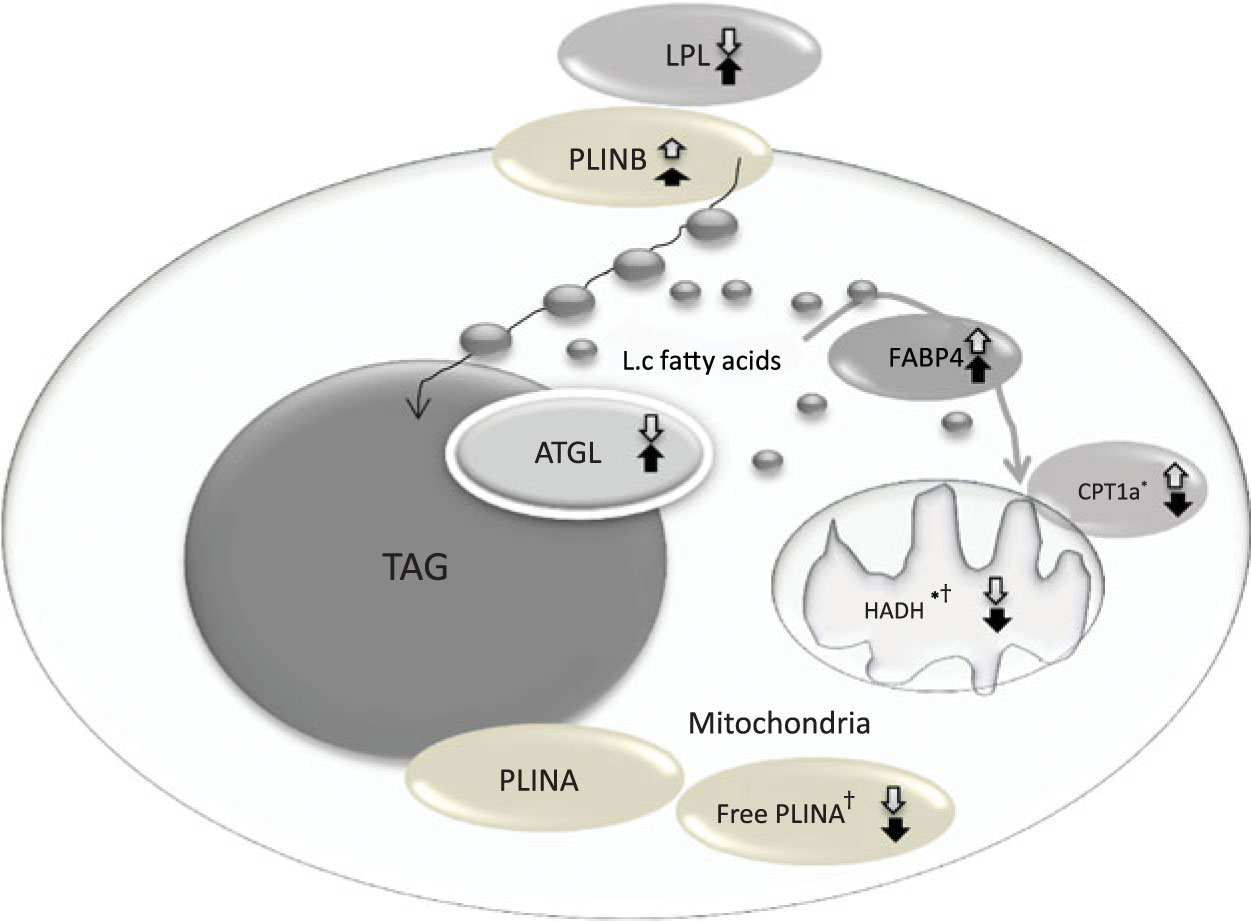
Fig. 1. Coordinated regulation of different process in fat metabolism in the fat cell. Black arrow, South Asians; white arrow, Caucasians; up arrow, up-regulation; down arrow, down-regulation. LPL, lipoprotein lipase; PLINB, perilipin B; L.c, long-chain; FABP4, fatty acid binding protein; ATGL, adipose TAG lipase; CPT1a, carnitine palmitoyl-transferase 1α; HADH, short-chain 3-hydroxyacyl-CoA dehydrogenase; PLINA, perilipin A. * P < 0·05 for the effect of diet. † P < 0·05 for the effect of ethnicity.
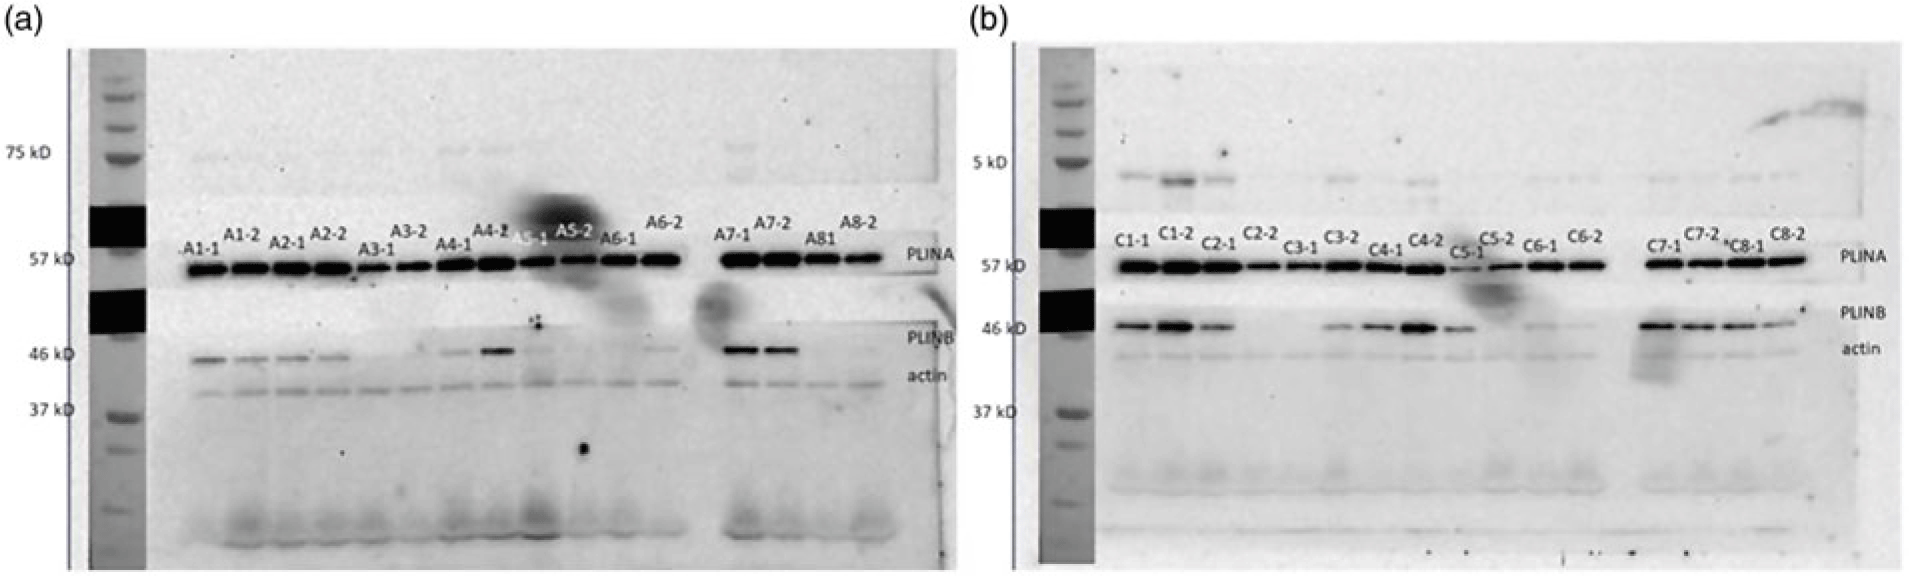
Fig. 2. Example of Western blots of perilipin. (a) A: Asian (b) C: Caucasian, 1: before overfeeding with a high-fat diet (OHFD), 2: after OHFD. A1-1: Asian subject no. 1 before OHFD; C1-2: Caucasian subject no. 1 after OHFD.
Mitochondrial β-oxidation
The relative abundance of HADH was significantly decreased (P < 0·05) in both South Asians and Caucasians as a response to OHFD. The decrease was greater (P < 0·05) in Caucasians than in South Asians; however, HADH level at baseline and after overfeeding was relatively higher in Caucasians than in South Asians.
The protein CPT1a located in the mitochondrial membrane decreased significantly with diet in South Asians (P < 0·05), whereas in Caucasians, CPT1a increased with diet (P < 0·05). There was an interaction between diet and body fat percentage (P < 0·05).
Fatty acids release and storage
Protein involved in lipolysis, ATGL, did not change significantly with diet, although there was an indication to be up-regulated in South Asians and down-regulated in Caucasians. Proteins responsible for lipid droplet turnover, PLINA and PLINB, did not change with diet, although there was an indication for PLINA to be down-regulated and PLINB to be up-regulated in both ethnic groups (not statistically significant). The decrease in PLINA differed between ethnicities; it was greater in Caucasians (P < 0·05). However, PLINA level at baseline and after the intervention was relatively higher in South Asians.
Fatty acids uptake and handling
FABP4 and LPL did not change with diet and did not differ between ethnicities. There was a trend for FABP4, involved in FA handling within adipocytes, to be up-regulated in both groups (NS). LPL, involved in FA uptake appeared to be up-regulated in South Asians and down-regulated in Caucasians but did not reach statistical significance.
Correlation between protein changes
The correlation between protein changes indicates a coordinated regulation of the proteins in fat metabolism as shown in Table 3. Changes in CPT1a were negatively correlated with changes in PLINB (P < 0·05) in South Asians and in the combined group, whereas changes in HADH were positively correlated with changes in PLINA in South Asians (P < 0·05), Caucasians (P < 0·05) and the combined group (P < 0·01). Changes in HADH were positively correlated with changes in LPL in the combined group (P < 0·05) and with changes in marker of FA handling FABP4 in South Asians (P < 0·05).
Table 3. Spearman’s rho correlation coefficients of the changes in protein levels with each other (South Asians n 10, Caucasians n 10)
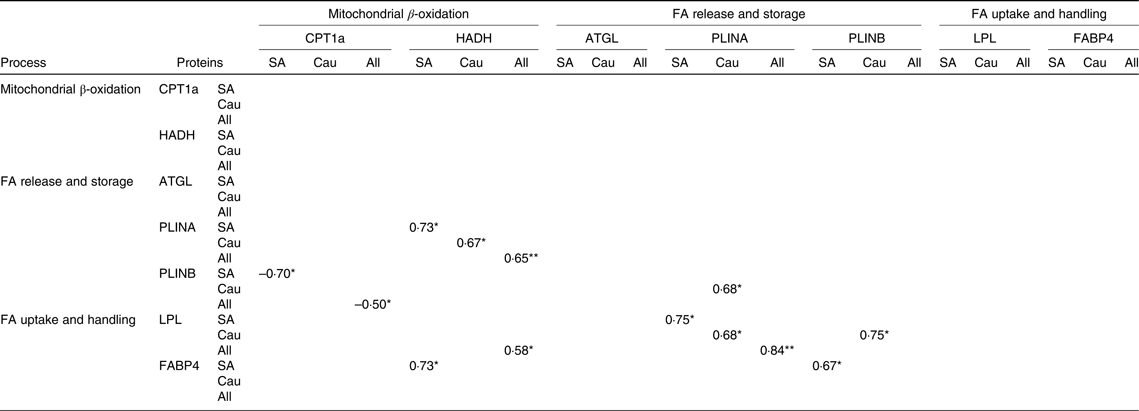
FA, fatty acids; CPT1a, carnitine palmitoyl-transferase 1α; HADH, short-chain 3-hydroxyacyl-CoA dehydrogenase; ATGL, adipose TAG lipase; PLINA, perilipin A; PLINB, perilipin B; LPL, lipoprotein lipase; FABP4, fatty acid binding protein; SA, South Asian; Cau, Caucasian.
* P < 0·05, ** P < 0·01
In Caucasians, changes in PLINA were positively correlated with changes in PLINB (P < 0·05). In addition, changes in PLINA were positively correlated with changes in LPL in South Asians (P < 0·05), Caucasians (P < 0·05) and the combined group (P < 0·01). Changes in PLINB were also shown to be positively correlated with changes in LPL in Caucasians (P < 0·05), whereas in South Asians, PLINB was positively correlated with changes in FABP4 (P < 0·05).
Correlation between baseline proteins and adiposity measures
Correlations between proteins at baseline with adiposity measures were only found in Caucasians (Table 4). In this regard, baseline HADH was negatively correlated (P < 0·05) with BMI, body fat percentage, absolute FM, FM index, FM:FFM ratio, waist circumference and hip circumference. Baseline ATGL was negatively correlated (P < 0·05) with all adiposity measures mentioned above except with hip circumference, whereas baseline FABP was negatively correlated (P < 0·05) with absolute FM.
Table 4. Spearman’s rho correlation coefficients between baseline proteins and adiposity measures (South Asians n 10, Caucasians n 10)
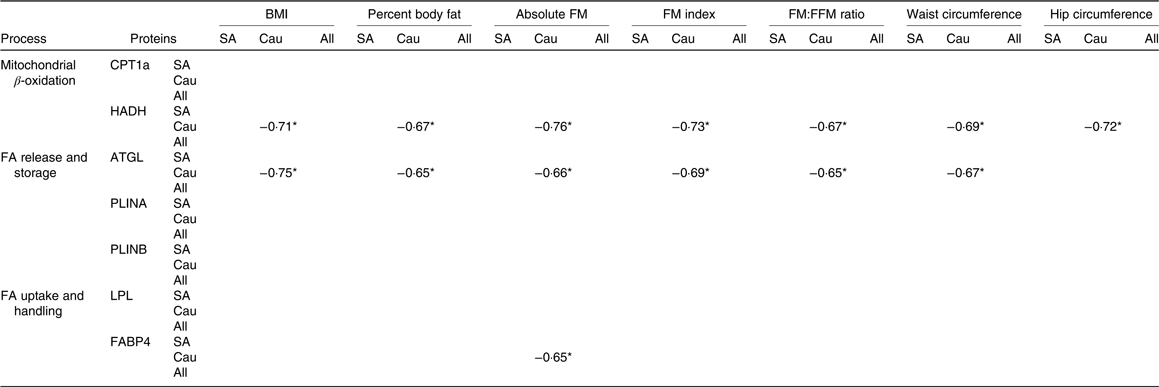
FM, fat mass; FFM, fat-free mass; SA, South Asian; Cau, Caucasian; CPT1a, carnitine palmitoyl-transferase 1α; HADH, short-chain 3-hydroxyacyl-CoA dehydrogenase; FA, fatty acids; ATGL, adipose TAG lipase; PLINA, perilipin A; PLINB, perilipin B; LPL, lipoprotein lipase; FABP4, fatty acid binding protein.
* P < 0·05.
Discussion
Our study demonstrated that the response to OHFD varied largely between individuals among both South Asian men and Caucasian men. In addition, proteins involved in mitochondrial β-oxidation changed significantly with diet. HADH level was decreased in both ethnicities, whereas CPT1a was decreased in South Asians and increased in Caucasians. The decrease in HADH was greater in Caucasians; however, the HADH level at baseline and after intervention was relatively higher in Caucasians. PLINA did not change with diet, although there was an indication towards a decrease and the decrease differed between ethnicities. The level of PLINA at baseline and after intervention was relatively higher in South Asians. Other proteins were unaffected by diet, and no ethnic difference was found.
The large variation in protein abundance at baseline as well as in the response to overfeeding may be a consequence of the large variation of subject’s body fat percentage in each group. Therefore, to assess the changes in protein abundance, we corrected for body fat percentage.
A crucial enzyme for mitochondrial β-oxidation involved in the rate-limiting acyl-CoA dehydrogenase step(Reference Kler, Jackson and Bartlett25), HADH, significantly decreased in both groups. OHFD for 3 d under sedentary condition in a respiration chamber led to a massively positive energy balance in both groups. In this state, glycogen stores in the body are maintained(Reference Flatt26) and glucose is oxidised to match carbohydrate intake(Reference Flatt27). On the other hand, fat is oxidised to a lesser extent to meet energy requirement. This was supported by our data from a similar study as presented here(Reference Wulan, Schrauwen-Hinderling and Westerterp28) that an extended meal consumption due to overfeeding prolonged the postprandial state and prolonged high insulin levels, which in turn favours fat storage rather than oxidation. Previous studies by us(Reference Wulan, Westerterp and Plasqui20) and others(Reference Brons, Jensen and Storgaard29, Reference Samocha-Bonet, Campbell and Mori30) have shown higher insulin levels as a response to overfeeding. Moreover, Schmidt et al. (Reference Schmidt, Kealey and Horton31) reported a decrease in postabsorptive 24-h fat oxidation following 3 d of overfeeding in obesity-resistant subjects but not changed in obesity-prone subjects (presumably due to a higher NEFA level from the enlarged FM). Therefore, a decrease in HADH level as a crucial enzyme in mitochondrial β-oxidation was as expected. Studies on energy restriction showed the opposite effect in HADH response, where there was an increase after the intervention(Reference Bouwman, Wang and van Baak15, Reference Verhoef, Camps and Bouwman32). Interestingly, although the decrease in HADH was greater in Caucasians, this ethnic group had a relatively higher HADH level at baseline and while decreasing, the HADH level remained relatively higher after the intervention as compared with that in South Asians. This may have implication in the long-term fat metabolism and energy balance maintenance in these ethnicities.
CPT1a, a protein in the mitochondrial membrane, catalyses the conversion of cytoplasmic long-chain fatty acyl-CoA to acylcarnitine, which then enters the mitochondria(Reference Bouwman, Wang and van Baak15). It changed significantly with diet, decreasing in South Asians, but increasing in Caucasians. This enzyme is a rate-limiting enzyme for mitochondrial FA uptake, suggesting that Caucasians may have a higher ability for mitochondrial FA uptake.
The ATGL abundance was unaffected by overfeeding. Although there was an indication towards a 2-fold increase of ATGL in South Asians, whereas about 50 % decrease in Caucasians, it did not reach statistical significance. ATGL performs the initial step of TAG hydrolysis, releasing FA and producing diacyl glycerol; diacyl glycerol is hydrolysed by hormone-sensitive lipase (HSL) resulting a second FA and monoacyl glycerol, which is subsequently hydrolysed by monoacyl glycerol lipase generating glycerol and a final FA. The FA promotes utilisation within the adipocytes or release into the circulation(Reference Ahmadian, Duncan and Sul33). It has been suggested that HSL is the major rate-limiting enzyme in human lipolysis that regulates both basal (fed state) and stimulated lipolysis, whereas ATGL plays a role in the regulation of basal lipolysis(Reference Ryden, Jocken and van Harmelen34). The anti-lipolytic effect of insulin during the postprandial (fed) state is mediated primarily through phosphorylation or activation of phosphodiesterase 3B which decreases cAMP; subsequently, protein kinase A(Reference Pieper, Redman and Racette35) activity is inhibited, causing reduced HSL phosphorylation; accordingly, the HSL translocation from cytosol to the lipid droplet is inhibited and lipolysis is decreased(Reference Ahmadian, Duncan and Sul33). Thus, high insulin levels during overfeeding may have a direct impact on HSL activity as a major rate-limiting enzyme rather than on ATGL.
PLINA is the most abundant protein associated with lipid droplets(Reference Brasaemle, Subramanian and Garcia36) and in the mouse is able to maintain numerous and tightly clustered lipid droplets(Reference Brasaemle, Rubin and Harten37). PLINA increases TAG storage by decreasing the rate of basal and stimulated lipolysis(Reference Brasaemle, Subramanian and Garcia36, Reference Brasaemle, Rubin and Harten37). The action of PLINA, like the action of HSL, is maintained under tight hormonal regulation. Catecholamines initiate the activation of cAMP-dependent protein kinase(Reference Pieper, Redman and Racette35) causing increased PLINA phosphorylation translocating PLINA away from the lipid droplets to the cytosol. This facilitates accessibility of the degrading enzyme HSL to the lipid droplets(Reference Brasaemle, Subramanian and Garcia36). Under high insulin levels, where cAMP-dependent PKA is inhibited, PLINA is not phosphorylated and remains bound to lipid droplets. In the present study we observed a decrease in PLINA in both groups although not significant. Of note, the technique that we used (extracting protein from fat tissue) may limit the observation to unbound PLINA only. Thus, a decrease in unbound PLINA (less phosphorylated PLINA) may indirectly reflect more bound PLINA protecting lipid droplets from lipolysis during overfeeding. An opposite effect is shown in the energy-restriction study, where PLINA increases(Reference Bouwman, Wang and van Baak15). In the present study, the decrease of PLINA was greater in Caucasians; in addition, PLINA at baseline and after intervention was relatively higher in South Asians. The relatively higher PLINA levels in South Asians that play an important role in the turnover of stored TAG may influence the long-term energy utilisation in this population.
Another perilipin isoform, PLINB, did not change with diet. There was an increase in both ethnicities but not statistically significant. Insulin was reported to stimulate the accumulation of PLINB at the plasma membrane to protect newly synthesised TAG as a product of reesterification of exogenous FA(Reference Aboulaich, Vener and Stralfors38). Others suggested increased PLINB was associated with the formation of small lipid droplets(Reference Bouwman, Wang and van Baak15). In Caucasians, PLINB showed a positive correlation with PLINA and LPL, suggesting coordinated regulation between FA uptake, the formation of small lipid droplets, and of the larger lipid droplets. In South Asians and the combined group, PLINB showed a negative correlation with CPT1a.
The process of FA uptake by adipocytes occurs in two stages, hydrolysis of circulating TAG by LPL bound to the capillary endothelium, followed by tissue uptake of the resultant FA(Reference Evans, Burdge and Wootton39). Surprisingly, LPL did not change with overfeeding. Although there was an indication towards an increase in South Asians and a decrease in Caucasians, it did not reach statistical significance. Our explanation is that as previously reported in a tracer study(Reference Evans, Burdge and Wootton39), entrapment of FA in adipose tissue during the postprandial period varies markedly with time. After the meal, TAG extraction increases reflecting an increased LPL activity. Entrapment of FA (tracers) is approximately 100 % at 60 min and falls during the 6-h postprandial period to approximately 10–30 % at 360 min suggesting a highly regulated process. The up-regulation of FA entrapment in adipose tissue follows a time course similar to that of the increase in insulin concentration(Reference Evans, Burdge and Wootton39). Thus, it seems that time course of observation for LPL activity (or content) may be important, as LPL is higher at the postprandial period and lower at the postabsorptive period when the fat biopsy samples were taken. In our study, the last meal (evening snacks) was given at 20.00 hours and fat biopsy samples were taken at 08.00 hours in the morning in fasting condition both before and after OHFD. Presumably, the LPL activity (or content) has decreased due to a decrease in substrate (TAG) load during the postabsorptive period. Hence, a small difference in LPL levels before and after overfeeding might not be detected.
Despite unaffected LPL level by the diet, LPL consistently showed a significant positive correlation with PLINA in South Asians and Caucasians, and the correlation became stronger in the combined groups. This suggests a coordinated regulation between FA uptake and storage. In Caucasians, LPL also showed a significant positive correlation with PLINB, indicating an increased protection of newly synthesised TAG or small fat droplets made from exogenous FA (re-esterification)(Reference Bouwman, Wang and van Baak15).
We did correlation analysis between baseline protein expression and adiposity measures. Interestingly, significant correlations between some proteins and indexes of adiposity were found in Caucasians but not in South Asians. HADH showed a significant negative correlation with adiposity measures such as BMI, body fat percentage, absolute FM, FM index, FM:FFM ratio, waist circumference and hip circumference. This is in line with a study by Marrades et al. (Reference Marrades, Gonzalez-Muniesa and Arteta12) showing that several transcripts encoding key enzymes in the β-oxidation cycle including sc-HADH were down-regulated in obese subjects as compared with lean subjects when consuming a high-fat diet. In addition, a protein responsible for lipolysis (ATGL) showed a negative correlation with all adiposity indexes mentioned above, except with hip circumference. Bouwman et al. (Reference Bouwman, Wang and van Baak15) reported an up-regulated ATGL protein upon weight loss (after energy restriction) and reduced body FM, thus supporting this finding. In contrast, Mairal et al. (Reference Mairal, Langin and Arner40) found that the ATGL mRNA levels were unaffected by obesity and weight reduction.
A limitation of the present study was the small sample size and perhaps the wide range in body fat percentage due to difficulty in finding subjects for a labour-intensive study. Thus, future comparative proteomic studies between South Asians and Caucasians may have to observe subjects with matched body fat percentage, but preferably with a more homogenous (within a narrow range of) body fat percentage; that is a study on lean South Asians and Caucasians or a study on overweight South Asians and Caucasians. In addition, analysing FA profiles of adipose tissue in both ethnicities before and after OHFD may be useful to understand the adaptation occurs in adipose tissue.
In summary, we observed a significant decrease in HADH as a crucial enzyme in mitochondrial β-oxidation in South Asians and Caucasians as a response to OHFD. Although the decrease was larger in Caucasians, this group had a relatively higher HADH level at baseline and remained higher after decreasing as compared with South Asians. CPT1a decreased in South Asians but increased in Caucasians in response to a high-fat overfeeding. On the other hand, South Asians had a relatively higher PLINA level. The differences in HADH and PLINA levels as well as in the response of CPT1a between ethnicities may be important for the long-term regulation of energy (fat) metabolism in these populations.
Acknowledgements
We gratefully thank Gabby Hul, Sanne Verhoef and Stefan Camps for the assistance when performing fat biopsy. Also, we deeply appreciate and thank all subjects who participated in the study.
S. N. W. was supported by a fellowship from The Directorate General of Higher Education, The Ministry of Education and Culture of The Republic of Indonesia (former Ministry of Research Technology and Higher Education of The Republic of Indonesia).
The authors’ responsibilities were as follows – S. N. W. conducted the research, performed the data analysis, and wrote the manuscript; F. G. B. together with SNW did the proteomic analysis and quantification; E. C. M. M. interpreted the proteomic data and reviewed the manuscript; K. R. W. and G. P. designed the study and reviewed the manuscript.
None of the authors had a conflict of interest.
Supplementary material
For supplementary material/s referred to in this article, please visit https://doi.org/10.1017/S0007114519001260


