


Gestational diabetes mellitus (GDM) is one of the most common metabolic complications during pregnancy, and its prevalence has continued to increase worldwide( Reference Bardenheier, Imperatore and Gilboa 1 , Reference Buckley, Harreiter and Damm 2 ). GDM is associated with short-term adverse perinatal and pregnancy outcomes such as increased risk of macrosomia, Caesarean section and neonatal hyperglycaemia( Reference Metzger and Lowe 3 ). Furthermore, mothers with GDM and their offspring are at an increased risk of developing type 2 diabetes( Reference Bellamy, Casas and Hingorani 4 – Reference Clausen, Mathiesen and Hansen 6 ). Few modifiable risk factors for GDM have been identified, with diet as an important one as it is relatively easy to modify( Reference Schoenaker, Mishra and Callaway 7 , Reference Zhang and Ning 8 ).
GDM is characterised by an impaired ability of the body to respond to increases in postprandial blood glucose( Reference Catalano, Huston and Amini 9 ). Fat and protein intake affects postprandial glucose homoeostasis indirectly by affecting insulin secretion, sensitivity or resistance( Reference Heer and Egert 10 ). However, carbohydrate is the only macronutrient that directly affects postprandial blood glucose and long-term postprandial response. Therefore, pre-pregnancy carbohydrate intake might be a significant dietary factor in the prevention of GDM. Epidemiological studies have shown that dietary fibre, glycaemic index (GI) and glycaemic load (GL) are consistently associated with the risk of type 2 diabetes( Reference Greenwood, Threapleton and Evans 11 , Reference Schulze, Liu and Rimm 12 ). However, studies on the role of pre-pregnancy carbohydrate intake in relation to GDM incidence are limited and, until now, are only performed using the Nurses’ Health Study data( Reference Bao, Bowers and Tobias 13 , Reference Zhang, Liu and Solomon 14 ).
More studies in other populations are needed to confirm the possible relation between pre-pregnancy carbohydrate intake and GDM prevention. The association of carbohydrate intake and GDM risk can be investigated by examining the relationship between total carbohydrate intake (quantity) and GDM. However, carbohydrate quality (type of carbohydrate) might be more important as different types of carbohydrates have different rates of digestion and absorption, and thus might have different effects on blood glucose levels( Reference Russell, Baka and Bjorck 15 ). Therefore, we aimed to examine the associations between pre-pregnancy dietary carbohydrate quantity and quality and GDM incidence. Carbohydrate quantity was examined by investigating total carbohydrate intake and a low-carbohydrate diet (LCD) score( Reference Bao, Bowers and Tobias 13 , Reference Halton, Willett and Liu 16 ). Carbohydrate quality was investigated by examining fibre, and total sugar intake, GI, GL and intake of carbohydrate-rich food groups.
Methods
Study design and population
The current study used data from the Australian Longitudinal Study on Women’s Health (ALSWH). ALSWH is an ongoing population-based prospective cohort study investigating the role of demographic, social, physical, psychological and behavioural factors in women’s health. Full details on study design, recruitment, methods and responses have been described elsewhere( Reference Brown, Bryson and Byles 17 , Reference Lee, Dobson and Brown 18 ). Briefly, in 1996, approximately 40 000 women across three cohorts were recruited: those born in 1973–1978 (18–23 years), 1946–1951 (45–50 years) and 1921–1926 (70–75 years). Women were randomly selected from Australia’s nationalised health-care system, Medicare, with intentional oversampling in rural and remote areas. Participants gave informed consent at each survey. The study was conducted according to the declaration of Helsinki and was approved by the Human Research Ethics Committees of the Universities of Newcastle and Queensland.
For this study, data from the young cohort of women born in 1973–1978 were used. This sample was broadly representative of Australian women of the same age at baseline( Reference Brown, Bryson and Byles 17 ). Self-administered questionnaires were sent to participants every 3–4 years. Dietary intake was first collected at Survey 3 (2003, n 9081) when women were 25–30 years and again at Survey 5 (2009, n 8200). Survey 3 was used as baseline for the current analyses. Women were excluded from the current analyses if they did not report a live birth at consecutive surveys in 2006, 2009, 2012 or 2015; had missing data on diet at Surveys 3 and 5; had missing data on GDM; reported implausible energy intake (ratio of reported energy intake and predicted energy requirement<0·56 or >1·44( Reference Huang, Roberts and Howarth 19 )); had a history of type 1 or type 2 diabetes mellitus before GDM diagnosis; had a history of GDM before baseline (Survey 3); or had missing covariate data (Fig. 1). A total of 3607 women were included in the analyses.
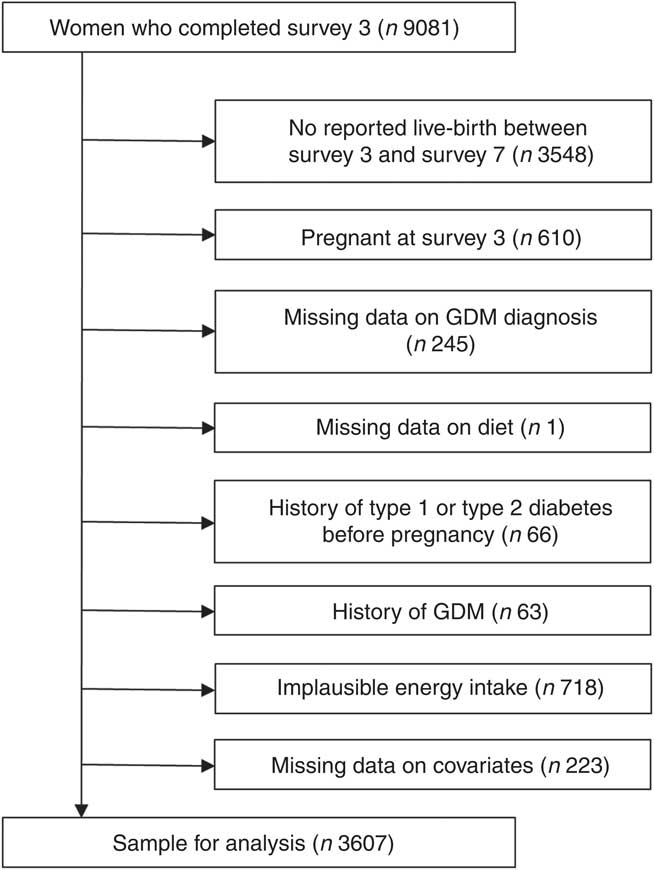
Fig. 1 Flow chart of the study population. GDM, gestational diabetes mellitus.
Dietary assessment
Diet was assessed using the Dietary Questionnaire for Epidemiological Studies (DQES) version 2. This 101-item FFQ assesses usual food and beverage intake of the previous 12 months. The development and evaluation of this FFQ has been described elsewhere( Reference Hodge, Patterson and Brown 20 , Reference Ireland, Jolley and Giles 21 ). Briefly, participants were asked to report their usual frequency of consumption of seventy-four food items and six alcoholic beverage items using a ten-point scale ranging from ‘never’ to ‘three or more times per day’. In addition, the number of servings and type of milk, bread, fat spread, cheese, sugar and eggs consumed was assessed. Portion-size photographs were used to assess the serving sizes. Added sugar intake was assessed with the question ‘On average, how many teaspoons of sugar do you usually use per day? (Include sugar taken with tea and coffee and on breakfast cereal, etc.)’. Nutrient intakes were computed using the national government food composition database of Australian foods, the NUTTAB95( Reference Lewis, Milligan and Hunt 22 ). Validation of the FFQ against 7-d food diaries of sixty-three women of reproductive age showed moderate to strong energy-adjusted correlation coefficients for a wide range of macronutrients and micronutrients (ranging from 0·28 for vitamin A to 0·78 for carbohydrates)( Reference Hodge, Patterson and Brown 20 ).
Carbohydrate quantity
Carbohydrate quantity was examined by investigating total carbohydrate intake and a LCD score( Reference Bao, Bowers and Tobias 13 , Reference Halton, Willett and Liu 16 ). Total carbohydrate intake was expressed as nutrient density (percentage of total energy intake). The LCD score is a measure of the carbohydrate content of the diet relative to fat and protein intake( Reference Halton, Willett and Liu 16 ), with a low score reflecting a diet high in carbohydrate intake and a high score reflecting a low carbohydrate intake. To avoid interference of energy, energy densities were used instead of total intake in g/d. The LCD score was calculated by dividing the study participants into eleven equal strata each of fat, protein and carbohydrate intake (E%). Women in the highest strata of fat and protein intake received 10 points for that macronutrient, women in the next strata received 9 points and so on. For carbohydrate, the scoring was reversed, and thus women in the lowest stratum received 10 points and those with the highest intake received 0 points. The points for the three macronutrients were summed to create the overall LCD score, ranging from 0 (lowest fat and protein intake and highest carbohydrate intake) to 30 (highest fat and protein intake and lowest carbohydrate intake).
Carbohydrate quality
Carbohydrate subtypes, which reflect the quality, have different rates of digestion and absorption and might therefore have a different effect on GDM. Carbohydrate quality was examined using fibre (g/d), and total sugar intake (g/d), GI, GL and intake of carbohydrate-rich food groups (g/d). Total sugar intake comprised the total intake of monosaccharides and disaccharides. The GI is a relative measure of the glycaemic impact of the carbohydrates in different foods( Reference Wolever, Jenkins and Jenkins 23 ). GI values of individual food items included in the FFQ were obtained from the 2002 International table of GI and GL values( Reference Foster-Powell, Holt and Brand-Miller 24 ), with glucose as reference food. If Australian figures were available, these were used. When there was more than one value available, GI values were averaged. For each person, GI values of the food items were multiplied by carbohydrate intake (in g) from that food item and summed to obtain a person’s GL. The average GI for each participant was calculated by dividing GL by total carbohydrate intake( Reference Foster-Powell, Holt and Brand-Miller 24 ). Alcoholic beverages were not included in the overall GI. Nine carbohydrate-rich food groups were comprised for additional analyses: white bread; high-fibre bread (high-fibre white bread, whole-meal bread, rye bread, multi-grain bread); cereal (All Bran, bran flakes, muesli, Weet-Bix, cornflakes, porridge); fruit (oranges, apples, pears, bananas, melon, pineapple, strawberries, apricots, peaches, mango, avocado, tinned fruit); fruit juice (including juices from fresh fruit and ready-to-use fruit juice); staple products (rice, pasta); added sugar; vegetables (tomato, tomato sauce, capsicum (bell or sweet peppers), lettuce, cucumber, celery, beetroot, carrots, cabbage, cauliflower, broccoli, spinach, peas, green beans, bean sprouts, pumpkin, onion, garlic, mushrooms, zucchini, potato) and a combined vegetables and fruit group.
Dietary carbohydrate (E%), fibre and total sugar intake, GI, GL and LCD score were adjusted for energy using the residual method( Reference Willett, Howe and Kushi 25 ).
Assessment of gestational diabetes mellitus
GDM was based on self-reported physician diagnosis from Survey 4 onwards for each pregnancy (including pregnancies before Survey 4) that resulted in a live birth using the following question: ‘Were you diagnosed or treated for gestational diabetes?’. Diagnostic criteria for GDM in Australia included a 1-h plasma glucose level ≥7·8 mmol/l after a 50-g glucose load (morning, non-fasting) or a 1-h plasma glucose level ≥8·0 mmol/l after a 75-g glucose load (morning, non-fasting). Diagnosis was confirmed after a 75-g oral glucose tolerance test (fasting) with a plasma glucose level at 0 h of ≥5·5 mmol/l and/or at 2 h of ≥8·0 mmol/l( Reference Hoffman, Nolan and Wilson 26 ). Diagnostic criteria were updated in 2013 with a positive test after a 75-g oral glucose tolerance test (fasting) defined as plasma glucose level at 0 h of ≥5·1 mmol/l and/or at 1 h of ≥10·0 mmol/l and/or at 2 h of ≥8·5 mmol/l( Reference Nankervis, McIntyre and Moses 27 ). A reliability study among a subgroup of women from New South Wales, Australia (n 1914), has demonstrated high agreement of 91 % between self-reported GDM diagnosis in the study and administrative data records( Reference Gresham, Forder and Chojenta 28 ).
Assessment of covariates
Information on country of birth was assessed at Survey 1. Information on highest qualification completed, number of hours paid work, marital status, parity, hypertensive disorders of pregnancy, polycystic ovary syndrome (PCOS), inter-pregnancy interval, smoking, physical activity and BMI was self-reported at Surveys 3 to 6. Maternal age at pregnancy was calculated using reported maternal date of birth and reported date of delivery. Physical activity was assessed using validated questions on frequency and duration of walking and on moderate- and vigorous-intensity activity and was categorised as sedentary/low (<600 total metabolic equivalent (MET) min/week), moderate (600 to <1200 MET min/week) or high (≥1200 MET min/week)( Reference Brown, Burton and Marshall 29 ). Pre-pregnancy BMI was categorised as underweight (BMI<18·5 kg/m2), normal weight (BMI 18·5 to<25 kg/m2), overweight (BMI 25–<30 kg/m2) or obese (BMI ≥30 kg/m2). Only a few women were classified as underweight (n 123, 3·4 %); therefore, the underweight and normal-weight groups were combined as normal weight (BMI<25 kg/m2).
Statistical analysis
Baseline characteristics reported at Survey 3 are shown according to quartiles of LCD score, our main outcome regarding carbohydrate quantity. Characteristics were compared using ANOVA or χ 2 tests. Characteristics were weighted by area of residence to account for oversampling of women from rural and remote areas by including a weight factor statement in the analysis. As dietary intake can change over time, the most recent reported dietary intake before the index pregnancy was used.
Generalised estimating equations analyses were used to account for correlated observations owing to multiple pregnancies by the same participant( Reference Hanley, Negassa and Edwardes 30 ). Log-Poisson models were used to estimate relative risks (RR) and 95 % CI for associations between carbohydrate quality, quantity and GDM( Reference Spiegelman and Hertzmark 31 ) as log-binomial models did not converge. Adjustment for time-varying covariates (education level, work status, marital status, BMI, smoking, physical activity, parity, PCOS) was performed using the value reported at the survey administered before the pregnancy. For pregnancy-specific covariates (hypertension during pregnancy and, if applicable, inter-pregnancy interval), the value reported for that specific pregnancy was used. Multiple gestation, alcohol intake, work status and marital status were not included in the analyses, as these were not significant confounders based on the data.
Partial correlations, adjusted for energy intake, were calculated to investigate correlations between carbohydrate-rich food groups and measures of carbohydrate quantity (carbohydrate intake (E%), LCD score) and carbohydrate quality (fibre and total sugar intake, GI and GL). Associations between intake of carbohydrate-rich food groups and risk of GDM were investigated by comparing quartiles of intake to determine whether the associations were linear (data not shown). The median intake of the quartiles was analysed as a continuous variable in multivariable models to obtain a P value for linear trend. Intakes of carbohydrate-rich food groups were subsequently analysed in multivariable models with intake as a continuous variable. The association between added sugar and risk of GDM was assessed for users v. non-users because of the large proportion of non-users and the subsequently skewed distribution.
To examine the robustness of the observed associations, several sensitivity analyses were performed. First, we examined the associations combining dietary intake data from Surveys 3 and 5 to calculate long-term average dietary intake. Furthermore, to exclude the possible effect of women changing their normal diet to increase their chance of conception, all pregnancies within the first 2 years of follow-up were excluded. In addition, we conducted a multiple imputation analysis to assess the influence of participant exclusions that resulted from missing covariate data (educational level, work, marital, smoking and alcohol status, PCOS and BMI; n 223) using SAS procedures MI and MIANALYZE( Reference Berglund 32 ). Finally, analyses were stratified by known risk factors for GDM including BMI (<25, 25–29·9 or >30 kg/m2), educational level (low, moderate, high) or parity (nulliparous v. parous), as these were identified as potential effect modifiers in other studies on diet and GDM( Reference Zhang, Liu and Solomon 14 , Reference Schoenaker, Soedamah-Muthu and Callaway 33 ).
Statistical analyses were conducted using SAS Software version 9.4 (SAS Institute Inc.). A P value<0·05 was considered statistically significant.
Results
During 12 years of follow-up (2003–2015), 285 cases of GDM (4·6 %) were reported in 6263 pregnancies among 3607 participants. Women with GDM were more often born in Asia, had a higher BMI, were more often nulliparous and more likely to have PCOS (data not shown). Women who had a pre-pregnancy diet with a relatively low carbohydrate intake (i.e. quartile 4 compared with quartile 1 of the LCD score) lived on average more often in rural/remote areas (Table 1). Furthermore, these women in the highest quartile of the LCD score were more often born in Australia, overweight or obese, current smokers, high-risk alcohol consumers and were less physically active and less educated compared with women in the lowest quartile.
Table 1 Baseline characteristics of non-pregnant Australian women according to quartile of low-carbohydrate diet (LCD) score (n 3607) (Mean values and standard deviations; percentages)
MET, metabolic equivalent.
* Baseline characteristics, weighted by area of residence.
† P values from χ 2 or ANOVA.
Carbohydrate quantity
Participants in the highest quartile of carbohydrate intake had a lower risk of developing GDM compared with the lowest quartile, after adjustment for socio-demographic factors (including age, country of birth, education level), reproductive factors (including parity, hypertension during pregnancy, PCOS and inter-pregnancy interval) and lifestyle factors (including smoking, energy intake and physical activity level) (Table 2). However, adjustments for protein intake, fat intake and BMI attenuated the observations, and results were no longer statistically significant. The LCD score (reflecting relatively high fat and protein intakes and a low carbohydrate intake) was significantly associated with a 54 % higher risk of GDM for women in the highest quartile compared with those in the lowest quartile (RR 1·54; 95 % CI 1·10, 2·15) after adjustment for socio-demographic, reproductive, lifestyle and dietary factors. Additional adjustment for BMI slightly attenuated the association (RR 1·43; 95 % CI 1·03, 2·01).
Table 2 Gestational diabetes mellitus (GDM) according to quartiles of dietary intakes of carbohydrate, total sugar and fibre, dietary glycaemic index and load and low-carbohydrate diet (LCD) score (Relative risks (RR) and 95 % confidence intervals)
* Model 1: adjusted for age at pregnancy (years), country of birth (Australia, Asia or other), educational level (low, medium or high), total energy intake (kJ/d), physical activity (low, medium or high), smoking (current, former or never), polycystic ovarian syndrome (yes or no), hypertension during pregnancy (yes or no), parity (0,1 or ≥2), inter-pregnancy interval (not applicable (first pregnancy),<18 months, 18–60 months or >60 months).
† Model 2: model 1+additional adjustments for fat and protein intake (E%).
‡ Model 2+BMI: model 2+additional adjustments for BMI (normal weight, overweight or obese).
§ Not adjusted for fat and protein intake, as these are part of the score.
Carbohydrate quality
Total sugar intake was inversely associated with the risk of developing GDM after adjustment for socio-demographic, lifestyle and reproductive factors (Table 2). The association was attenuated after adjustment for dietary factors and BMI and no longer statistically significant (RR 0·83; 95 % CI 0·56, 1·23). Women in the highest quartile of total fibre intake had a 33 % lower risk of GDM compared with women in the lowest quartile (RR 0·67; 95 % CI 0·45, 0·96) adjusted for smoking, physical activity and socio-demographic, reproductive and dietary factors. Further adjustment for BMI attenuated the association (RR 0·72; 95 % CI 0·50, 1·05). A non-significant positive trend was seen between GI and GL with development of GDM adjusted for socio-demographic, reproductive, lifestyle and dietary factors.
Carbohydrate-rich food groups
Carbohydrate intake, LCD score, total sugar intake, fibre intake, GI and GL were associated with different carbohydrate-rich food groups as indicated by partial correlations, adjusted for energy (Table 3). Intake of high-fibre bread, vegetables and fruit, fruit and fruit juice was inversely linearly associated with risk of GDM; white bread intake was positively linearly associated with GDM risk; and intake of cereal, staple products and vegetables was not associated with GDM risk (Table 4). After additional adjustment for the other food groups (model 2), intake of vegetables and fruit, fruit and fruit juice was inversely associated with development of GDM. Intake of the combined food group fruit and vegetables was significantly associated with a 10 % lower risk of developing GDM per 100 g/d increment. When analysing intake of fruit and vegetables separately, only fruit intake remained inversely associated with GDM risk (RR 0·95 per 50 g/d; 95 % CI 0·90, 0·99). Intake of cereal was associated with a higher risk of GDM (RR 1·05 per 20 g/d; 95 % CI 1·01, 1·07), but the association between cereal and GDM was slightly U-shaped (P for linear trend 0·11). Furthermore, women who consumed added sugar (n 2154, median intake 15·5 g/d) had a 29 % higher risk of GDM than women who did not consume added sugar, which slightly attenuated after adjustment for the other food groups and BMI, and was not statistically significant (RR 1·25; 95 % CI 0·98, 1·59).
Table 3 Partial correlations between carbohydrate intake, low-carbohydrate diet (LCD) score, total sugar intake, fibre intake, glycaemic index, glycaemic load and carbohydrate-rich food groups, adjusted for energy intake
–, Correlations below 0·25 were considered not relevant and are not displayed.
* Food groups and food items included: white bread; high-fibre bread (high-fibre white bread, whole-meal bread, rye bread, multi-grain bread); cereal (All Bran, bran flakes, muesli, Weet-Bix, cornflakes, porridge); fruit (oranges, apples, pears, bananas, melon, pineapple, strawberries, apricots, peaches, mango, avocado, tinned fruit); fruit juice; staple products (rice, pasta); added sugar; vegetables (tomato, tomato sauce, capsicum (bell or sweet peppers), lettuce, cucumber, celery, beetroot, carrots, cabbage, cauliflower, broccoli, spinach, peas, green beans, bean sprouts, pumpkin, onion, garlic, mushrooms, zucchini, potato).
Table 4 Gestational diabetes mellitus (GDM) for carbohydrate-rich food groups* (Relative risks (RR) and 95 % confidence intervals)
* Food groups and food items included: white bread; high-fibre bread (high-fibre white bread, whole-meal bread, rye bread, multi-grain bread); cereal (All Bran, bran flakes, muesli, Weet-Bix, cornflakes, porridge); fruit (oranges, apples, pears, bananas, melon, pineapple, strawberries, apricots, peaches, mango, avocado, tinned fruit); fruit juice (including juices from fresh fruit and ready-to-use fruit juice); staple products (rice, pasta); added sugar; vegetables (tomato, tomato sauce, capsicum (bell or sweet peppers), lettuce, cucumber, celery, beetroot, carrots, cabbage, cauliflower, broccoli, spinach, peas, green beans, bean sprouts, pumpkin, onion, garlic, mushrooms, zucchini, potato).
†Model 1: adjusted for age (years), country of birth (Australia, Asia or other), educational level (low, medium or high), total energy intake (kJ/d), physical activity (low, medium or high), smoking (current, former or never), polycystic ovarian syndrome (yes or no), hypertension during pregnancy (yes or no), parity (0,1 or ≥2), inter-pregnancy interval (not applicable (first pregnancy),<18 months, 18–60 months or >60 months).
‡ Model 2: model 1+additional adjustments for other carbohydrate food groups.
§Model 2+ BMI: model 2+additional adjustments for BMI (normal weight, overweight or obese).
||Because of the large proportion of non-users, the association between added sugar and risk of GDM was assessed for users (n 2154; median intake 15·5 g/d) v. non-users (n 1453) instead of a linear association.
Sensitivity analyses
Associations observed between fibre, LCD score and development of GDM persisted in sensitivity analyses, as well as associations between carbohydrate-rich food groups and GDM risk (data not shown). Interaction terms for BMI, educational level and parity were not significant. Additional stratification did not change the results materially.
Discussion
In this large prospective cohort study, we found that carbohydrate quantity assessed with the LCD score was associated with GDM, whereas for carbohydrate quality we observed an inverse association between fibre intake and GDM. Furthermore, higher intakes of cereal were positively associated with GDM risk, whereas higher intakes of fruit and fruit juice were associated with lower risk of GDM.
In this study, we examined both pre-pregnancy carbohydrate quantity and quality of the diet. To our knowledge there is only one other prospective cohort study (the Nurses’ Health Study) that is comparable with ours and looked at carbohydrate quantity and various aspects of carbohydrate quality (i.e. fibre, GI and GL) in relation to GDM incidence. The LCD diet score was significantly and positively associated with GDM risk, and thus women with a relative low carbohydrate intake had a higher risk of GDM. In the Nurses’ Health Study, women with a high LCD score (e.g. a low carbohydrate intake) also had a higher risk of GDM, with similar effect estimates( Reference Bao, Bowers and Tobias 13 ). Bao et al. were also able to calculate an animal and vegetable LCD score, which indicated that especially women with a high intake of animal fat and protein were at a higher risk. This is further supported by other studies showing higher GDM risk and impaired glucose metabolism with higher intakes of animal fat( Reference Bowers, Tobias and Yeung 34 – Reference Lichtenstein and Schwab 36 ) and animal protein( Reference Bao, Bowers and Tobias 37 ). This could indicate that not total carbohydrate intake but rather protein and fat intake are important in the association with GDM risk. However, the group of carbohydrates is a large group with different types of carbohydrates, including complex polysaccharides, monosaccharides and disaccharides, and different types of fibre. Some have beneficial health effects, such as fibre and low-GI diets( Reference Greenwood, Threapleton and Evans 11 , Reference Silva, Kramer and de Almeida 38 , Reference Yao, Fang and Xu 39 ), whereas others have negative health effects, such as sugars( Reference Khan and Sievenpiper 40 ). This could be a reason for the absence of an association of total carbohydrate intake with GDM.
Therefore, we further examined the relationship between carbohydrates and GDM by investigating carbohydrate quality – for example different subtypes of carbohydrates. We examined fibre and total sugar (i.e. total monosaccharide and disaccharide) intake, GI, GL and intake of several carbohydrate-rich food groups. The association between fibre and GDM risk observed in our study is in line with results of the Nurses’ Health Study( Reference Zhang, Liu and Solomon 14 ). The Nurses’ Health Study adjusted for BMI in all models, whereas in our study adjustment for BMI attenuated the association. However, it should be noted that the magnitude of the association after BMI adjustment was comparable with the association observed in the Nurses’ Health Study. Our observation of attenuation by BMI could indicate that the association between fibre and GDM risk is mediated by BMI. One of the underlying mechanisms could be that increased fibre intake reduces appetite and energy intake( Reference Kristensen and Jensen 41 , Reference Wanders, van den Borne and de Graaf 42 ). This could lead to reduced adiposity and improved insulin sensitivity( Reference Ylonen, Saloranta and Kronberg-Kippila 43 , Reference Thielecke and Jonnalagadda 44 ) and thus a lower risk of GDM.
Furthermore, fibre intake was strongly correlated with fruits, vegetables, white bread, high-fibre bread and cereal intake. Of these food groups, the most predominant association was observed between high fruit intake and lower risk of GDM, followed by high cereal intake and higher risk of GDM. An inverse non-significant association was observed for high-fibre bread and a positive non-significant association was observed for white bread with GDM, after adjustment for other food groups. The multitude of directions and magnitude of the associations between different food groups high in fibre and GDM illustrates the complexity of the association between fibre and GDM. The association of higher cereal intake with higher risk of GDM could potentially be explained by the (often) high amounts of sugar present in cereal products, whereas fruit contains many other nutrients such as vitamins and minerals that could also have a beneficial effect on GDM risk( Reference Zhang, Williams and Sorensen 45 ). Furthermore, although we could not differentiate the different types of dietary fibre in our study, this could explain the observed associations. Whole-grain products contain mainly insoluble fibre( Reference Lairon, Bertrais and Vincent 46 ), which has been associated with intestinal transit time( Reference Roehrig 47 ), whereas fruit and vegetables contain relatively more soluble fibres( Reference Lairon, Bertrais and Vincent 46 ). Soluble fibres can create a gel-like substance in the stomach, which can delay gastric emptying and thus slow glucose absorption( Reference McIntosh and Miller 48 , Reference Poutanen, Dussort and Erkner 49 ). However, confirmation by experimental studies and more detailed knowledge of underlying mechanisms is needed.
Carbohydrate quality is most often studied by using the GI and GL. We found no statistically significant associations between GI, GL and GDM risk. However, it should be noted that the direction and magnitude of the associations between GI, GL and GDM risk were similar to significant estimates shown in the Nurses’ Health Study( Reference Zhang, Liu and Solomon 14 ). Differences in study size and number of cases could explain the absence of statistical significance in our study.
The potential effect of sugar intake on disease risk can be a controversial topic( Reference Khan and Sievenpiper 40 ). In our study, we examined the associations between sugar intake and GDM risk by examining several exposures: total sugar intake (all monosaccharides and disaccharides), sugar added by participants to their meals and drinks and carbohydrate food groups with high sugar content (fruit and fruit juice). Total sugar intake was not associated with GDM in our study, but fruit, fruit juice and added sugar were (borderline significantly) associated with GDM risk. Higher fruit and fruit juice intakes were associated with lower risk of GDM, whereas higher added sugar intake was associated with a higher risk of GDM. The discrepancy in our results could be owing to the complexity of total sugar content. Total sugar includes sugars found in nutritious foods such as fruit, fruit juice and dairy products, whereas on the other hand added sugar provides only excess energy.
To our knowledge, no other studies investigated the intake of carbohydrate-rich food groups and risk of GDM. Our observed associations between carbohydrate-rich food groups and GDM risk are consistent with results from similar studies on pre-pregnancy dietary patterns and risk of GDM( Reference Schoenaker, Soedamah-Muthu and Callaway 33 , Reference Tobias, Hu and Chavarro 50 , Reference Zhang, Schulze and Solomon 51 ), where adherence to a pre-pregnancy healthy dietary pattern was consistently associated with a lower risk of GDM. These healthy dietary patterns and diet quality scores (e.g. Mediterranean Diet score, Healthy Eating Index) often include vegetables, fruit and whole-grain products and limited intake of refined grains. Pinpointing specific food groups underlying the associations between carbohydrates and GDM is important for the development of effective prevention strategies, as it might be easier to change the intake of specific food groups rather than a complete dietary pattern. However, more studies and specifically randomised clinical trials are needed to confirm our results and to investigate whether changing intakes of specific food groups have an impact on reducing GDM risk.
The results presented were derived using data from a large, prospective study. Women were included in the study early in their reproductive age and before pregnancy. The longitudinal design with multiple measurements enables the examination of prospective associations with the risk of developing GDM. In addition, we were able to use updated information on covariates such as BMI, educational level and smoking, which might change over time since the start of the study, especially in this young cohort. Results from this nationally representative population-based sample are generalisable to the Australian population of reproductive-aged women( Reference Brown, Bryson and Byles 17 ) and other Western countries with similar sources of carbohydrate intake. Furthermore, in this study we looked at both quantity and quality of carbohydrates to provide a complete overview.
However, some limitations should also be acknowledged. First, data from this study are observational, and no causal effects can be established. Second, data are obtained from self-reports and therefore misclassification could be present, although self-reported GDM outcome was validated against medical records( Reference Gresham, Forder and Chojenta 28 ). Furthermore, validation of the FFQ showed good agreement with food records (energy-adjusted correlation coefficients of 0·78 for carbohydrate)( Reference Hodge, Patterson and Brown 20 ), indicating that most important carbohydrate sources are properly assessed with the FFQ. However, food group intake was not validated, and several carbohydrate foods including sugar-sweetened beverages, sweets and confectionery products were not included. Furthermore, food group analysis was limited by aggregation of foods in the FFQ food items. For example, it was not possible to differentiate between whole-grain pasta and refined grain pasta in the staple group. In addition, aggregation of foods in the FFQ food items might have affected the GI associations, as aggregation of foods with different GI values could have led to misclassification. Third, we excluded 718 women with implausible energy intake and 245 women with missing information on GDM diagnosis. As this resulted in a lower number of participants and GDM cases, this might have reduced statistical power. However, including these women would have resulted in misclassification and therefore biased estimates. Fourth, dietary intake during pregnancy was not assessed in this study. However, a recent study investigating diet quality of women before and during pregnancy in the ALSWH showed that there were few differences in dietary intake between non-pregnant and pregnant women( Reference Gresham, Collins and Mishra 52 ), as is also reported by other studies( Reference Cuco, Fernandez-Ballart and Sala 53 , Reference McGowan and McAuliffe 54 ). Finally, although we were able to adjust for a wide variety of socio-demographic and lifestyle factors, residual confounding might still be present – for example consumption of certain food items could reflect health consciousness.
In conclusion, a relatively low carbohydrate intake and high fat and protein intake may increase the risk of GDM; however, it is important to take the source of carbohydrate into account. High intake of total dietary fibre, fruit and fruit juice may decrease the risk of GDM, whereas cereal could increase the risk of GDM. This may be important to consider in nutritional programmes for preventing GDM.
Acknowledgements
The authors are grateful to the Australian Government Department of Health for funding and to the women who provided the survey data. The authors thank Professor Graham Giles of the Cancer Epidemiology and Intelligence Division of Cancer Council Victoria for permission to use the Dietary Questionnaire for Epidemiological Studies (version 2), Melbourne: Cancer Council Victoria, 1996. The Jo Kolk study fund is gratefully acknowledged for proving M. L. with a travel grant to visit the University of Queensland.
The research on which this paper is based was conducted as part of the Australian Longitudinal Study on Women’s Health by the University of Queensland and the University of Newcastle. G. D. M is supported by the Australian National Health and Medical Research Council Principal Research Fellowship (APP1121844).
M. L. designed the research, performed the statistical analysis, wrote the paper and had primary responsibility for the final content. D. A. J. M. S., S. S. S.-M., A. G., E. J. M. F. and G. D. M. contributed to design of the research, interpretation of the results and critical revision of the manuscript for important intellectual content. All authors approved the final version to be published.
The authors declare that there are no conflicts of interest.


