


Zn and essential fatty acids (FA) are required for optimal growth, immune response, gene expression, visual development, neurotransmission and cognition( Reference Calder 1 – Reference Vallee and Falchuk 3 ). The high prevalence of Zn deficiency is a public health concern: 17 % of the world’s population may be at risk of inadequate Zn intake. According to data derived from food balance sheets and demographic data, 17–25 % of the Benin population is at risk of Zn deficiency. Overall, the Beninese population is classified as moderately Zn deficient( Reference Galetti, Mitchikpè and Kujinga 4 – Reference Wessells and Brown 6 ).
Zn acts as a cofactor of the FA desaturase and elongase enzymes( Reference Prasad 7 , Reference Cunnane 8 ). The desaturase and elongase enzymes convert the essential linoleic acid (LA) and α-linolenic acid (ALA, 18 : 3n-3) to their long-chain PUFA (LCPUFA) metabolites, as well as the SFA palmitic acid (16 : 0) to nervonic acid (24 : 1n-9)( Reference Nakamura and Nara 9 ). A relationship between Zn and FA metabolism has been confirmed in several animal studies. Zn deficiency altered the FA composition of phospholipids in rat liver, plasma and erythrocytes( Reference Cunnane 8 , Reference Bettger, Reeves and Moscatelli 10 – Reference Kirchgessher and Manfred 14 ). Some studies have reported higher levels of LA (18 : 2n-6)( Reference Kudo, Nakagawa and Waku 12 , Reference Ayala and Brenner 15 – Reference Faure, Durand and Blache 17 ) whilst some have reported lower levels of arachidonic acid (AA, 20 : 4n-6)( Reference Clejan, Castro-Magana and Collipp 11 , Reference Ayala and Brenner 15 , Reference Cunnane, Horrobin and Manku 16 , Reference Kramer, Briske-Anderson and Johnson 18 – Reference Wauben, Xing and Wainwright 20 ) and others high or normal levels of AA in tissue phospholipid of Zn-deficient animals. This relationship was also shown in a recent human study( Reference Knez, Stangoulis and Zec 21 ). It has also been shown that Zn facilitates the incorporation of FA into phospholipids( Reference Gimenez, Oliveros and Gomez 22 ).
Plasma Zn (PZn) is the biomarker of choice for the assessment of Zn status in populations, however the search for a sensitive and specific biomarker for assessing body Zn concentrations at the individual level is still ongoing( Reference King, Brown and Gibson 23 ). Although PZn responds well to supplementation, as assessed in depletion-repletion studies( Reference Wessells, Jorgensen and Hess 24 ), PZn has been found to vary due to factors that are unrelated to Zn intake or status, such as infection/inflammation, time of sample collection, sample handling, among others, and might in fact not reflect individual Zn status( Reference Lowe, Fekete and Decsi 25 ). Recent studies in chickens (Gallus gallus) and in humans have suggested the ratio of LA:dihomo-γ-linolenic acid (DGLA; 20 : 3n-6) or the similarly used DGLA:LA ratio, to be a potential biomarker of Zn status( Reference Knez, Stangoulis and Zec 21 , Reference Reed, Qin and Ran-Ressler 26 ). This is because the conversion of LA to DGLA requires desaturase and elongase enzymes. Reed et al. ( Reference Reed, Qin and Ran-Ressler 26 ) and Knez et al. ( Reference Knez, Stangoulis and Zec 21 ), respectively, found that Zn deficiency was positively associated with the LA:DGLA ratio in erythrocyte and plasma membranes. Knez et al. ( Reference Knez, Stangoulis and Zec 21 ) found that a lower dietary Zn intake was associated with a higher LA:DGLA ratio in apparently healthy 28–55-year-old adults, but this relationship has not yet been investigated in children.
Zn supplementation can increase dietary Zn intake and improve Zn status( Reference Brown and Hotz 27 ). Although the results from fortification studies are inconsistent( Reference Das, Kumar and Salam 28 ), Zn fortification of staple food grain flours such as wheat, millet and maize is a recommended strategy to improve dietary Zn intake( Reference Tripathi and Platel 29 ). However, the bioavailability of Zn from many fortified grain flours is low as they have high phytate:Zn molar ratios( Reference Moretti, Biebinger and Bruins 30 ). Phytic acid is an inhibitory factor that reduces Zn absorption( Reference Sian, Hambidge and Westcott 31 ). Fortified water as a fortification vehicle for Zn has the benefit of being free of inhibitors of absorption, making it a potentially good source of bioavailable Zn( Reference Polaki and Yarla 32 ). In a randomized, controlled trial, Galetti et al.( Reference Galetti, Kujinga and Mitchikpè 33 ) established that consumption of water from a filter able to fortify water with Zn at physiological concentrations, maintained PZn concentration of Beninese school children who were in the treatment group at baseline levels, whereas the PZn concentration of children in the control group was decreased over the 20-week study period.
In this secondary analysis of data from the Benin study( Reference Galetti, Kujinga and Mitchikpè 33 ), our study aims were to assess: (1) whether PZn and plasma total phospholipid FA composition are correlated in Beninese children; and (2) whether Zn fortification affects the LA:DGLA or DGLA:LA ratio, as a potential Zn status biomarker. Our hypotheses were: (1) that there are baseline associations between PZn and plasma total phospholipid FA composition; and (2) that children in the intervention group have better desaturase and elongase enzyme activities, estimated by product to precursor FA ratios, compared with children in the control group after a 20-week intervention period.
Methods
Study design, site and subjects
This study was part of a 20-week double-blind randomised controlled trial conducted in rural Benin in school age children between the months of February and June 2013. Its main objectives were to determine Zn bioavailability from Zn-fortified drinking water providing a mean of 2·8 mg Zn/d, and assess the efficacy of the Zn-fortified water in improving Zn status over a 20-week period( Reference Galetti, Kujinga and Mitchikpè 33 ). At baseline, midpoint, and endpoint we measured PZn and inflammatory markers that may confound PZn, α1-acid glycoprotein (AGP) and C-reactive protein (CRP). The primary outcome of the main study was PZn concentration. We conducted the study at the primary school of Kotopounga, a rural town in north-western Benin, where the climate is a sub-equatorial/tropical savanna with one rainy season (May–June to September–October) and one dry season (October–November to April–May). Study procedures were translated into the local Waama and Otamari languages. Children were excluded from the study if they had: (1) severe anaemia (defined as Hb<70 g/l), (2) major chronic diseases, (3) long-term medication use or (4) recent Zn supplementation. We randomised children (n 277) at enrolment to one of three treatment arms: one group received Zn-fortified, filtered drinking water (Zn+filter group, 2·8 mg Zn/d), one group received non-fortified filtered drinking water (filter group, virtually no Zn) and the third group received local drinking water from a pumped well. In this study, we included only the Zn+filter (n 89) and filter (n 97) groups. Plasma total phospholipid FA composition was determined in 186 subjects (Fig. 1).
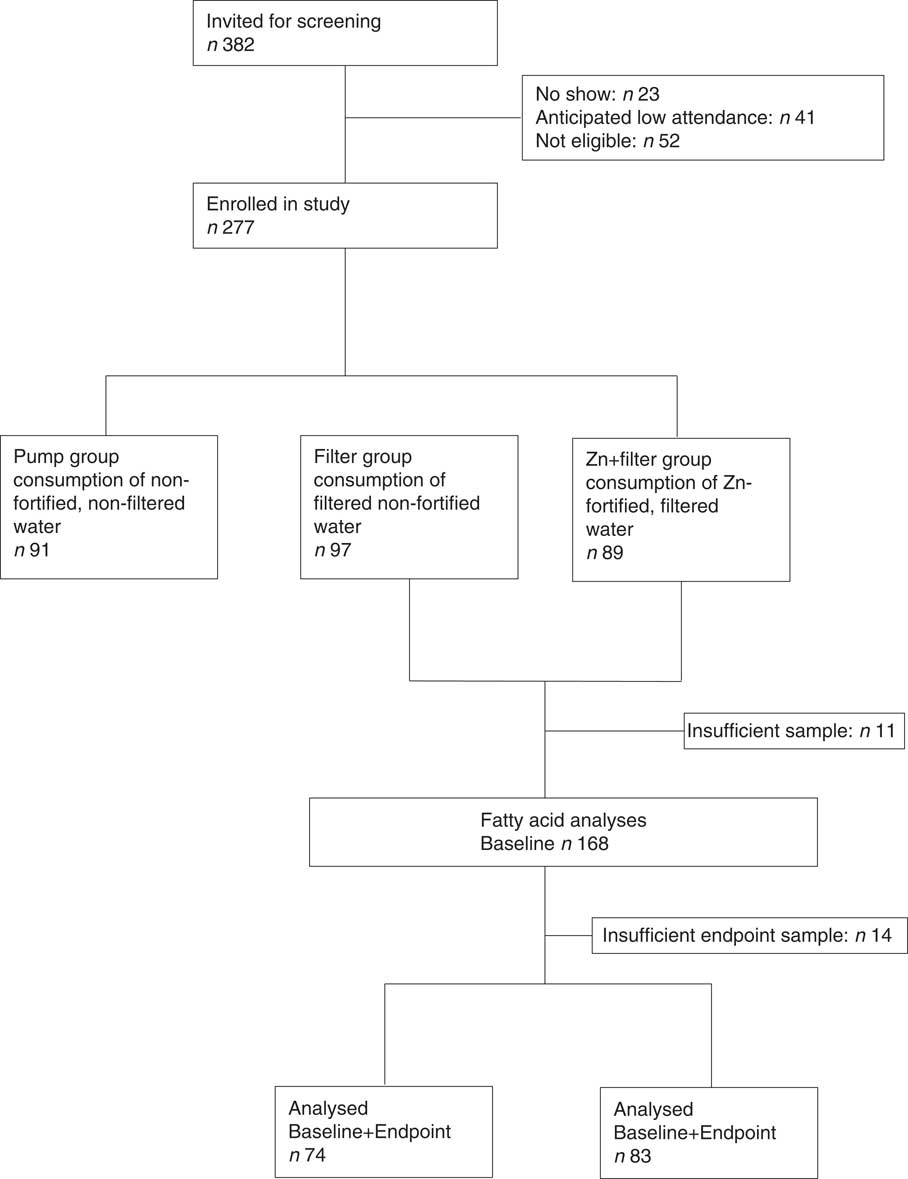
Fig. 1 Flow diagram of the secondary study in context of the main study.
Sample size
To our knowledge, no similar study has been previously reported. We therefore based the sample size calculation for the intervention hypothesis of this secondary study on an independent t test analysis in G * power( Reference Faul, Erdfelder and Buchner 34 ). A sample size of fifty-two per group was needed to give the study 80 % power to detect a standardised effect size (0·6) of the intervention if significance was set at P=0·05.
Intervention
Water was purified daily either with a filter equipped with a Zn fortification chamber (Zn+filter) or with a placebo chamber (filter), and hygienically stored in tanks until consumption. The Zn concentration in water was monitored daily, both with a rapid assessment method (Aquaquant; Merck) in the field, and after the intervention by flame atomic absorption spectrometry (Varian Inc.) at the Laboratory of Human Nutrition at ETH Zurich.
From Monday to Friday, each child received a morning and an afternoon serving of 300 ml filtered water (during the 10.00 hours and the 15.00 hours breaks), with the exception of Wednesdays, when they consumed only the morning serving. The 300-ml Zn-fortified water serving contained a median Zn dosage of 2·4 (interquartile range (IQR) 2·0, 3·2) mg, which resulted in an average daily Zn intake of 4·3 (IQR 3·5, 5·2) mg and 2·8 (IQR 0·0, 4·5) mg on school days and over the entire study, respectively.
Dietary Zn intake was evaluated in a subsample of thirty-six children; mean Zn intake was 8·1 (sd 62·3) mg/d( Reference Galetti, Mitchikpè and Kujinga 4 ). Since the main contributing sources of Zn were maize (38 %), sorghum (21 %), beans and legumes (16 %), vegetables (5 %) and cassava, yam and rice (2·7 % each), the estimated daily intake of absorbable Zn was 1·5 (sd 0·5) mg( 35 ) according to the WHO algorithm for unrefined cereal-based diet and 1·9 (sd 0·3) mg according to the algorithm by Miller et al. ( Reference Miller, Krebs and Hambidge 36 ).
Blood sampling, biochemical analysis and anthropometry
Two morning (mean time of day: 10:24 (sd 1) h 18 min) fasting (subjects in non-fasting state were 5 and 3·3 % at baseline and endpoint sampling, respectively) venous whole-blood samples from each study participant were collected directly into one trace element–free lithium heparin tube for PZn analysis and one EDTA tube (Sarstedt) for analysis of inflammation markers. Hb was assessed with a portable HemoCue 201+ photometer (HemoCue AB). The blood samples were refrigerated at 4–8°C immediately after collection, centrifuged within 1 h (3000 g for 10 min at room temperature), divided into aliquots in acid-washed plastic vials (Eppendorf AG), and stored at −20°C (within 5 h) until analysis. The samples were shipped to ETH Zurich on dry ice. PZn concentrations were measured at ETH Zurich as described previously( Reference Galetti, Kujinga and Mitchikpè 33 ). Briefly, PZn was measured by flame atomic absorption spectrometer (AA240FS; Varian Inc.) using a commercial aqueous standard (Titrisol 1.009953.0001; Merck) for external calibration, and Seronorm Trace Elements Serum L-2 (Sero AS) as reference material, which delivered values within acceptable ranges as specified by the manufacturer. Standardised protocols by the International Zn Nutrition Consultative Group (IZiNCG) were followed during sample collection, handling, and analysis in order to avoid exogenous or endogenous Zn contamination( 37 ).
CRP (Code A0073; Dako Denmark) and AGP (Code Q032605-2; Dako Denmark) were analysed by using a sandwich ELISA( Reference Erhardt, Estes and Pfeiffer 38 ). Liquicheck Trilevel (Bio-Rad Laboratories Inc.) was used as control material with each run of analysis, and measured values were within acceptable ranges as specified by the manufacturer.
PZn values were adjusted with correction factors according to the subjects’ respective phases of inflammation: Subjects in incubation (CRP>5 mg/l and/or AGP>1·0 g/l) with 1·08, those in early convalescence (CRP>5 mg/l and AGP>1·0 g/l) with 1·17 and those in late convalescence (CRP<5 mg/l and AGP>1·0 g/l) with 1·06( Reference Thurnham, Mburu and Mwaniki 39 ). The prevalence of Zn deficiency was calculated by using sex- and age-specific PZn cut-offs suggested by the IZiNCG( Reference Hess, Peerson and King 40 ). Low PZn concentration was defined as PZn <9·9 μmol/l for children aged <10 years (morning sampling), <8·7 μmol/l for children aged <10 years (afternoon sampling), <10·7 μmol/l for females aged ≥10 years (morning fasting sampling), <10·1 μmol/l for females aged ≥10 years (morning non-fasting sampling), <9·0 μmol/l for females aged ≥10 years (afternoon sampling), <11·3 μmol/l for males aged ≥10 years (morning fasting sampling), <10·7 μmol/l for males aged ≥10 years (morning non-fasting sampling), and <9·3 μmol/l for males aged ≥10 years (afternoon sampling)( Reference Ghosh, Darnton-Hill and Davidsson 41 ). Subclinical inflammation was defined≥5 mg/l for CRP and/or 1 g/l for AGP. Severe anaemia was defined as Hb≤70 g/l( 42 ).
Baseline and endpoint plasma samples for each subject were prepared for plasma total phospholipid FA analysis and analysed with GLC together in the same batch (pair-wise analysis) at the Non-Communicable Diseases Research Unit of the South African Medical Research Council. In short, lipids were extracted from plasma with chloroform: methanol (2:1 vol: vol; containing 0·01 % butylated hydroxytoluene) by using a modification of the Folch et al. ( Reference Folch, Lees and Sloane-Stanley 43 , Reference Hon, Hassan and van Rensburg 44 ) method. Lipid extracts were concentrated, the neutral lipids separated from the total phospholipid fraction by using TLC (silica gel 60 plates, 10×10 cm; Merck), and eluted with diethyl ether: petroleum ether: acetic acid (30:90:1; vol: vol: vol). The lipid band that contained total phospholipids (application origin) was removed from the TLC plate and trans-methylated with methanol: sulphuric acid (95:5 vol: vol) at 70°C for 2 h to yield fatty acid methyl esters (FAME). The resulting FAME were extracted with water and hexane. The organic layer was evaporated, redissolved in hexane, and analysed (sample injection volume 1 μl) by using GLC on a finnigan Focus Gas Chromatograph equipped with flame ionisation detector (Thermo Electron Corporation) and a 30-m capillary column of 0·32 mm internal diameter; BPX70 0·25 μm (SGE International Pty Ltd). Gas flow rates were: N2 (make up gas), 25 ml/min; air, 250 ml/min; H2 (carrier gas), 25 ml/min, with a split ratio of 20:1. GC-oven temperature programming was linear at 4·5°C/min, initial temperature 140°C (hold-time 1 min), final temperature 220°C (hold-time 5 min), injector temperature 220°C, and detector temperature 250°C. The FAME were identified by comparison of the retention times with those of a standard FAME mixture (27 FAME; NuChek Prep Inc.). Relative percentages of FA were calculated by taking the area count (AUC) of a given FAME as a percentage of the total area count of all FA identified in the sample.
Product:precursor FA ratios were used as a proxy to reflect enzyme activity. The GLA:LA (although not widely used as GLA is rapidly converted to DGLA), AA:DGLA and DGLA:LA ratios were used to estimate Δ-5- and Δ-6-desaturase activities( Reference Fan and Chapkin 45 , Reference Warensjö, Rosell and Hellenius 46 ). Anthropometric measures were done as described previously( Reference Galetti, Kujinga and Mitchikpè 33 ). Total n-6 LCPUFA was defined as DGLA plus AA.
Statistical analysis
The software package SPSS, version 22 (IBM), together with Excel, version 14 (Microsoft Office) were used to analyse the data of this secondary study. All data were checked for normality using histograms and the Shapiro–Wilk test and any value that departed more than 3 sd from the standardised mean were examined. When data were not normally distributed, values were either logarithmically or square root transformed before statistical analysis. Values in the text and in the tables are represented as mean values and standard deviations for normally distributed data, medians and IQR for non-normal data, and percentages for categorical variables. Baseline differences in participant characteristics between the groups were tested by using independent t tests for continuous variables and Pearson’s χ 2 test for categorical variables. Partial correlation coefficients, adjusted for sex, BMI and age were calculated to determine associations between FA and PZn. The effects of the Zn fortification on plasma total phospholipid FA composition were analysed with one-way ANCOVA by using respective baseline FA values, age, sex and BMI as individual level covariates in the total group, as well as in the children who were Zn deficient at baseline. Parameter estimates, unstandardised β-coefficients (β values) with 95 % CI, were obtained to indicate the size and direction of the intervention effects. Significance was set at P<0·05.
Ethical considerations
The study was conducted according to the principles of the Declaration of Helsinki of 1975, as revised in 1983, and an independent Data Safety Monitoring Board was set up to monitor the intervention. Before the screening, parents gave informed consent by either a written signature or a fingerprint. The ethical committees of, the Beninese National Ethics Committee for Health Research (no. 029; 19 October 2012), and the ETH Zürich, Switzerland (EK-N-47), and the North-West University, Potchefstroom, South Africa (NWU-00086-15-A1) approved the study protocol. This trial was registered at ClinicalTrials.gov PRS with the identifier NCT01790321.
Results
Study participant characteristics
Table 1 summarises the baseline anthropometric and biochemical characteristics of the study participants. Hb was significantly higher in the Zn+filter group than in the filter group at baseline (P=0·030). Anthropometric measures between groups at baseline did not differ. Median PZn concentration was 10·8 μmol/l (IQR 9·7, 12·1) for the Zn+filter group and 10·5 μmol/l (IQR 9·6, 11·8) for the filter group at baseline, and a prevalence of Zn deficiency in all the children was 32 % (n/N 60/186). There were no differences at baseline between the plasma total phospholipid FA compositions of the treatment groups except for LA (P=0·040) that was higher in the Zn+filter group and the AA:DGLA ratio (P=0·030) that was lower in the Zn+filter group as seen in Table 3.
Table 1 Baseline anthropometric measurements and biochemical characteristics of Beninese children by treatment groupFootnote * (Percentages and numbers; medians and interquartile ranges (IQR); mean values and standard deviations)
HAZ, height-for-age z score; WAZ, weight-for-age z score; BAZ, BMI-for-age z score; MUAC, mid upper arm circumference; PZn, plasma Zn; CRP, C-reactive protein; AGP, α1-acid glycoprotein.
* Differences between the Zn+filter group and filter groups were examined by using independent t tests for continuous variables and by using the χ 2 test for categorical variables.
† Percentage (%, n/N× 100) (all such values). Low PZn concentration defined as PZn <9·9 μmol/ for children aged <10 years (morning sampling), <8·7 μmol/l for children aged <10 years (afternoon sampling), <10·7 μmol/l for females aged ≥10 years (morning fasting sampling), <10·1 μmol/l for females aged ≥10 years (morning non-fasting sampling), <9·0 μmol/l for females aged ≥10 years (afternoon sampling), <11·3 μmol/l for males aged ≥10 years (morning fasting sampling), <10·7 μmol/l for males aged ≥10 years (morning non-fasting sampling), and <9·3 μmol/l for males aged ≥10 years (afternoon sampling).( Reference Hess, Peerson and King 40 )
‡ BMI=weight (kg)/height2 (m2).
§ Hb was significantly higher in the Zn+filter group (P=0·03).
Baseline associations of plasma zinc with plasma total phospholipid fatty acid composition
Table 2 shows the corrected correlation coefficients at baseline for the associations between PZn and plasma total phospholipid FA composition, adjusted for age, sex, and BMI. Positive correlations were found between PZn and the DGLA:LA (r 0·293, P≤0·000), and the GLA:LA (r 0·359, P=0·032) ratios. PZn also correlated positively with DGLA (r 0·182, P=0·024), and negatively with LA (r −0·211, P=0·009), and the AA:DGLA ratio (r −0·170, P≤0·032). There were no significant differences at baseline in plasma total phospholipid FA composition between the Zn-sufficient and Zn-deficient groups (data not shown). The adjustment of PZn values with correction factors for inflammation did not affect the main findings.
Table 2 Baseline correlations of plasma zinc with plasma total phospholipid fatty acid compositionFootnote * (Mean values and standard deviations; medians and interquartile ranges (IQR))
OA, oleic acid; LA, linoleic acid; GLA, γ-linolenic acid; DGLA, dihomo-γ-linolenic acid, AA, arachidonic acid; ALA, α-linolenic acid; LCPUFA, long-chain PUFA.
* Correlations were determined by using linear regressional analysis, adjusted for sex, BMI, age and partial correlation coefficients are shown. PZn values were corrected using adjusted and AGP correction factors( Reference Thurnham, Mburu and Mwaniki 39 ). Fatty acids with low sample sizes (<39), due to peak area counts below 0·1 % of the total chromatogram were not included in analysis.
† Data were log transformed to perform ANCOVA.
‡ Data were squared to perform ANCOVA.
§ Data were reciprocally transformed to perform ANCOVA.
Effects of zinc fortification on plasma zinc and plasma total phospholipid fatty acid composition
As shown in Table 3, Zn fortification significantly prevented the reduction of PZn concentration in the Zn+filter group (P=0·030) compared with the filter group. The effects of Zn fortification on the plasma total phospholipid FA composition of all the children are given in Table 3. When compared with the filter group, Zn fortification prevented reduction of nervonic acid (P=0·047) in the Zn+filter group.
Table 3 Effects of zinc fortification for 20 weeks on plasma total phospholipid fatty acid composition of 6- to 10-year-old Beninese childrenFootnote † (Mean values and standard deviations; medians and interquartile ranges (IQR); β-coefficients and 95 % confidence intervals)
PZn, plasma Zn; OA, oleic acid; LA, linoleic acid; GLA, γ-linolenic acid; DGLA, dihomo-γ-linolenic acid; AA, arachidonic acid; ALA, α-linolenic acid; LCPUFA, long-chain PUFA.
* Values changed significantly from baseline to endpoint (P<0·05).
† Intervention effects were estimated by one-way ANCOVA, adjusted for respective baseline value, sex, age and BMI. Fatty acids with low sample sizes (<21 in Zn+filter and 21 in filter group), due to peak area counts below 0·1 % of the total chromatogram were not included in analysis.
‡ Data were log transformed to perform ANCOVA.
§ Data were squared to perform ANCOVA.
The effect of Zn fortification on the plasma total phospholipid FA composition in only the Zn-deficient children is shown in the online Supplementary Table S1. In these children, Zn fortification significantly increased nervonic acid (P=0·030) and decreased ALA (P=0·008).
Discussion
In rural Beninese school age children, PZn concentration at baseline was positively correlated with plasma total phospholipid FA composition for DGLA, DGLA:LA and GLA:LA ratios. Thus, confirming a previously reported relationship between PZn and the DGLA:LA ratio, which is a proxy marker for Δ-6-desaturase activity and has been proposed as a potential biomarker for Zn status. The most unexpected finding, however, was that Zn fortification prevented reduction of the longer-chain n-9 MUFA, nervonic acid in plasma total phospholipids, particularly in children that were Zn-deficient at baseline.
The positive association of PZn concentration with the DGLA:LA ratio at baseline indicates an enhanced conversion of precursor FA to long-chain FA metabolites with increasing PZn concentration. Accordingly, we showed that PZn correlates with DGLA. An inverse relationship between PZn concentration and LA also suggests that a higher availability of circulating Zn results in a more efficient conversion of LA, an essential FA, to longer-chain metabolites. Zn is a cofactor for desaturase enzymes( Reference Horrobin 47 ), and Zn deficiency may result in a disruption of the rate-limiting Δ-6-desaturase step in FA synthesis, which is necessary for the conversion of LA into DGLA( Reference Tang, Cho and Nakamura 48 ). Additionally, Zn deficiency and low dietary Zn intake affect the electron transport of the mitochondrial electron transport chain( Reference Knez, Stangoulis and Zec 21 ), as microsomal Zn levels directly determine electron transfer chain activity( Reference Cunnane 49 ). There was a weak positive association between PZn concentration and the GLA:LA ratio; this was likely due to the increased elongation of GLA from LA( Reference Fan and Chapkin 45 ). Subsequently, an improvement in Zn status, as previously shown in other studies, would be expected to result in a positive association between PZn and the AA:DGLA ratio. The proportion of LCPUFA to their PUFA precursors is expected to be increased as the availability of circulating Zn results in an elevated desaturase activity. This study, however, found an inverse relationship between the two, which may indicate that only Δ-6-desaturase activity, but not Δ-5 activity necessary for the conversion of DGLA to AA, is affected by Zn status. This supports the value of the LA:DGLA or DGLA:LA ratio as an emerging biomarker for Zn status, as proposed by Knez et al. ( Reference Knez, Stangoulis and Zec 21 ) and Reed et al. ( Reference Reed, Qin and Ran-Ressler 26 ), although in the latter study it was not clear whether the ratio shift was due to a decrease in feed consumption or decrease in Zn intake.
Contrary to findings from the study conducted by Reed and colleagues, we found no significant difference in the DGLA:LA ratio in the Zn-deficient group when compared with the Zn-sufficient group (0·15 (sd 0·43) and 0·14 (sd 0·42), respectively, P=0·217)( Reference Reed, Qin and Ran-Ressler 26 ). However, it should be noted that the study conducted by Reed et al. was an animal study, and the animals were kept in a highly controlled environment and fed a standardised diet.
To our knowledge, this is one of the first human studies to investigate the effect of Zn intervention on FA status. Most previous studies used animal models and found higher LA and lower n-6 LCPUFA in the blood/tissue of Zn-deficient animals, indicating a disruption in desaturation and/or elongation of FA( Reference Cunnane 8 , Reference Ayala and Brenner 15 , Reference Kramer, Briske-Anderson and Johnson 18 , Reference Dib, Clavel and Carreau 19 , Reference Cunnane 49 ). A novel finding of this study is that Zn fortification prevented the reduction of nervonic acid, a MUFA. This suggests that greater availability of circulating Zn not only increases desaturase activity, but may increase activity of the elongase enzymes in the n-9 synthesis pathway. Nervonic acid is produced from oleic acid, which occurs naturally in various animal and vegetable fats and oils, after undergoing three consecutive chain elongation steps catalysed by elongases. FA elongases, which function with FA desaturases to generate many of the long-chain MUFA- and PUFA, are likely affected by Zn status( Reference Jump 50 ) as an inhibition in the terminal desaturase reaction has been described in Zn deficiency( Reference Cunnane 49 ). This finding may be physiologically relevant as nervonic acid is required for the biosynthesis of sphingomyelin in the human brain( Reference El-Agamy 51 ).
Overall, the proposed molecular mechanisms by which Zn affects the activity of desaturase and/or elongase enzymes were supported by results from this study. Even with a low dosage of Zn and a small intervention effect( Reference Galetti, Kujinga and Mitchikpè 33 ), Zn fortification had a detectable effect on the FA composition of Zn-deficient children.
The strengths of this study include the randomized and controlled study design, the direct supervision of each child during water consumption to assess compliance, the provision of highly bioavailable Zn which doubled the amount of absorbable Zn intake from the usual diet( Reference Galetti, Mitchikpè and Kujinga 4 ), the strict procedures during collection and processing to avoid Zn contamination of plasma samples( Reference Galetti, Mitchikpè and Kujinga 4 , Reference Galetti, Kujinga and Mitchikpè 33 ) and the extensive characterisation of FA profiles in a relatively large number of children. However, this study had limitations. This study was a secondary analysis of a larger study that was not designed or powered to assess changes in FA profiles( Reference Galetti, Kujinga and Mitchikpè 33 ), this may have introduced bias into our analysis. Furthermore, although PZn concentrations in the Zn+filter group were significantly higher than in the filter group during the intervention, PZn concentrations did not increase in the Zn+filter group. This was attributed to a seasonal increase in infections occurring towards the end of the intervention which cause PZn depression( Reference Galetti, Kujinga and Mitchikpè 33 ), thus reducing the availability of circulating Zn. This may have reduced our ability to differentiate group differences in FA profile during the intervention. It is possible that a more efficacious Zn fortification intervention (or Zn supplementation with higher doses) might have resulted in a more pronounced group differences in the FA profile. Also, although baseline FA composition was similar in the two groups suggesting no large differences in dietary fat intake, potential group differences in dietary fat intake during the intervention could have biased our results, as dietary fat intake is correlated with plasma FA composition( Reference Hodge, Simpson and Gibson 52 ). finally, our study was limited by the use of plasma for the measurement of FA status( Reference Smit, Muskiet and Boersma 53 ). The use of erythrocyte membranes or adipose tissue would have been more sensitive to reflect long-term changes in LCPUFA than plasma, as the latter is used as a short term FA biomarker( Reference Baylin and Campos 54 – Reference Katan, Deslypere and Van Birgelen 56 ).
In conclusion, our findings suggest PZn concentrations are positively associated with the activity of FA desaturases (particularly Δ-6-desaturase), and/or elongases in children. Furthermore, Zn fortification for 20 weeks prevented reduction of nervonic acid in plasma total phospholipids, especially in children who were Zn deficient. This was unexpected as previous studies have reported that Zn deficiency mainly affects n-6 FA composition. We provide evidence for the interaction between PZn and plasma total phospholipid FA composition in humans and our findings support the value of the LA:DGLA or DGLA:LA ratio as a potential biomarker of Zn status. Future research should investigate the impact of changes in Zn status on these ratios, and on nervonic acid concentrations, preferably through controlled Zn supplementation studies in Zn-deficient children and adults.
Acknowledgements
The authors thank the Beninese children who participated in the main study and their parents. Johanna van Wyk is greatly acknowledged for her technical assistance during FA analysis. The authors thank Natasa Mihajlovic for the PZn analysis and Jürgen Erhardt for the CRP and AGP analysis. The authors thank Vestergaard Switzerland for proving the filters and funding the main study, Nestlé Nutrition Institute for funding T. C.’s fellowship at ETH Zurich, the Nestlé Nutrition Institute Africa for the research grant, as well as the South African National Research Fund for awarding a scholarship to T. C.
Supported by Vestergaard Switzerland and Nestlé Nutrition Institute Africa.
T. C. involved in conceptualisation, performed data analyses and interpretation and wrote the manuscript; L. M. involved in data analysis and interpretation, revision of manuscript; J. B. conceptualised secondary study, involved in revision of manuscript; P. J. v. J. supervised FA analyses, cleaned FA data set, data interpretation and revision of manuscript; V. G. and D. M. conceptualised and conducted parent study research and revision of manuscript; C. M. S. data interpretation and revision of manuscript; M. B. Z. initiated and conceptualised the parent study. All authors read and approved the final version of the paper. None of the study funders had any involvement in the study design, analysis or interpretation of data; the writing of the report; or the decision to submit the article for publication.
None of the authors has any conflicts of interest to declare.
Supplementary Material
For supplementary material/s referred to in this article, please visit https://doi.org/10.1017/S000711451700366X


