


The colon hosts a complex bacterial community which provides a barrier to resist colonisation by pathogens, metabolises both dietary and endogenous substrates providing energy to the host in the form of SCFA, and plays a role in the development and maintenance of immunity( Reference Kau, Ahern and Griffin 1 ). It is widely stated that manipulating gut communities using diet can provide health benefits( Reference Kau, Ahern and Griffin 1 – Reference Claus and Swann 3 ). For example, feeding lactulose to patients with chronic liver disease improves health by reducing blood ammonia concentrations( Reference Salerno, Moser and Maggi 4 , Reference Morgan and Hawley 5 ) by increasing the demand for endogenous ammonia as a N source for gut bacteria( Reference Weber 6 ). Similarly, the prebiotic concept also claims that by selectively stimulating the growth of colonic bifidobacteria host health can be improved( Reference Gibson and Roberfroid 7 ). To date, there is little evidence supporting any specific health benefit for prebiotics in healthy subjects( Reference Lomax, Cheung and Tuohy 8 – Reference Dewulf, Cani and Claus 12 ), in contrast to emerging evidence concerning the negative effects of including rapidly fermented oligosaccharides in the diets of patients with a variety of pre-existing gut conditions( Reference Gibson and Shepherd 13 , Reference Halmos, Power and Shepherd 14 ).
Fructan prebiotics are polymers of fructose linked by a β2-1 glycosidic bond. These carbohydrates are found in grains, fruits and vegetables( Reference Singh and Singh 15 ) where they function as plant storage polymers( Reference Pollock and Cairns 16 ), and constitute a portion of daily fibre intake( Reference Coussement 17 ). As the β2-1 bond is resistant to cleavage in the small intestine, these pass into the colon where they are metabolised by the gut bacteria. Feeding β2-1 fructans increases the abundance of bifidobacteria in human faeces( Reference Gibson and Roberfroid 7 – Reference Clarke, Green-Johnson and Brooks 9 , Reference Dewulf, Cani and Claus 12 , Reference Bouhnik, Raskine and Simoneau 18 , Reference Ramirez-Farias, Slezak and Fuller 19 ). Purported benefits from promoting bifidobacteria growth include stimulation of host immunity( Reference Langkamp-Henken, Rowe and Ford 20 ), suppression of pathogens( Reference Hütt, Shchepetova and Loivukene 21 , Reference Fukuda, Toh and Taylor 22 ), decreased intestinal transit times( Reference Marteau, Cuillerier and Meance 23 ), as well as positive impacts on various pathologies( Reference Lindsay, Whelan and Stagg 24 – Reference Tsukahara, Iwasaki and Nakayama 26 ) and host physiology( Reference Davidson, Maki and Synecki 27 – Reference Le Blay, Michel and Blottière 29 ). Although clinical trials involving healthy subjects have confirmed the bifidogenic effect, they have failed to demonstrate any specific health link associated with this change( Reference Lomax, Cheung and Tuohy 8 – Reference Bouhnik, Flourié and Riottot 11 , Reference Ten Bruggencate, Bovee-Oudenhoven and Lettink-Wissink 30 ) and report only modest effects on immune activity( Reference Lomax, Cheung and Noakes 31 ). The most consistently observed impacts associated with β2-1 fructan supplementation in healthy subjects are increased flatulence, various forms of intestinal discomfort, and a loosening of the stool( Reference Lomax, Cheung and Tuohy 8 – Reference Bouhnik, Flourié and Riottot 11 , Reference Bouhnik, Raskine and Simoneau 18 , Reference Scholtens, Alles and Willemsen 32 ). Feeding β2-1 fructan may also reduce concentrations of branched-chain fatty acids and other secondary metabolites arising from protein fermentation in the colon( Reference Clarke, Green-Johnson and Brooks 9 , Reference Geboes, De Hertogh and De Preter 33 ), as well as increase faecal butyrate outputs( Reference Clarke, Green-Johnson and Brooks 9 , Reference Tsukahara, Iwasaki and Nakayama 26 , Reference Le Blay, Michel and Blottière 29 ).
Although the bifidogenic effect of β2-1 fructan is well documented, it is often claimed to be a selective effect( Reference Gibson and Roberfroid 7 ). Much less is known concerning the impacts of β2-1 fructan on the other bacterial species present within the faecal community. These polymers are metabolised by additional species isolated from faeces( Reference Van der Meulen, Makras and Verbrugghe 34 – Reference Oyarzabal and Conner 36 ), and more recent work has also noted effects on altering Faecalibacterium and Bacteroidetes levels in human faeces following the ingestion of β2-1 fructan( Reference Dewulf, Cani and Claus 12 , Reference Ramirez-Farias, Slezak and Fuller 19 ). Moreover, not only does the extent of the bifidogenic effect vary between individuals( Reference Macfarlane, Macfarlane and Cummings 37 ), but the response has also been observed following the feeding of other rapidly fermented oligosaccharides( Reference Macfarlane, Macfarlane and Cummings 37 – Reference Finney, Smullen and Foster 40 ).
Previously, we reported on the impacts of β2-1 fructan supplementation on immunological, physiological and psychological parameters across this cohort( Reference Clarke, Green-Johnson and Brooks 9 ). Here, we report the effects of β2-1 fructan supplementation on global change within these faecal bacterial communities and on the impacts of these changes on a range of host immunological and physiological parameters.
Methods
Study design
Subject recruitment, clinical orientation, written informed consent, enrolment, allocation, randomisation and blinding were undertaken as previously described( Reference Clarke, Green-Johnson and Brooks 9 ). Inclusion criteria for the trial were participants aged 18–50 years, in good general health, and a BMI of 18–30 kg/m2. Subjects taking medication or any health supplement, regular ingestion of high β2-1 fructan containing food products, known gastrointestinal diseases, food allergies, or intolerance to any ingredient in the treatments were excluded from the trial. There were thirty subjects who enrolled and completed both phases of the study (seventeen women and thirteen men). This trial was conducted in accordance with the guidelines laid down in the Declaration of Helsinki. All procedures were approved by the research ethics boards at Health Canada, McMaster University, University of Ontario Institute of Technology, and by the Canadian SHIELD Ethics Review Board. The study is registered as ‘Effects of fructan prebiotics on the intestinal microbiota’ at www.ClinicalTrials.gov (clinical trial identifier NCT01277445). The clinical trial spanned from 1 November 2010 to 5 April 2011 and was carried out at Nutrasource Diagnostics Inc.. Results assessing the impacts of β2-1 fructan on immunology, physiology and well-being across this cohort have previously been published( Reference Clarke, Green-Johnson and Brooks 9 ).
In brief, the study used a randomised, placebo-controlled, double-blinded, cross-over design where each subject supplemented their usual diet with a commercially available β2-1 fructan (Orafti® Synergy1 (BENEO), 50:50 mixture of inulin and short chain oligosaccharides) or placebo (maltodextrin). Subjects ingested 15 g/d total of each supplement (3×5 g ingested with each meal). Treatments were 28 d in duration, with a 14-d wash-out between supplement phases (Fig. 1). Faecal samples were collected at the beginning (day 0) and at the end (day 28) of each supplement phase, for a total of four collections per subject over the 70-d trial. Individual samples were stored at −20°C until processed. Repeated freeze-thaw of faecal samples was avoided; frozen subsamples of faeces were removed for distribution to team members for processing. Immediately before processing, the subsample was thawed, mixed to obtain homogenous slurries and weighed (approximately 1·0 g for each analysis).

Fig. 1 Consolidated Standard of Reporting Trials diagram: progress of subjects through the trial.
Review of the daily diaries kept by individual subjects over the duration of the clinical trial revealed that three subjects were prescribed oral antibiotics during the clinical trial. Antibiotics have been shown to impact faecal communities( Reference Dethlefsen, Huse and Sogin 41 ) and affected diversity of the faecal communities of these subjects (results not shown). It was also revealed that a fourth subject suffered from constipation, and consumed laxatives and an over-the-counter intestinal cleansing product for the duration of the trial. The faecal community of this individual was found to be more distantly related with time independent of treatment (results not shown). These four subjects were included in the analysis of cultivable faecal bacteria (Fig. 1; n 30), but not in assessments of faecal bacterial community change across the cohort (Fig. 1; n 26).
Cultivation-based analysis
Faecal processing and cultivation was undertaken in an anaerobic chamber with an atmosphere of CO2:H2 (90:10 % v/v). Faecal samples were weighed and recorded (about 1·0 g), blended using a stomacher in 9 ml of an anaerobic dilution solution( Reference Bryant and Robinson 42 ), and then serially diluted using the same solution. Aliquots from the dilution series were plated onto a modified L-10 agar( Reference Caldwell and Bryant 43 ) containing β2-1 fructan (Inulin, 2 % w/v; Sigma Chemical Co.) as the sole carbohydrate source. Cultures were incubated at 37°C for 72–96 h. The plated dilutions yielding 30–300 colony-forming units (CFU) were sampled, and 25–50 colonies were randomly selected and transferred to L-10 broth. Occasionally, colonies exhibiting an unusual colony morphology (i.e. from a separate dilution used to enumerate CFU) were also transferred onto L-10. Emphasis was placed on sampling all colony morphologies (two to six morphologies per faecal sample). Subcultures were maintained at 37°C for 48 h and streaked onto modified L-10 agar to confirm purity. Pure isolates were grown in L-10 liquid medium and stored as frozen glycerol (15 %, v/v) stocks (at −80°C). Isolates were identified by a combination GC analysis of the cellular fatty acids( Reference Miller 44 ) (MIDI, Inc.), and by sequencing of near full length 16S rRNA genes.
Isolation of faecal DNA
Faecal community DNA was isolated by first freeze grinding samples in liquid N2 as previously described( Reference Abnous, Brooks and Kwan 45 ). DNA was purified using the Qiagen faecal DNA isolation kit according to the manufacturer’s procedure for difficult to lyse bacteria and was isolated from two sub-samplings of each homogenised 1 d faecal collection. Isolated community DNA was quantified by spectrophotometry and stored frozen at −20°C.
Terminal restriction fragment length polymorphism community analysis
Terminal restriction fragment length polymorphism (T-RFLP) analysis of faecal communities was completed using the following primers based on 16S rDNA; 6-fam-44f, 5'-6-fam-GAGTTTGATCMTGGCTCAG-3' (IDT) and VIC-1492r, 5'-VIC-GGYTACCTTGTTACGACTT-3', HPLC purified (Life Technologies). The forward primer was modified( Reference Abnous, Brooks and Kwan 45 ) from its original design( Reference Lane 46 ). The forward primer was labelled with carboxyfluorescein (FAM) and the reverse primer was labelled with VIC. Each PCR reaction was prepared in triplicate, with each 20 µl reaction containing 10 ng community DNA (2 µl), 1X PCR buffer, 0·2 mm deoxynucleotides (dNTP), 0·2 µm forward primer (6-fam 27f), 0·2 µm reverse primer (VIC-1492r), 0·1 µg/µl bovine serum albumin, 0·5 U HotStar Taq Plus (Qiagen) and nuclease free water. PCR conditions were as follows: 5 min at 95°C for one cycle, twenty-five cycles at 94°C for 30 s, 53°C for 1 min 30 s and 72°C for 1 min, and one cycle at 72°C for 10 min. The 3–20 µl reactions were pooled and unincorporated primer and nucleotides removed using the PCR cleanup kit (Bio Basic). Cleaned PCR product was re-suspended in 50 µl nuclease free water. PCR products were first visualised on a 1 % Tris-acetate-EDTA buffer (TAE) gel and quantified by comparing to a standardised 100 bp DNA ladder (Promega), then 75 ng of PCR product were digested at 55°C for 1 h in a 25 µl reaction containing 12·5 µl MaeIII incubation buffer (Roche), 3 U of MaeIII and nuclease free water. Samples were precipitated by adding 2 µl of 3 m sodium acetate (pH 5·2) and 50 µl of 95 % ethanol, and maintaining the mixture at −20°C for 20 min. Samples were immediately centrifuged for 20 min at maximum speed, and the supernatant was removed. Pellets were washed with 500 µl of 70 % ethanol, centrifuged for 5 min, and supernatants removed. Pellets were allowed to dry completely, and re-suspended in 9·25 µl Hi-Di Formamide (Life Technologies) and 0·25 µl ROX 500 XL size standard (Life Technologies). Samples were denatured for 3 min at 95°C, chilled on ice, and loaded onto an ABI 3130 genetic analyzer (Life Technologies). Samples were then separated using a 36 cm column and POP7 matrix (Life Technologies). All samples were run in duplicate, but only terminal restriction fragments that were common to both runs were analysed (i.e. one composite T-RFLP profile per sample).
T-RFLP profiles were exported and peaks sized using Genemapper 4.0 software (Life Technologies) with the Local Southern size calling method (Applied Biosystems) as described previously( Reference Costa, Puhl and Selinger 47 ). Composite data was exported to T-REX( Reference Culman, Bukowski and Gauch 48 ), noise was subtracted and then a binary matrix was constructed. Euclidean distance between samples was calculated and principal component analysis (PCA) was applied (PRIMER-E Ltd). Statistical significance among groups was determined in PRIMER-E using permutational ANOVA( Reference Anderson 49 ). Analysis of bacterial community change was undertaken using Permanova using the Primer 7 analysis package (Primer-E Ltd). Permanova assumes equal variances between groups.
16S rRNA gene sequencing and analysis
Faecal community DNA samples were subjected to tag-encoded FLX amplicon sequencing (454 Life Sciences; Roche) undertaken by Research Testing Laboratory. Nucleotide bases 27–519 (relative to the Escherichia coli 16S rRNA gene) were targeted using the forward primer F44 and the reverse primer 519R and conditions as previously described( Reference Kalmokoff, Zwicker and O’Hara 50 ). Sequence files ranged from 4000 to 20 000 reads/sample. In files containing >5000 reads, 5000 sequences were randomly sampled using Mothur( Reference Schloss, Westcott and Ryabin 51 ). Files containing <5000 reads were processed in their entirety. DNA was isolated from two separate samplings (technical replicates) of each 1d faecal collection, both of which were sequenced. Sequence analysis was carried out previously described( Reference Kalmokoff, Zwicker and O’Hara 50 ). Sequences derived from each individual faecal sample were initially binned using ESPRIT( Reference Sun, Cai and Liu 52 ) using a cut-off which resulted in approximately 200 operational taxonomic units (OTU). OTU contained in each sample were checked for chimeras using Chimera-slayer implemented through Mothur( Reference Schloss, Westcott and Ryabin 51 ), with suspect sequences removed. Sequences were aligned against the Silva data base( Reference Quast, Pruesse and Yilmaz 53 ), and further binned into their closest matching phylotype. Subsequently, sequences were aligned using ClustalW, a nearest neighbour tree was generated using SeaView( Reference Gouy, Guindon and Gascuel 54 ), and sequences falling within a 3 % sequence divergence were binned together. Final sequences for each individual sample were then classified using Seq-match program available at the Ribosomal Database Project (RDP)( Reference Cole, Chai and Marsh 55 ). Sequences occurring less than three times in each data set or having an RDP coefficient of similarity of <0·8 were removed from further analysis. Samples from each individual were processed as a group then combined to identify shared phylotypes across all thirty subjects. Phylotype abundances in replicate faecal samples were averaged, before analysis.
Metagenomic analysis
Community DNA from four randomly selected subjects over the course of the trial was subjected to a shotgun-based metagenomic analysis. Library preparation and sequencing was carried out using standard protocols as recommended by the manufacturer (Illumina Inc.) and carried out at Genome Quebec. All raw reads were first used in a Blastn against the National Center for Biotechnology Information (NCBI) non-redundant nucleotide database. Each read was then binned based on its corresponding hit’s GenInfo Identifier (GI) number. The resulting bins, containing numerous reads, were then assembled into contigs with SPAdes version 3.6.0. Each contiguous sequence was used in a Blastx against the NCBI non-redundant amino acid database where the resulting Blastx reports were used as input for MEGAN( Reference Huson, Auch and Qi 56 ) and assigned to SEED (http://www.theseed.org) functional groups. Contiguous DNA sequences were also searched against the Carbohydrate-Active enZYmes (CAZy) database( Reference Cantarel, Coutinho and Rancurel 57 ).
Immunological and physiological measurements
Methods used in measuring the impact of β2-1 fructan supplementation on cytokines, immune cell population analysis and physiological markers have been previously described( Reference Clarke, Green-Johnson and Brooks 9 ). Lipopolysaccharide binding protein (LBP) was measured using the HK315 Human LBP ELISA kit (Hycult Biotech).
Statistical analysis
Associations between bacterial taxa and measured host parameters were tested by Pearson’s or Spearman’s (non-parametric) correlation analysis. Multiple P values obtained from the large number of individual correlation tests were corrected for false discovery rate using a step-down Bonferroni correction. A corrected P<0·050 was considered significant. Unless indicated, analyses were performed using SAS Enterprise Guide version 5.1 (SAS Institute Inc.).
The effect of β2-1 fructan induced community change over time on immune and other physiological parameters and was assessed by repeated measures ANOVA (type 3: treatment=repeated effect) with treatment, order and bacterial community profile as the main effects and with two interactions (treatment×bacterial community profile and treatment×order) included in the final model. Data were grouped by order to account for potential differences in the covariance structure of this parameter. Data were analysed as the difference (day 28−day 0) for the placebo and β2-1 fructan supplementation phases. When a significant treatment effect was observed, data were visually inspected to ensure that changes were associated only with the β2-1 supplementation phase (minimal changes occurred during the placebo supplementation phase). In cases when the data were not normally distributed, data were transformed using the Box-Cox procedure. When four or less observations were below the detection limit for a parameter, the data were analysed using the multiple Wilcoxon signed-rank test (Statistica version 7; StatSoft).
Ordinal and cluster analysis of 16S rRNA gene data, SEED and CAZy gene assignments were implemented using PC-ORD( Reference McCune and Grace 58 ) according to standard approaches for the analysis of ecological data( Reference Buttigieg and Ramette 59 ). Matrices of phylotype abundance and distributions at the phylum, class, order, family, genus and phylotype for each subject (n 26) or SEED and CAZyme assignments (n 4) at each sampling time were normalised and expressed as a percentage of the total bacterial community. Ordination analysis was implemented through PC-ORD with the analysis carried out in the auto-pilot mode (maximum 6-axis, 500 iterations). Optimal solutions were obtained using Non-metric Multidimensional Scaling (NMS) and a Euclidean distance measure. The primary sources of variation (changes in taxa in response to treatment) between the day 28 fructan faecal communities and all other faecal samples were identified using the joint-plot function in PC-ORD and an r 2 cut-off=0·250. As NMS axis are not always arranged in terms of order of effect, ordinations were also carried out using principal coordinates analysis (PCoA; Euclidean distance measure) to confirm that the primary sources of variation were oriented on their appropriate axis of the NMS plots. Group testing was carried out using the multi-response permutation procedure( Reference Mielke, Berry and Johnson 60 ) using a Euclidean distance measure and implemented in PC-ORD. Cluster analysis was also implemented using PC-ORD using a Euclidean distance measure and a group average linkage method.
Results
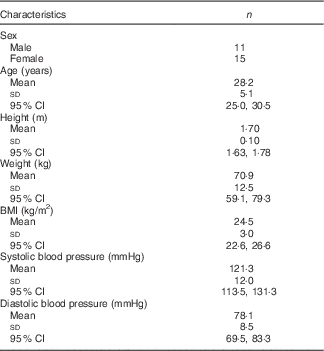
Subject characteristics have been previously published( Reference Clarke, Green-Johnson and Brooks 9 ); details concerning participant demographics (n 26) are shown in Table 1.
Table 1 Subject demographic data at study baseline (n 26) (Mean values and standard deviations and 95 % confidence intervals)
Inulin utilisation within the cultivable faecal community
In order to gain a more complete perspective on the species capable of utilising β2-1 fructan, faeces collected at the termination of each treatment phase (day 28) were subjected to anaerobic cultivation using a modified L-10 anaerobic medium containing inulin as the sole carbohydrate source. In total, eighty-seven species encompassing thirty genera and four phyla were isolated (Fig. 2; online Supplementary Table S1). Most isolates were closely related to previously characterised species, although several are likely to be new taxa based on their 16S rRNA gene sequence divergence with existing species (>3 %). Isolates within the genus Bifidobacterium were the most common (32 % of total), followed by Bacteroides (15 %), Ruminococcus (9 %), Enterococcus (9 %) and Blautia (6 %). The most abundant cultivated species was Bifidobacterium longum (13 % of total isolates). β2-1 fructan supplementation had only marginal effects on the abundance and composition of species isolated across all thirty subjects (Fig. 2).

Fig. 2 Heat plot showing the distribution of isolates at the genus and phylum level from the faeces of subjects fed the placebo (A) or β2-1 fructan supplement (B). Information on the specific species isolated is available in online Supplementary Table S1.
Terminal restriction fragment length polymorphism community analysis
Ordinal analysis (PCA) of T-RFLP profiles generated from day 28 faeces of subjects fed β2-1 fructan were compared with faecal community profiles from all subjects not receiving this supplement (placebo days 0 and 28, and fructan day 0). A difference in community structure was observed (P=0·022; Fig. 3(a)).

Fig. 3 Ordinal plots comparing faecal community structure between the day 28 samples from subjects fed β2-1 fructan with the controls (days 0 and 28 placebo, day 0 β2-1 fructan). Faecal communities from subjects fed β2-1fructan (day 28) are indicated by black triangles and controls by grey triangles. (a) Principal component analysis plot comparing faecal terminal restriction fragment length polymorphism profiles. Groups were different (P=0·022). (b–d) Non-metric Multidimensional Scaling plots comparing faecal community structure at the family taxonomic level over the three primary axes. Lineages primarily responsible for variation between communities (r 2>0·250) are indicated by joint plots. The length of the arrows indicates the relative strength of each factor and the direction of the arrow the axis of orientation. Corresponding correlation coefficients for each factor are available in Table 3.
Sequence-based analyses of faecal communities
In total, 387 phylotypes were identified in faecal communities from twenty-six subjects (online Supplementary Table S2 and S3). These aligned into eight phyla, although four (Firmicutes>Bacteroidetes>Actinobacteria>Proteobacteria) encompassed the majority of faecal community diversity. Faecal community composition was unique to each individual and this did not change with treatment (online Supplementary Fig. S1). Previously, we determined levels of bifidobacteria in the faecal samples from each subject by quantitative PCR (qPCR) over the entire trial( Reference Clarke, Green-Johnson and Brooks 9 ). In order to corroborate the 16S rRNA gene-based analysis, we compared qPCR results with those derived from the sequence data (Fig. 4). The 16S rRNA gene sequence-based analysis over-estimated relative bifidobacteria content by approximately 2-fold, although the increased 16S rRNA gene content with β2-1 fructan supplementation was consistent with previously reported qPCR analysis( Reference Clarke, Green-Johnson and Brooks 9 ).

Fig. 4 Abundance of bifidobacteria (% of total community) in faeces of subjects fed β2-1 fructan (days 0 and 28) or maltose (days 0 and 28) as determined by quantitative PCR (qPCR)(
Reference Clarke, Green-Johnson and Brooks
9
) and by analyses of 16S rRNA gene libraries. ![]() , qPCR control;
, qPCR control; ![]() , qPCR β2-1 fructan;
, qPCR β2-1 fructan; ![]() , 16S rRNA control;
, 16S rRNA control; ![]() , 16S rRNA β2-1 fructan.
, 16S rRNA β2-1 fructan.
Faecal community change in response to β2-1 fructans
Faecal communities from subjects fed β2-1 fructan (day 28) were less species rich than the corresponding day 0 and placebo phase samples (Table 2). Changes in faecal community structure in response to supplement (day 28 β2-1 fructan v. all other samples) were initially examined using ordinal analysis (NMS) and group testing, an approach commonly used in the analysis of ecological data( Reference Buttigieg and Ramette 59 ). Comparisons at the phylum, class, order and family levels are summarised in Table 3, and the ordinal analysis at the family level is presented in Fig. 3(b)–(d). No reasonable ordinal solution was found at the phylotype level. Differences between the day 28 β2-1 fructan faecal communities and all other communities were only observed at the genus level (P=0·026). However, this result must be viewed with caution as the ordinal solution was not only of lower quality (stress=0·160), but substantial information was also lost due to the exclusion of phylotypes not assigned to specific genera.
Table 2 Estimates of species richness (Abundance-based Coverage Estimator (ACE)( Reference Chao and Lee 61 )) in the faecal communities of subjects (twenty-six) supplemented with β2-1 fructan (day 28) and controls (days 0 and 28 placebo, day 0 β2-1 fructan)Footnote * (Mean values with their standard errors)
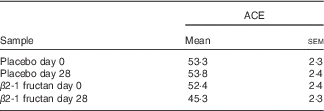
* Subjects fed β2-1 fructan are less rich than the control communities (P=0·002).
Table 3 Identification of taxa responsible for variation in the faecal communities in response to β2-1 fructan supplementationFootnote *

MRPP, multi-response permutation procedure; NMS, Non-metric Multidimensional Scaling.
* Comparisons are between day 28 of the β2-1 fructan phase with the corresponding day 0, days 0 and 28 of the placebo phase (n 26). Ordinal analysis (NMS) at the family level is shown in Fig. 3.
† Correlation coefficients (r 2) for the primary lineages contributing to community variation (joint plots) on NMS ordinal plots. Only those r 2>0·250 are shown.
‡ Group testing (day 28 fructan community v. all others) as determined using MRPP using a Euclidean distance measure. NS: P>0·050.
In order to more clearly understand the impact of β2-1 fructan supplementation on faecal community change, we first identified the taxa contributing the largest portion of community variation at each level of the taxonomic hierarchy between the day 28 β2-1 fructan supplemented faecal community and all other faecal samples (Table 3, Fig. 3). At phylum, class, order and family levels two lineages represented the largest sources of variation between the day 28 β2-1 fructan phase and all other samples, and these were Bacteroidetes (Bacteroidia, Bacteroidales, Bacteroidaceae) and Firmicutes (Clostridia, Clostridiales, Ruminococcaceae). Respective abundance of bacteria within these two phyla were also negatively correlated with each other (online Supplementary Fig. S2(A)). Although additional lineages also contributed to variation within the community (Actinobacteria, Bacilli), these were not dominant effects as their corresponding biplots aligned parallel with the second or third axis of both NMS (Table 3) and PCoA ordinal plots (results not shown).
At the family level, change in the abundance of the Bacteroidaceae was the primary source of variation between the day 28 β2-1 fructan communities and all other samples (Table 3, Fig. 3). Dividing the cohort on this basis revealed two primary patterns in the community response to β2-1 fructan supplementation. In nine subjects, the abundance of phylotypes aligning with Bacteroidetes increased, whereas those aligning within Lachnospiraceae and Ruminococcaceae (primarily the genus Faecalibacterium) decreased (Fig. 5). In the remaining subjects (17/26), β2-1 fructan supplementation tended to decrease the abundance of phylotypes aligning in the family Bacteroidaceae while phylotypes aligning with Lachnospiraceae, Ruminococcaceae (genus Faecalibacterium) and Lactobacillaceae increased (Fig. 5). The subjects falling into the first pattern could be further separated into those where the increase in Bacteroidaceae fell primarily within the genus Bacteroides (5/9; Fig. 5(a)) and those where the increase fell within the family Prevotellaceae (4/9; Fig. 5(b)). Relative bifidobacteria levels increased in response to β2-1 fructan supplementation and this was particularly noted in those subjects where Bacteroidetes trended downward (Fig. 5(c)). Communities in those subjects (17/26) who responded to β2-1 fructan by decreasing the content of Bacteroidetes were different from those who responded by increasing abundance within this lineage (9/26; P=0·027). Subjects who responded to β2-1 fructan by increasing faecal Bacteroidetes content are indicated in online Supplementary Table S3.

Fig. 5 Change in relative content (% of total 16S rRNA genes) of family lineages contributing the largest portion of variation. Comparisons are between β2-1 fructan (day 28) faecal communities and control communities (mean of days 0 and 28 of the placebo phase and day 0 of the β2-1 fructan phase). Subjects (n 9) where Bacteroidetes levels trend upwards in response to β2-1 fructan: (a) Bacteroidaceae or (b) Prevotellaceae. Subjects (n 17) where Bacteroides levels tend downwards in response to β2-1 fructan (c). Values are means and standard deviations represented by vertical bars. ![]() , Bacteroidaceae;
, Bacteroidaceae; ![]() , Prevotellaceae;
, Prevotellaceae; ![]() , Lachnospiraceae;
, Lachnospiraceae; ![]() , Ruminococcaceae;
, Ruminococcaceae; ![]() , Bifidobacteriaceae;
, Bifidobacteriaceae; ![]() , Lactobacillaceae.
, Lactobacillaceae.
Community change and its impact on host immune and physiological parameters
A correlation analysis was undertaken to identify potential relationships between intestinal community lineages and previously reported immunologic parameters (sCD40L, granulocyte colony-stimulating factor (G-CSF), granulocyte-macrophage colony-stimulating factor (GM-CSF), interferon-γ, IL-1β, IL-1Ra, IL-4, IL-6, IL-8, IL-10, IL12p70, IP-10, TNF-α, active and total transforming growth factor-β1 concentrations, percentages of CD282+ and CD284+ mDC and granulocytes), circulating physiological markers (C-reactive protein, blood urea N, serum lipopolysaccharide (LPS) and LBP), faecal SCFA, and self-reported health complaints. Few significant associations were detected, although positive correlations between the content of faecal Bacteroidetes and faecal propionate were observed (online Supplementary Fig. S2(B); Table 4). Subjects having lower faecal Bacteroidetes content exhibited higher serum LPS and LBP concentrations independent of treatment (Table 5), whereas those with increased faecal Bacteroidetes produced more faecal caproic acid independent of treatment (Table 5).
Table 4 Correlations between the faecal bacterial community and various host parameters
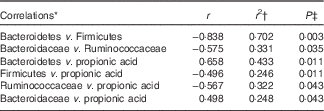
* Pearson’s correlation.
† Only those having r 2≥0·250 have been reported.
‡ Corrected for false discovery rate (FDR) using a step-down Bonferroni.
Table 5 Relationships between the faecal bacterial community and various host parametersFootnote * (Mean values with their standard errors (according to community profile))
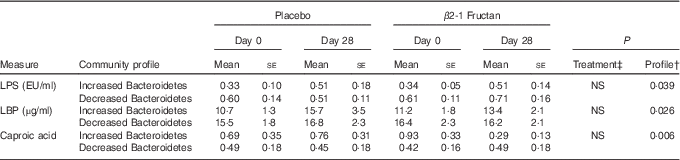
LPS, lipopolysaccharide; LBP, lipopolysaccharide binding protein.
* Increased Bacteroidetes: n 9, decreased Bacteroidetes: n 17.
† Differences tested using raw data.
‡ Differences between treatment phases tested using normalised values ((days 28–day0)/day 0).
Metagenomic analysis
In order to gain insight into the effect of β2-1 fructan supplementation on the faecal community metagenome, we carried out high-throughput sequencing and assembly of shotgun clones from faecal communities of four subjects (Subjects 1, 6, 24 and 25) over the entire duration of the trial. These four subjects were representative of the primary changes identified in the cohort in response to β2-1 fructan supplementation (online Supplementary Fig. S3). Gene assignments into the major SEED categories were similar among subjects, despite the differences in faecal community composition (online Supplementary Fig. S4 and Table S5). Similar to previous examinations of human faecal communities, metagenomes were enriched in genes involved in the metabolism of carbohydrates and depleted in those encoding motility and chemotaxis( Reference Kurokawa, Itoh and Kuwahara 62 ). Cluster analysis of SEED gene assignments for each faecal sample is shown in Fig. 6(a). Group testing found no relationship between clusters and treatment (P=0·816), although the metagenome of subject 6 was marginally different from the other subjects (P=0·044). Contiguous DNA sequences were also compared against the CAZy database to examine potential changes in glycosyl-hydrolase (GH) capabilities of these communities (online Supplementary Table S6). GH profiles clustered by subject and were different (P<0·008; Fig. 6(b)). However, GH profiles in the day 28 β2-1 fructan phase were not different from the other samples within each subject, suggesting that differences in clustering within individual subjects likely reflect temporal variability associated with each subject’s faecal community.

Fig. 6 Cluster diagrams showing the relationships among faecal metagenomes (a) and CAZyme gene assignments (b) from Subjects 1, 6, 24 and 25. ![]() ,
, ![]() ,
, ![]() and
and ![]() , Day 28 β2-1 fructan faecal communities;
, Day 28 β2-1 fructan faecal communities; ![]() ,
, ![]() ,
, ![]() and
and ![]() , corresponding controls (day 0 β2-1 fructan, days 0 and 28 placebo). Subjects and their corresponding symbols are identified on the right of the figure. SEED assignments are available in online Supplementary Table S5. CAZyme assignments are available in online Supplementary Table S6. Clustering was carried out using a Euclidean distance measure and a group average linkage method.
, corresponding controls (day 0 β2-1 fructan, days 0 and 28 placebo). Subjects and their corresponding symbols are identified on the right of the figure. SEED assignments are available in online Supplementary Table S5. CAZyme assignments are available in online Supplementary Table S6. Clustering was carried out using a Euclidean distance measure and a group average linkage method.
Discussion
Supplementing humans with β2-1 fructan increases the abundance of faecal bifidobacteria( Reference Gibson and Roberfroid 7 – Reference Clarke, Green-Johnson and Brooks 9 , Reference Bouhnik, Flourié and Riottot 11 ) and this has generally been attributed to the selective ability of this genus to utilise this substrate( Reference Gibson and Roberfroid 7 ). We observed no increase in the abundance of cultivable bifidobacteria in response to β2-1 fructan feeding, although our analysis was undertaken using a non-selective medium rather than one designed for enumeration of bifidobacteria. Although species within this genus were the most abundant β2-1 fructan utilizers, we also isolated a wide range of additional species sharing this ability, some of which are previously known to metabolise β2-1 fructans( Reference Van der Meulen, Makras and Verbrugghe 34 – Reference Oyarzabal and Conner 36 ). The phenotype also appears very common in species throughout the Actinobacteria, Firmicutes and Proteobacteria, and together challenges the perspective regarding the selective nature of this substrate.
We examined the effect of β2-1 fructan on faecal community structure and composition in healthy subjects using two molecular-based approaches. In the first case, analysis of T-RFLP profiles showed that consuming supplemental β2-1 fructan altered faecal community structure. Our second approach based on the analysis of community 16S rRNA genes failed to detect any differences between treatments, although we did note that β2-1 fructan reduced faecal community phylotype richness. Typically, 16S rRNA gene data are treated as quantitative data. However, there is a need to apply a degree of caution when interpreting results from this type of analysis as the method suffers limitations( Reference Thomas, Thomas and Kalmokoff 63 ), and even under optimised conditions community structures are distorted to varying degrees due to differences in 16S rRNA gene copy numbers between different taxa( Reference Stoddard, Smith and Hein 64 ). In order to understand the global impact of β2-1 fructan supplementation, we first identified the bacterial lineages contributing the most community variation in response to treatment. The single largest source of variation lay within the Bacteroidetes. Based on changes in the relative abundance within this lineage, we identified two primary responses to feeding β2-1 fructan. Interestingly, bifidobacteria were found to be one of the lesser sources of community variation, unexpected given that change within this taxon is widely accepted as a marker for the prebiotic effect( Reference Gibson and Roberfroid 7 , Reference Macfarlane, Macfarlane and Cummings 37 ). Overall, the trends towards increased bifidobacteria and Faecalibacterium, and decreased Bacteroidetes observed in the majority of subjects are consistent with more recent work carried out in human beings fed β2-1 fructans( Reference Dewulf, Cani and Claus 12 , Reference Ramirez-Farias, Slezak and Fuller 19 , Reference Kleessen, Schwarz and Boehm 65 ). In contrast, the response in those subjects where faecal Bacteroidetes increased was similar to the response observed in female rats fed β2-1 fructan( Reference Shastri, McCarville and Kalmokoff 66 ).
Diet mediated change in intestinal communities is generally viewed strictly in terms of carbohydrate availability, and the contribution of gut N as a factor affecting community structure is often overlooked( Reference Kalmokoff, Zwicker and O’Hara 50 , Reference Faith, McNulty and Rey 67 , Reference Kalmokoff, Franklin and Pertronella 68 ). In rats, diet mediated changes to bacterial community structure can also be driven by changes in the availability of N (ammonia v. peptidyl N) used to support bacterial growth. For example, rat caecal and faecal communities have higher Bacteroidetes content when ammonia is the primary N source used to support growth, whereas increasing peptidyl N availability drives Bacteroidetes content down and Lachnospiraceae content up( Reference Kalmokoff, Zwicker and O’Hara 50 , Reference Shastri, McCarville and Kalmokoff 66 , Reference Kalmokoff, Franklin and Pertronella 68 ). These diet mediated responses observed in rats share similarities with the two patterns of faecal community change that we observed in humans ingesting β2-1 fructan. This raises the question of whether the bifidogenic effect, as well as the other associated community changes, might partially reflect changes in fixed N availability in the large intestine as opposed to a selective growth stimulation resulting from the fermentation of β2-1 fructan. Interestingly, the response of Faecalibacterium mirrored that of bacteria within the family Lachnospiraceae, which suggests a dependence on peptidyl N as the preferred N source in this species.
An important limitation with studies examining the effect of diet on human intestinal communities is the dependence on faecal samples. We have little to no information on how different fermentable substrates affect the bacterial communities in the human proximal colon. In rats, the fermentation of β2-1 fructan is both rapid and occurs primarily in the caecum( Reference Campbell, Fahey and Wolf 28 ). In human beings, fermentation likely occurs in the proximal (ascending) colon based on results from breath H analysis using inulin( Reference Schneider, Jepp and Murczynski 69 ), and the fact that this represents the most active site for fermentation( Reference Macfarlane, Gibson and Cummings 70 ). In rats, the intensity of the caecal fermentation of β2-1 fructan increases mucin excretion, and reduces barrier integrity as indicated by increased translocation of enteric bacteria( Reference Kleessen, Hartmann and Blaut 71 – Reference Ten Bruggencate, Bovee-Oudenhoven and Lettink-Wissink 74 ). Similarly, we observed changes in various host parameters in subjects administered β2-1 fructan consistent with a reduction in intestinal barrier function( Reference Clarke, Green-Johnson and Brooks 9 ). Moreover, mucin excretion in response to β2-1 fructan has been previously observed in human subjects( Reference Ten Bruggencate, Bovee-Oudenhoven and Lettink-Wissink 30 ), although not all studies have shown this( Reference Scholtens, Alles and Willemsen 32 ). However when considered together, it is not unreasonable to suggest that the response in humans to β2-1 fructan shares many similarities with the well documented response in rats.
Although increases in bifidobacteria are consistent with the widely held view that the enrichment is attributable to their selective ability to metabolise β2-1 fructans( Reference Gibson and Roberfroid 7 ), we suggest that the community changes observed here might be better explained on the basis of mucin foraging in the descending colon. First, the ability to ferment mucin, the O-side chain, or the carbohydrate constituents by various intestinal bacteria( Reference Tailford, Crost and Kavanaugh 75 ), including bifidobacteria( Reference Milani, Turroni and Duranti 76 , Reference Ruas-Madiedo, Gueimonde and Fernández-García 77 ), Bacteroides ( Reference Salyers, Vercellotti and West 78 ) and Faecalibacterium ( Reference Lopez-Siles, Khan and Duncan 79 ) is well established. Second, mucin being a glycoprotein also represents a source of peptidyl N and its presence in the descending colon due to sloughing would be consistent with the dominant pattern of change observed across the cohort consuming β2-1 fructans. In fact, the two primary patterns of bacterial community response observed across our cohort might ultimately reflect differences in inter-individual variation in the extent of mucin sloughing in response to feeding this rapidly fermented substrate. A distal colonic fermentation affected by mucin availability not only resolves the dilemma regarding the selective effects of a substrate which is metabolised by a very wide range of intestinal bacteria, but also why a bifidogenic response occurs following the feeding of other rapidly fermented oligosaccharides( Reference Macfarlane, Macfarlane and Cummings 37 – Reference Finney, Smullen and Foster 40 ), as well as the variation in the extent of the bifidogenic effect observed amongst individuals( Reference Macfarlane, Macfarlane and Cummings 37 ).
Although β2-1 fructan supplementation altered the faecal bacterial community of these subjects, we observed few relationships between community changes and host parameters. However, a relationship between the abundance of Bacteroidetes and concentrations of faecal propionate was observed, consistent with a previous study in humans( Reference Salonen, Lahti and Salojärvi 80 ). We also observed a relationship between subjects having lower faecal Bacteroidetes content and increased serum LPS and LBP concentrations, which occurred independently of treatment. LBP binds LPS and other bacterial wall components forming a complex that interacts with CD14 mediating the activation of peripheral blood monocytes via TLR4( Reference Zweigner, Schumann and Weber 81 ). Normally LBP is present in serum at concentrations ranging from 5–15 µg/ml; these subjects being at the higher end of the normal range. Although these findings may be coincidental, they do suggest a difference in gut barrier functionality between the two response groups within the cohort.
In conclusion, we have examined faecal community change in a cohort of healthy human subjects supplemented with β2-1 fructan. Although we observed two primary patterns of response in the faecal communities of these subjects, these changes were nonetheless consistent with previous work in both rats and human subjects( Reference Dewulf, Cani and Claus 12 , Reference Ramirez-Farias, Slezak and Fuller 19 , Reference Shastri, McCarville and Kalmokoff 66 ). Changes in faecal bacterial community structure may be affected by mucin availability with the two patterns of change reflective of differences in the availability of peptidyl N in the distal colon. Overall, the extent of change in the faecal bacterial communities of subjects was quite modest, and this is supported by the metagenome and CAZyme profiles where no discernable treatment effect was observed. The prebiotic health claim is based on establishing a link between a change in the intestinal community and a repeatable/measurable health effect( Reference Pineiro, Asp and Reid 82 ), although a correlation could also be considered as supporting evidence( Reference Brooks and Kalmokoff 83 ). Although it has been argued that shifting fermentation distally to provide SCFA to the distal colon through mucin fermentation( Reference Van den Abbeele, Gérard and Rabot 84 ), or that reducing concentrations of secondary metabolites from fermentation of proteins is beneficial( Reference Clarke, Green-Johnson and Brooks 9 , Reference Geboes, De Hertogh and De Preter 33 ), these potential benefits should be considered against the impact of the β2-1 fructan fermentation on reducing intestinal barrier function( Reference Clarke, Green-Johnson and Brooks 9 , Reference Ten Bruggencate, Bovee-Oudenhoven and Lettink-Wissink 30 , Reference Ten Bruggencate, Bovee-Oudenhoven and Lettink-Wissink 74 ). Moreover, similar effects would be shared with other rapidly fermented carbohydrates. Although it remains possible that a health effect may be discovered in studies examining larger cohorts, our findings( Reference Clarke, Green-Johnson and Brooks 9 ) as well as those of others( Reference Lomax, Cheung and Tuohy 8 , Reference Slavin and Feirtag 10 , Reference Bouhnik, Flourié and Riottot 11 , Reference Ten Bruggencate, Bovee-Oudenhoven and Lettink-Wissink 30 ) do not support the premise that dietary β2-1 fructans confer a demonstrable health benefit in healthy adult human subjects.
Acknowledgements
The authors wish to thank Fernando Matias (Health Canada), Mark Ritchie and Jenny Gusse (AAFC Kentville and Lethbridge respectively) for their excellent technical assistance.
This trial was undertaken with financial support from Agriculture and Agri-Food Canada (RPBI no. 1501, M. K., G. D. I., L. J. Y.), Health Canada (S. P. J. B.), Alberta Innovates Bio Solutions (G. D. I., L. J. Y., M. K., S. P. J. B., J. M. G.-J.), and the Advanced Food and Materials Network (M. K.) and the National Science and Engineering Research Council (J. M. G.-J.).
Researchers in this group were involved in the original conception of the project (J. M. G.-J., D. D. R., P. B., G. D. I., L. J. Y., S. P. J. B., M. K.). D. D. R. and J. G. organised and supervised the clinical trial. G. D. I. was responsible for the T-RFLP analysis and sequencing of the 16S rRNA gene of cultivated bacteria, L. J. Y. carried out isolation of bacteria and the cultivation-based analysis, N. P. and M. K. were responsible for the sequence-based analyses. S. T. C. and S. P. J. B. undertook and provided the statistical analyses. S. T. C., J. M. G.-J. and M. K. prepared the first draft of the manuscript. All additional authors (S. P. J. B., D. D. R., P. B., G. D. I., J. G., L. J. Y., N. P. and L. B. S.) contributed to the final content of the manuscript.
All authors declare that there are no conflicts of interest.
Supplementary material
For supplementary material/s referred to in this article, please visit https://doi.org/10.1017/S0007114517002318


