


Owing to the recent and rapid rise in the number of overweight and obese people, it is thought that changing environmental factors such as dietary choices or lifestyle habits are the predominant cause for this epidemic. One potentially key environmental change that has occurred in concert with the obesity epidemic is an increase in eating frequency (the number of eating occasions)( Reference Popkin and Duffey 1 ). However, the association between eating frequency and energy intake, energy density, diet quality, BMI and waist circumference in a population-based nationally representative study has not been well studied.
Increasing eating frequency could possibly influence energy intake through improved appetite control. To date, the relationship between eating frequency and energy intake is not clear, with results reporting that increased eating frequency is associated with reduced food intake( Reference Aljuraiban, Chan and Griep 2 ), whereas another study found that increased eating frequency is associated with increased food intake( Reference Mills, Perry and Reicks 3 ). It has also been suggested that eating frequency could affect diet-induced thermogenesis, although the results are inconsistent. Although a short-term (<24 h) study has suggested that increased eating frequency results in increased thermogenesis( Reference Leblanc, Mercier and Nadeau 4 ), other studies have reported that increasing eating frequency decreases thermogenesis( Reference Tai, Castillo and Pisunyer 5 , Reference Westerterp-Plantenga, Goris and Meijer 6 ) or has no effect( Reference Belko and Barbieri 7 ). Longer-term studies (7 d) using doubly labelled water have consistently reported no effects of eating frequency on energy expenditure( Reference Verboeket-van de Venne, Westerterp and Kester 8 , Reference Verboeket-van de Venne and Westerterp 9 ).
Similar to short-term studies of the components of energy balance, studies that have investigated the association between eating frequency and body weight status also provide inconsistent data. Epidemiological studies have reported an inverse association( Reference Aljuraiban, Chan and Griep 2 , Reference Franko, Striegel-Moore and Thompson 10 , Reference Smith, Blizzard and McNaughton 11 ), no association( Reference Mills, Perry and Reicks 3 , Reference Hartline-Grafton, Rose and Johnson 12 ) or a positive association( Reference Howarth, Huang and Roberts 13 ) between eating frequency and body weight status. These discrepant findings may be due to differences in the definition of eating frequency, differences in the measurement of eating frequency or the lack of adjustment for potential confounders( Reference Bellisle, McDevitt and Prentice 14 , Reference Kant 15 ). Only a limited number of randomised-controlled trials have been conducted thus far; they have reported that manipulating eating frequency had no effect on weight loss after intervention of 8 weeks( Reference Cameron, Cyr and Doucet 16 ) or 6 months( Reference Bachman and Raynor 17 ). These studies focused on weight loss efficacy and were not representative of the wider population. Consequently, the results may be of limited relevance for efforts to optimise the diet for the general public. Further research, especially using nationally representative data, is warranted to investigate the relationship between eating frequency and diet and body weight status.
Methods
Data source and study population
Data from the 2009–2010 and 2011–2012 National Health and Nutrition Examination Survey (NHANES) were combined and used in this study. The NHANES is a survey conducted by the National Center for Health Statistics for the assessment of health and nutritional status of non-institutionalised residents in the USA; selected participants were invited for the interview and physical examinations( 18 ). At the mobile examination centre, participants were asked to provide a 24-h dietary recall; a second dietary recall was obtained by telephone interview 3–10 d later. The NHANES dietary recall was administered using the United States Department of Agriculture (USDA) Automated Multiple-Pass Method( Reference Blanton, Moshfegh and Baer 19 ), and participants were provided with a standard set of measuring guides to help estimate food portion sizes. Dietary recall data were processed using the USDA’s Food and Nutrient Database for Dietary Studies; details of sampling methodology, survey instruments, study protocols and data sets are available on the NHANES website( 18 ). The NHANES study was conducted according to the guidelines laid down in the Declaration of Helsinki, and all procedures involving human subjects were approved by the National Center for Health Statistics Research Ethics Review Board. Written informed consent was obtained from all the participants.
Participants aged ≥20 years with a complete first 24-h dietary recall were initially included in this study (n 10 563). Of these, 2772 participants were excluded if they met one or more of the following criteria: were pregnant or lactating (168 participants), were on a special diet either to lose weight or for some other health-related reason (1520 participants) or had missing data on any covariates or outcome variables (1310 participants). The final sample size of the present study included 7791 eligible adults (4017 men and 3774 women).
Exposure and outcome variables
Self-reported time of consumption of each food or beverage in response to the question ‘what time did you begin to eat/drink the meal/food?’ in the first 24-h dietary recall was used to estimate eating frequency. An eating occasion was defined such that it contained at least 210 kJ and the time interval between eating occasions was more than 15 min( Reference Gibney and Wolever 20 ). This definition was chosen because recent studies that examined various definitions of eating occasion revealed it was the one that best predicted variance in total energy intake( Reference Leech, Worsley and Timperio 21 ) or provided the strongest correlation with total energy intake( Reference Murakami and Livingstone 22 ).
Total energy intake from the first dietary recall, BMI and waist circumference were directly obtained from the NHANES data set. Energy density was calculated by dividing total energy of dietary items by total weight of dietary items( Reference Kant and Graubard 23 – Reference Zhu and Hollis 25 ). Three types of energy density were examined in this study: using foods only, using foods and beverages excluding water and using foods and beverages including water. Milk and milk drinks, fruit juice, vegetable juice, alcoholic beverages and non-alcoholic beverages (coffee, tea, soft drinks, etc.) were considered as beverages( Reference Zhu and Hollis 25 ).
Diet quality was estimated as the Healthy Eating Index 2010 (HEI-2010)( Reference Guenther, Casavale and Reedy 26 ). The HEI-2010 was developed as a parameter for compliance with the 2010 Dietary Guidelines for Americans; it consists of nine adequacy food components and three moderation food components; the total score ranges from 0 to 100, a higher score indicates better diet quality or better compliance with the dietary guidelines( Reference Guenther, Casavale and Reedy 26 ).
Covariates
Socio-demographic characteristics including age, race/ethnicity and ratio of family income:poverty, as well as lifestyle factors such as physical activity level and smoking status, were used as covariates. Classifications of these variables were the same as the approach used in a previous study( Reference Zhu and Hollis 27 ). In brief, race/ethnicity was classified as Hispanic, non-Hispanic white, non-Hispanic black or other; ratio of family income:poverty was coded to a categorical variable as ≤1·85, 1·86–3·50, >3·50; physical activity level was classified as vigorously active, moderately active or sedentary, which was estimated from answers to questions ‘does your work involve vigorous-intensity activity that causes large increases in breathing or heart rate for at least 10 min continuously’ and ‘do you do any moderate-intensity sports, fitness or recreational activities that cause a small increase in breathing or heart rate for at least 10 min continuously’; and smoking status was coded as non-smoker, former smoker or current smoker. Moreover, total energy intake was also adjusted for in the analysis where appropriate.
Statistical analysis
SAS version 9.3 (SAS Institute) was used for statistical analysis; 4-year sample weight and specific SAS survey procedures were used to account for the complex multistage design of the NHANES. As a previous study reported sex-specific associations between eating frequency and cardiometabolic risk factors( Reference Smith, Blizzard and McNaughton 11 ), data for men and women were analysed separately in the main analyses to examine potential sex-specific differences. Characteristics of participants were compared between sexes by survey χ 2 tests for categorical variables and by survey linear regression for continuous variables. Survey multivariate linear regression was used to estimate covariate-adjusted associations between eating frequency and each outcome of interests. Data were presented as weighted percentages, least squares means or regression coefficients with their standard errors, where appropriate. The statistical significance was considered as P<0·05.
Two sensitivity analyses were conducted to determine associations between eating frequency and total energy intake, energy density, the HEI-2010 total score, BMI and waist circumference. First, a pooled analysis combining data from men and women was conducted, with sex as an additional covariate in the statistical model. Second, the associations were analysed using the second 24-h dietary recall data from participants whose complete data were available.
Results
Characteristics of the participants
The average eating frequency was 4·48 (se 0·03, range 1–10) in men and 4·38 (se 0·03, range 1–12) in women. Characteristics of the participants (men and women) are presented in Table 1. Significant sex differences were found in race/ethnicity, ratio of family income:poverty, physical activity, smoking status and age (P<0·05 for all). The difference in BMI was not significant between men and women (P=0·430); however, men had a significantly greater waist circumference than women (P<0·001). Men also had significantly higher total energy intake and higher energy density (except when water was not included in the calculation of energy density), as well as a significantly lower HEI-2015 total score, compared with women (P<0·05 for all). Examination of individual component scores of the HEI-2015 revealed that men were less compliant to the dietary guidelines compared with women for most types of foods (Table 1).
Table 1 Characteristics of the participants (Weighted percentages, least squares means with their standard errors)

HEI-2010, Healthy Eating Index 2010.
* P value for comparisons between men and women.
† Energy density calculated as energy from all food items divided by weight of all food items.
‡ Energy density calculated as energy from all food items and beverages excluding water divided by weight of all food items and beverages excluding water.
§ Energy density calculated as energy from all food items and beverages including water divided by weight of all food items and beverages including water.
Energy intake and energy density
There was a significant positive association between eating frequency and total energy intake in both men and women (both P<0·001, Table 2). A significant inverse association between eating frequency and energy density was found in both men and women; this was observed regardless of inclusion of water and beverages in the calculation of energy density (P<0·01 for all, Table 2).
Table 2 Associations between eating frequency and energy intake and energy density (Regression coefficients with their standard errors)
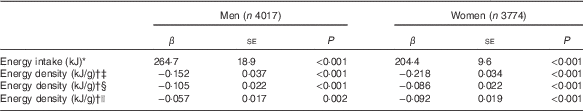
* Adjusted for age, race/ethnicity, ratio of family income:poverty, physical activity level and smoking status; β is the change in the outcome variable for each unit increase of eating frequency when adjusting for covariates.
† Adjusted for age, race/ethnicity, ratio of family income:poverty, physical activity level, smoking status and energy intake.
‡ Energy density calculated as energy from all food items divided by weight of all food items.
§ Energy density calculated as energy from all food items and beverages excluding water divided by weight of all food items and beverages excluding water.
|| Energy density calculated as energy from all food items and beverages including water divided by weight of all food items and beverages including water.
Diet quality
Associations between eating frequency and the HEI-2010 total score and each component score are shown in Table 3. A significant positive association between eating frequency and diet quality was observed in both men and women (both P<0·001). Significant positive associations were also observed for most adequacy component scores, including total fruit, whole fruit, whole grains, dairy products and seafood and plant proteins, in both men and women (P<0·01 for all). In contrast, a significant negative association was observed between eating frequency and the fatty acids component score in women (P=0·040) but not in men (P=0·159). For moderation components, the Na component score was significantly and positively associated with eating frequency in both men (P=0·002) and women (P<0·001), whereas the component score for refined grains was significantly and positively associated with eating frequency in men (P=0·012) but not in women (P=0·099).
Table 3 Associations between eating frequency and the Health Eating Index 2010 (HEI-2010)Footnote * (Regression coefficients with their standard errors)

* Adjusted for age, race/ethnicity, ratio of family income:poverty, physical activity level, smoking status and energy intake; β is the change in the outcome variable for each unit increase of eating frequency when adjusting for covariates.
BMI and waist circumference
As shown in Table 4, eating frequency was significantly and inversely associated with BMI in women (P=0·003); however, the association was not statistically significant in men (P=0·130). In contrast, eating frequency was significantly and inversely associated with waist circumference in both men (P=0·032) and women (P=0·010).
Table 4 Associations between eating frequency and BMI and waist circumferenceFootnote * (Regression coefficients with their standard errors)
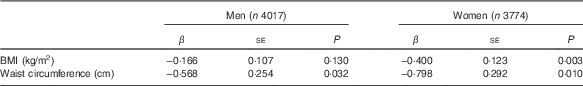
* Adjusted for age, race/ethnicity, ratio of family income:poverty, physical activity level, smoking status and energy intake; β is the change in the outcome variable for each unit increase of eating frequency when adjusting for covariates.
Sensitivity analysis
The pooled analysis combining data from both men and women revealed that eating frequency was significantly and positively associated with energy intake, as well as significantly and inversely associated with energy density, diet quality, BMI and waist circumference (P<0·05 for all, data not shown). Among participants included in the present study, 3470 men and 3420 women also provided a complete second 24-h dietary recall. The mean difference in eating frequency between the day of the first dietary recall and the day of the second dietary recall was 0·18 (se 0·03) in men and 0·11 (se 0·03) in women, respectively. Both differences were statistically significant (P<0·001). Only 25·5 % of men and 30·4 % of women had the same eating frequency on both days; however, the difference in eating frequency between the two dietary recalls was no more than one eating occasion for the majority of participants (67·9 % of men and 72·1 % of women). Analysis of the second 24-h dietary recall data also revealed similar results regarding associations between eating frequency and energy intake, energy density, diet quality and waist circumference (P<0·05 for all, data not shown), whereas the inverse associations between eating frequency and BMI in both men and women were statistically significant (P=0·040 and P=0·003, data not shown).
Discussion
There has been an increase in eating frequency over the past 30 years in all age groups( Reference Popkin and Duffey 1 ). The present study using nationally representative data from the USA found that men ate, on average, 4·48 times each day, whereas it was 4·38 times for women. A better understanding of how eating frequency influences body weight may lead to improved strategies to aid weight loss. Data from the present study suggest that increased eating frequency is associated with increased energy intake, a diet with lower energy density and better diet quality; moreover, it was inversely associated with BMI and waist circumference, although the association with BMI was not significant in men when the first 24-h dietary recall data were analysed.
Results from this study are consistent with previous results, which report a positive association between eating frequency and energy intake( Reference Mills, Perry and Reicks 3 ), and several cross-sectional studies, which have found an inverse significant relationship between eating frequency and body weight or BMI( Reference Aljuraiban, Chan and Griep 2 , Reference Franko, Striegel-Moore and Thompson 10 ), but not others( Reference Mills, Perry and Reicks 3 , Reference Hartline-Grafton, Rose and Johnson 12 , Reference Howarth, Huang and Roberts 13 ). There are several possible explanations for these discrepant and paradoxical results. First, eating frequency and anthropometric measures are related to several socio-economic and lifestyle variables, which may confound the results. If these are not adequately controlled for, then spurious associations may be reported. The list of covariates adjusted for was not consistent among studies. Second, the true relationship between eating frequency and body weight may be masked by under-reporting of energy intake, which is an issue in common observational studies that rely on self-reported diet recalls( Reference Flegal 28 ). Although randomised-controlled trials are better placed to show a causal relationship between eating frequency and anthropometric measures of interest, a few studies have been conducted thus far( Reference Cameron, Cyr and Doucet 16 , Reference Bachman and Raynor 17 ). These studies have altered eating frequency as part of an energy-restricted diet and generally show no effect of eating frequency on weight loss( Reference Cameron, Cyr and Doucet 16 , Reference Bachman and Raynor 17 ). However, the results from these weight loss studies cannot be extrapolated to the general population who are not on a weight loss diet and wish to maintain a healthy body weight or prevent weight gain. Moreover, there are some weaknesses to randomised-controlled trials that could also mask a true relationship (e.g. poor participant compliance to the treatment protocol). Mechanistic data that may support a role for eating frequency also provide inconsistent results. One hypothesis is that increasing eating frequency may aid weight management through an effect on appetite control( Reference Leidy and Campbell 29 ). However, no compelling evidence for this effect currently exists. Another plausible hypothesis is that increasing eating frequency increases dietary-induced thermogenesis. Currently available data also fail to support this hypothesis( Reference Tai, Castillo and Pisunyer 5 – Reference Belko and Barbieri 7 ). Owing to the inconsistent results and relative paucity of data, further research is required to clarify the role of eating frequency on weight management.
Several studies have found that a diet with higher energy density is associated with poor appetite control( Reference Latner, Rosewall and Chisholm 30 ) and a higher body weight( Reference Vernarelli, Mitchell and Hartman 31 , Reference Vernarelli, Mitchell and Rolls 32 ). However, the present study is not able to demonstrate a causal relationship between eating frequency and energy density. It is possible that individuals who eat more frequently are also more health conscious and choose low-energy density foods. It is also possible that low-energy density foods influence eating frequency by a more rapid return of hunger, which stimulates an eating occasion( Reference Poppitt and Prentice 33 ). Further research is warranted to understand how food characteristics influence eating patterns and how this influences health.
The present study provides evidence that increased eating frequency is associated with improved diet quality. As eating frequency increased, there was an increase in the HEI-2010 total score and higher component scores such as total fruits, whole fruits, whole grains, dairy products and seafood and plant proteins. One potential explanation for associations between eating frequency and diet quality is that people who are more health conscious eat healthier meals or snacks more frequently. A causal effect, however, remains to be investigated.
There are some limitations to the present study. First, the results do not indicate any causal relationship because the data were from a cross-sectional study. Second, the NHANES dietary data analysed may not reflect a dietary pattern over a longer period as there could be inter-day variations in dietary intake. As shown by a sensitivity analysis in the present study, although most results were similar as the main analysis, the associations between eating frequency and BMI in men were different depending on the day of the dietary recall. Moreover, the physical activity level included in the statistical model was derived from a self-reported questionnaire; this might not have completely ruled out the possibility of confounding. Finally, the present study did not aim to investigate the impact of snacking; therefore, eating frequency did not differentiate eating occasion of main meals from snacks. Nonetheless, to our knowledge, it was the first study that examined associations between eating frequency and diet quality using a nationally representative data. Longitudinal studies are encouraged to examine the chronic impact of a dietary pattern characterised by increased eating frequency on change in body weight.
Acknowledgements
The authors thank participants and investigators of the NHANES who made the data available.
This research received no specific grant from any funding agency, commercial or not-for-profit sectors.
Y. Z. and J. H. H. designed the present study, carried out the data analysis and prepared the manuscript.
The authors have no financial or personal conflicts of interest to declare.


