


Accurate assessment of food intake in children is essential for monitoring dietary habits( Reference Livingstone, Robson and Wallace 1 ). FFQ are relatively easy and inexpensive to administer and have been used in a large number of epidemiological studies, but less so in those in young children( Reference Ziegler, Briefel and Clusen 2 ). The major limitations of FFQ include the following: the accuracy in estimating intake( Reference Subar, Kipnis and Troiano 3 ) and capturing dietary details( Reference Thompson, Subar, Coulston, Boushey and Ferruzsi 4 ) and respondent difficulties in estimating consumption frequencies or answering questions about food groups( Reference Ziegler, Briefel and Clusen 2 ). Moreover, when a new FFQ is developed, when changes are made in FFQ or when FFQ are used with different demographic groups, validation is essential( Reference Cade, Thompson and Burley 5 ).
Few validation studies of FFQ in young children exist and they are limited to a cross-sectional design. In US( Reference Iannotti, Zuckerman and Blyer 6 , Reference Blum, Wei and Rockett 7 ) and Korean( Reference Kim, Oh and Kwon 8 ) studies of preschoolers, the relative validity of FFQ designed to assess nutrient and food group intake, respectively, was measured against that of three and two 24 h recalls, respectively (n 17( Reference Iannotti, Zuckerman and Blyer 6 ), n 233( Reference Blum, Wei and Rockett 7 ) and n 333( Reference Kim, Oh and Kwon 8 )). In Norway, 7 d weighed records were used to test the relative validity of nutrient and food intake( Reference Andersen, Lande and Trygg 9 ) (n 187), whereas 3 d diaries were the standard tools used to assess the relative validity of a beverage questionnaire in assessing beverage, Ca and vitamin D intakes among US children aged 6 months to 5 years( Reference Marshall, Eichenberger Gilmore and Broffitt 10 ) (n 240). Huybrechts et al. investigated the relative validity and reproducibility of a semi-quantitative FFQ to assess food group( Reference Huybrechts, De Backer and De Bacquer 11 ) and Ca intake( Reference Huybrechts, De Bacquer and Matthys 12 ) against those of a 3 d diary in Flemish children aged 2·5–6·5 years (n 650). Vereecken et al. ( Reference Vereecken, Covents and Maes 13 ) investigated the relative validity of a FFQ against that of a 3 d online recording tool, Young Children's Nutrition Assessment on the Web (YCNA-W), in a sample of Belgian-Flemish children, participating in the Family Influences on Food Intake (FIFI) study (n 216).
In longitudinal studies with young children, whose growth and eating habits change rapidly, and in evaluations of interventions to improve diet, it is important to consider the sensitivity of the instruments used to assess changes in dietary intake. Of the few studies that investigated the responsiveness of FFQ to changes in dietary intake over time( Reference Osler and Heitmann 14 – Reference Bogers, van Assema and Kester 17 ), only two examined the responsiveness at a food item level( Reference Osler and Heitmann 14 , Reference Bogers, van Assema and Kester 17 ) and neither focused on children. Collecting data at the food level is important as people eat food, rather than nutrients, and dietary recommendations are communicated in terms of food items and groups( Reference Millen, Midthune and Thompson 18 ).
The aim of the present study was to investigate the relative validity of changes in food group intake between 2008 and 2012, from 3 to 7 years of age, assessed with the FIFI-FFQ tool against that of dietary data collected over three non-consecutive days using an online tool, YCNA-W, in a sample of Belgian-Flemish children. We hypothesised that changes in intake assessed with the FIFI-FFQ would parallel those assessed with YCNA-W. Additionally, agreement between the two methods at separate time points is described.
Methods
Design and procedure
To better understand young children's dietary patterns and factors that influence them, a biennial longitudinal study on FIFI was initiated in Flanders (Belgium) in 2008( Reference Vereecken 19 ). A total of eighty schools in East and West Flanders (Belgium), randomly selected from the school list provided by the Ministry of Education, were approached for participation in the study. Among these, forty-six schools and ten subdepartments agreed to participate. Within these schools, parents of children from the first pre-primary grade were invited to participate. The parents were requested to fill in a questionnaire containing a quantitative FFQ, questions on sociodemographic characteristics and questions on several constructs that can influence children's dietary patterns. Data for the longitudinal study were collected from the children's parents at the ages of 3, 5 and 7 years.
In 2008, a subsample of parents, namely all who provided their e-mail address in the questionnaire, were invited via e-mail to fill in the online recording tool YCNA-W for three predefined non-consecutive days over a 2-week period, including one weekend day and two weekdays( Reference Vereecken, Covents and Haynie 20 ). The parents were instructed to complete the tool in the evening for each particular day. A printable food record sheet was available for the teachers to report details regarding the meals (foods and quantities) of children who ordered their meal at school, which were then recorded online in the evening by the parents. The same procedure was repeated in 2012 for parents who completed both instruments in 2008. Data for the FIFI study were collected between January and April 2008 and follow-up data between January and April 2012. Ethical approval was obtained from the ethical board of Ghent University Hospital. Informed consent was requested from the parents who participated. No incentive was given to the participants.
The Family Influences on Food Intake-FFQ
To assess children's food intake, the parents were asked to fill in a machine-readable FFQ, with questions on the average consumption of seventy-seven food groups in the previous 3 months. The food items were based on a previously developed Ca questionnaire( Reference Huybrechts, De Bacquer and Matthys 12 ) for preschoolers, further developed to capture the general dietary habits of young children. The frequency options were as follows: ‘never or less than 1 d per month’; ‘1–3 d per month’; ‘1 d per week’; ‘2 d per week’; ‘3–4 d per week’; ‘5–6 d per week’; ‘everyday’. The parents were also asked to select the average consumption for each food (group) on the day it was consumed. For each item, three to eight portion sizes were defined, plus an open category (e.g. for milk-based desserts: ‘67 g (half a jar)’, ‘125 g (1 jar)’, ‘250 g (2 jars)’, etc. and for prepared/cooked vegetables: ‘30 g’, ‘60 g’, ‘90 g’, ‘120 g’, ‘150 g’, ‘180 g’, ‘210 g’, etc.). In addition, examples of standard measures were given (e.g. ‘one small jar = 125 g’ and one spoon of prepared/cooked vegetables = 30 g). From these responses, the average daily intake (g or ml/d) of each food item was calculated by multiplying the consumption frequency of each food (group) by the specified portion size. For the few cases where the frequency of consumption was reported and not the portion size, the missing value was replaced with the median reported portion size of consumers in the study. Missing values on the frequency questions were not replaced and for the summation of different food groups were considered as zero values.
The relative validity of the FIFI-FFQ compared with that of a 3 d online recording tool (YCNA-W) for parental reporting of the intake for 3-year-old children has already been published( Reference Vereecken, Covents and Maes 13 ). The results showed a good agreement (Wilcoxon tests revealed no significant difference) for five of the twenty food groups, with lower intakes being reported in the FFQ than in YCNA-W for five food groups and higher intakes in the FFQ than in YCNA-W for ten food groups. Spearman's correlations varied between 0·22 and 0·76.
The online food record: Young Children's Nutrition Assessment on the Web
Detailed dietary data were collected using the Web-based dietary assessment tool YCNA-W. YCNA-W is based on previously developed and validated tools for adolescents( Reference Vereecken, Covents and Matthys 21 , Reference Vereecken, Covents and Sichert-Hellert 22 ). Additionally, data collected with the instrument in 2008 in a subsample of the FIFI study were in good agreement with those collected with 3 d paper–pencil diaries in a second subsample: only for water, a significant higher intake was reported in the diaries( Reference Vereecken, Covents and Haynie 20 ). A detailed description of YCNA-W has been provided elsewhere( Reference Vereecken, Covents and Haynie 20 ). In short, the parents logged in with a personal code and were asked to select for each day and each eating occasion the food items consumed from a hierarchically organised menu structure. There were twenty-four eating occasions (for each hour of the day) included in 2008, which were reduced to a more user-friendly version of seven eating occasions in 2012. The menu structure included 800 different food items and pictures of portion sizes for more than 200 food items. More details about the pictures, capturing very small to very large portion sizes, making them useful for very diverse populations, have been reported elsewhere( Reference Vereecken, Dohogne and Covents 23 ). However, the validity of these pictures has been investigated in only adolescents( Reference Vereecken, Dohogne and Covents 23 ).
Analyses
Analyses were carried out using SPSS 15.0.1.1 (SPSS, Inc.). Values were considered significant at P< 0·05. Food items were categorised into twenty-two food groups based on nutrient content and food use. Changes in intake between 2008 and 2012 were estimated by subtracting the values recorded in 2008 from those recorded in 2012, so that positive values indicated increases in intake. Descriptives are reported for both methods and time points. Differences in intake and in changes in intake were analysed using Wilcoxon signed-rank tests, and correlations were assessed by Spearman's rank correlation coefficients.
Results
In 2008, 862 of the 1611 parents approached for participation in the FIFI study returned the completed questionnaire. Of the 467 parents who were e-mailed requesting to fill in YCNA-W, 216 completed the FFQ and the food record over 3 d. A total of 160 parents also completed the FFQ in February–March 2012 and were invited to complete YCNA-W. Of the e-mails sent, eighteen could not be delivered; nine parents completed YCNA-W for 1 d, five for 2 d and ninety-two for 3 d. Only those with 3 d records were included in additional analyses. From these analyses, three parents were excluded as they reported that their child was sick on one or more days. Girls made up 55 % of the children in the sample (n 89): the mean age of the children at baseline was 3·4 (sd 0·4), ranging between 2·4 and 4 years. Among the parents, 77 % of the mothers and 58 % of the fathers had a Bachelor's or Master's degree. Those who dropped out of the validation study were less likely to have parents who completed higher education (mothers: 51 %; fathers: 42 %) and consumed more diet soft drinks and white bread and less brown bread and cheese.
Agreement between the two methods at a population level
In Table 1, daily food intakes reported in the FFQ and YCNA-W in 2008 and 2012 are compared. Significantly lower intakes were reported in the FFQ than in YCNA-W for four food groups (sugared soft drinks, milk, sugared milk beverages and cheese) at both time points and for three food groups (water, fruit juice and sauces) in 2012. Significantly higher intakes were reported in the FFQ than in YCNA-W for three food groups (white bread, vegetables and milk-based desserts) at both time points, for eight food groups (soup, coffee and tea, breakfast cereals, brown bread, potatoes and grains, meat and meat substitutes, savoury snacks and candy/sweets) in 2008, and for biscuits and pastries in 2012.
Table 1 Dietary intake according to FFQ* and Young Children's Nutrition Assessment on the Web (YCNA-W)† in Belgian-Flemish children (n 89) (Mean or median values and 25th (P25)–75th (P75) percentiles)

* FFQ completed by the parents in 2008 and 2012, respectively.
† An online recording tool completed for three non-consecutive days in 2008 and in 2012.
‡ Significance of the Wilcoxon signed-rank test between FFQ and YCNA-W at both time points.
§ All non-refined breads.
∥ Grains: pasta, rice, etc.
Agreement in changes in intake according to both methods
Changes in intake differed significantly for four food groups between the two methods: the intake of water, potatoes and grain products, and savoury snacks reported in the FFQ increased significantly less when compared with that reported in YCNA-W and a decrease in the intake of milk-based desserts was found in the FFQ only (Table 2). Moreover, for seventeen of the twenty-two food groups, equivalent evolutions were found irrespective of the dietary assessment method used. The intake of nine food groups (water, sugared soft drinks, diet soft drinks, white bread, vegetables, potatoes and grains, meat and meat products, sauces and savoury snacks) increased significantly according to both methods. The intake of two food groups (sugared milk beverages and soya beverages) decreased significantly. For six food groups, no significant changes were found according to both methods. The standard deviations of the differences indicate that, at an individual level, the differences may be large.
Table 2 Comparison of changes in dietary intake between 2008 and 2012 according to FFQ and Young Children's Nutrition Assessment on the Web (YCNA-W)* in Belgian-Flemish children (n 89) (Mean values and standard deviations; median values and 25th (P25)–75th (P75) percentiles)

* An online recording tool completed for three non-consecutive days in 2008 and in 2012.
† Significance of the Wilcoxon signed-rank test comparing children's food intake data collected with FFQ in 2008 and 2012.
‡ Significance of the Wilcoxon signed-rank test comparing children's food intake data collected with YCNA-W in 2008 and 2012.
§ Significance of the Wilcoxon signed-rank test comparing changes in food intake data between 2008 and 2012 according to YCNA-W and FFQ.
∥ All non-refined breads.
¶ Grains: pasta, rice, etc.
Agreement in ranking individuals
The cross-sectional correlations between the two dietary assessment methods varied substantially from as low as 0·11 to as high as 0·74, with most correlations being significant. On average, the correlations were 0·46 in 2008 and 0·48 in 2012 (Table 3). Correlations between FFQ used at both time points were, on average, 0·45 and those between YCNA-W used at both time points were 0·30. Correlations between the changes in intake according to the FFQ at both time points and according to YCNA-W at both time points were lower, on average, 0·26, with only twelve correlations being significant: coffee and tea; fruit juice; sugared soft drinks; milk; sugared milk beverages; soya beverages; breakfast cereals; white bread; brown bread; vegetables; fruits; meat and meat substitutes.
Table 3 Spearman's correlations between dietary intakes assessed with FFQ* and Young Children's Nutrition Assessment on the Web (YCNA-W)† in Belgian-Flemish children (n 89)
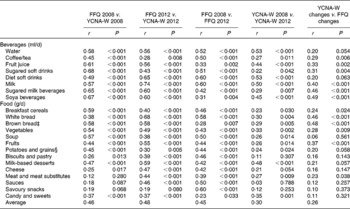
* FFQ completed by the parents in 2008 and 2012.
† An online recording tool completed by the parents for three non-consecutive days in 2008 and 2012.
‡ All non-refined breads.
§ Grains: pasta, rice, etc.
Discussion
In the present study, food group intake and changes in intake over time assessed using a FFQ and an online 3 d recording tool, when the children were 3 and 7 years old, were compared.
First, agreement between the methods at a population level was investigated. In line with the literature( Reference Andersen, Lande and Trygg 9 – Reference Huybrechts, De Backer and De Bacquer 11 ), both over- and underestimation of food intake were found when comparing FFQ with other dietary assessment methods. In the study of Huybrechts et al. ( Reference Huybrechts, De Backer and De Bacquer 11 ), the intake of five of the thirteen food groups was overestimated and that of four food groups underestimated, and in the study of Andersen et al. ( Reference Andersen, Lande and Trygg 9 ), the intake of five of the fifteen items was overestimated and that of five underestimated. In the present study, the intake of more food groups was overestimated in the FFQ than in the YCNA-W at baseline (eleven overestimated v. four underestimated), whereas that of more food groups was underestimated at follow-up (four overestimated v. seven underestimated). Notably for twelve food groups, significant differences in intake were found between the two methods at just one time point (2008 or 2012). However, none of these significant differences were in the opposite direction for the other time period (i.e. none changed from over- to underestimation or vice versa).
Second, changes in food group intake by method were compared. For seventeen of the twenty-two items, equivalent evolutions (the intake of nine food groups increased, that of two food groups decreased and no change from 2008 to 2012 was observed for six food groups) were found irrespective of the dietary assessment method used. The increase in intake is in accordance with the higher energy and nutrient needs of older children( Reference Huybrechts, Matthys and Vereecken 24 ). The decrease in the intake of sugared milk beverages and soya beverages is in agreement with the lower intakes of milk products in children aged 4–6 years v. those aged 3–4 years as described in a study carried out by Huybrechts et al. ( Reference Huybrechts, Matthys and Vereecken 24 ).
Additionally, the evolutions differed significantly for only four items between the two methods (the intake of water, potatoes and grain products, savoury snacks and milk-based desserts). The parallel changes found with the FFQ and YCNA-W and the lack of significant differences in changes in intake at the food group level for most food groups suggest that despite over- and underestimations in 2008 and 2012, the FFQ can be used to monitor changes in intake for most food groups at a population level. However, for water, potatoes and grain products, and savoury snacks, one must consider underestimation of the increase in intake in the FFQ in comparison with YCNA-W, while for milk-based desserts, the decrease in the FFQ may actually be a status quo.
To our knowledge, no other study in the literature has investigated the relative validity of changes in food intake in young children. In a study( Reference Osler and Heitmann 14 ) in adults comparing a FFQ with a diet history over a 6-year period, the authors also reported that changes in mean intake from the diet history interview were mirrored by changes in consumption frequency estimated by the FFQ.
Third, agreement in the ranking of food group intake and changes by method was investigated. The cross-sectional correlations between the two dietary assessment methods varied substantially from as low as 0·11 to as high as 0·74, with most correlations being significant and an average correlation being comparable to those of others( Reference Andersen, Lande and Trygg 9 – Reference Huybrechts, De Backer and De Bacquer 11 ). In the study of Huybrechts et al. ( Reference Huybrechts, De Backer and De Bacquer 11 ), Spearman's correlations varied between 0·23 and 0·62, with, on average, a correlation of 0·42. In the study of Marshall et al. ( Reference Marshall, Eichenberger Gilmore and Broffitt 10 ), correlations varied between 0·54 and 0·76, with an average of 0·66 for 3-year-olds and of 0·61 for 5-year-olds. In the study of Andersen et al. ( Reference Andersen, Lande and Trygg 9 ), correlations varied from 0·26 to 0·69, with an average of 0·48. Given the large day-to-day variation in food group intake( Reference Huybrechts, De Backer and De Bacquer 11 ) and given that a 3 d record is just a snapshot of a child's usual food intake( Reference Vereecken, Covents and Maes 25 ), the correlations are in the range of what could be expected.
Correlations between the changes in dietary intake were lower, on average, 0·26, with only twelve correlations being significant. This is not unexpected as imprecisions in single estimates add up when calculating changes( Reference Pijls, de Vries and Donker 16 ). In a study carried out by Osler & Heitmann( Reference Osler and Heitmann 14 ), the average correlation was 0·23. All but three (of the twenty-four) correlations were significant in their study; however, their sample was much larger (n 329). A study carried out by Bogers et al. ( Reference Bogers, van Assema and Kester 17 ), using an eighteen-item FFQ and biomarkers, found correlations between changes in plasma carotenoid and vitamin C concentrations of 0·32 and 0·33 for fruits and of 0·28 and 0·30 for vegetables, respectively.
Finally, some limitations should be noted. The sample was relatively small. There is no gold standard for assessing the validity of usual food intake( Reference Cade, Thompson and Burley 5 ); hence, only relative validation against another dietary assessment instrument that is believed to be more accurate can be established. In the present study, the reference method was the online 3 d dietary record tool YCNA-W. The software includes 800 food items, and the use of multiple household measures and many food images make it possible to select detailed dietary information in a standardised but nonetheless flexible way. A previous version has been validated in adolescents. Additionally, 2008 data, data of the 3-year-olds, were compared with dietary data collected with paper–pencil diaries in a second subsample( Reference Vereecken, Covents and Haynie 20 ). However, no real validation of parental reports of children's food intake with a standard reference method in the same sample was done.
The use of an online tool may deter those who are less computer literate( Reference Vereecken, Covents and Haynie 20 ). Moreover, only participants of the main study, who provided an e-mail address, were contacted to participate in the validation study. These factors plus the demands of dietary record-keeping( Reference Berg, Jonsson and Conner 26 ) may have contributed to the non-response and dropout rate observed. This might compromise the generalisability of the results, as participants were likely to be highly motivated and may respond differently compared with other populations( Reference Riboli, Toniolo and Kaaks 27 ). The healthier eating pattern of the validation sample for a number of food groups and the higher response rate of the more-educated participants were not unexpected and were in agreement with the literature( Reference Vereecken, Covents and Maes 25 , Reference Oenema, Brug and Lechner 28 , Reference Papadaki and Scott 29 ).
YCNA-W was completed for three non-consecutive predefined days, yet the mean of 3 d is not enough to obtain stable estimates of the habitual diet of children. However, respondent burden( Reference Vereecken, Covents and Maes 25 ) precludes increasing the number of days for data collection.
The parent most involved with the child was requested to complete the instruments; however, this cannot be guaranteed. The parents were asked to report their children's food intake for a particular day in the evening. However, it is possible that there was a lapse between recording and the assigned dietary assessment day, which could increase error of types of foods and/or amounts recorded. The parents were asked to report details regarding their children's snacks and lunches consumed at school. As the parents were not present at school, most of this information is likely to be based on what the parents put in the children's lunch boxes and what was left behind, potentially supplemented with information from the children (e.g. when there was a birthday party).
A printable food record sheet was available for the teachers of children who ordered their meal at school. The teachers were asked to report details regarding foods and amounts consumed. However, as in most schools only one or two teachers are present in the school lunchroom, the teachers might not have been able to accurately observe children during the whole lunch period to take into account leftovers or foods swapped.
The parents received the link to the online record after completing the questionnaire; hence, a learning effect by completing food records was avoided; however, the time span did not overlap. Additionally, we cannot exclude that previous experience or the considerable time commitment from participation in the study may have led participants to complete instruments differently with each administration( Reference Subar, Kipnis and Troiano 3 ). The use of a parental report instrument to test the validity of another parental report instrument is a weakness. Finally, no adjustments were made for multiple testing.
Conclusion
The findings indicate parallel evolutions in children's food intake at a population level according to both methods, supporting the usefulness of the FFQ to investigate changes in intake over time for groups of children for most food groups. Correlations between the changes in intake were significant for only twelve of the twenty-two food groups and at best weak to moderate ( < 0·5); however, the short 3 d reference period might compromise the comparison. Additional studies in a more representative sample are advocated. Moreover, future studies should further investigate whether the cross-sectional differences in average intake between the two methods at different time points hold and how these can be explained.
Acknowledgements
C. V. is a postdoctoral researcher funded by the Research Foundation Flanders.
The authors' contributions are as follows: C. V. designed the study, collected the data, analysed the data and wrote the manuscript; M. C. assisted with the online data collection; C. K., I. H. and L. M. revised the manuscript.
No competing interests are declared by the authors.


