


INTRODUCTION
It is well known that two anthropogenic contributions have influenced the natural 14CO2 content in the atmosphere since the beginning of the 20th century. The emission of 14C-free CO2 from fossil fuel burning dilutes the 14C content (Suess Reference Suess1955), leading also to temporal variations of the interhemispheric 14C offsets early in the 20th century (McCormac et al. Reference McCormac, Hogg, Higham, Lynch-Stieglitz, Broecker, Baillie, Palmer, Xiong, Pilcher, Brown and Hoper1998; Stuiver and Braziunas Reference Stuiver and Braziunas1998). In contrast, atmospheric nuclear weapons testing after the second World War increased the 14C content considerably (Figure 1).

Figure 1 Schematic presentation of 14C production from cosmic rays and nuclear explosions in the atmosphere and its pathway into terrestrial archives (Wild et al. Reference Wild, Kutschera, Meran and Steier2019).
In the late 1950s, a noticable increase of 14C was detected in the atmosphere and biosphere (Rafter and Ferguson Reference Rafter and Ferguson1957; De Vries Reference De Vries1958; Münnich and Vogel Reference Münnich and Vogel1958; Broecker and Walton Reference Broecker and Walton1959; Broecker et al. Reference Broecker, Schulert and Olson1959). Finally, the massive nuclear weapons testing in the early 1960s led to a sharp increase of 14C, which peaked in 1963 (Nydal and Lövseth Reference Nydal and Lövseth1965) when the limited Nuclear Test Ban Treaty ended this program. Since then, the anthropogenic excess of 14C is gradually distributed from the atmosphere into the biosphere and hydrosphere. By now (2022) atmospheric 14CO2 levels have reached almost pre-nuclear levels. This 14C excess is called the “14C bomb peak” and provides a distinct and rapidly changing 14C signal for the past ∼60 years (Levin and Hesshaimer Reference Levin and Hesshaimer2000; Hua et al. Reference Hua, Barbetti and Rakowski2013; Levin et al. Reference Levin, Hammer, Kromer, Preunkert, Weller and Worthy2022). Within this period 14C “dating” with a time resolution of 1 to 2 years is possible. Since CO2 emissions from fossil fuel burning will continue—albeit with hopefully decreasing intensity—a substantial depression below the natural level of the atmospheric 14CO2 is predicted towards the end of the 21st century, shown in Figure 2 (Graven Reference Graven2015).

Figure 2 Modeling the impact of fossil fuel emissions in the 21st century on the anthropogenic “aging” of the atmosphere, depending on different scenarios of CO2 reduction (Graven Reference Graven2015). In the fifth assessment on climate change, the International Panel on Climate Change (IPCC 2013) used so-called Representative (greenhouse) Concentration Pathways (van Vuuren et al. Reference van Vuuren, Edmonds and Kainuma2011) to predict different radiative forcing values for 2100. Compared to an equilibrium between incoming radiation from space and outgoing radiation into space, positive radiation forcing values mean an increase of the temperature on Earth. A continuation of “business-as-usual” results in a radiative forcing of 8.5 W/m2 in 2100 and the most negative Δ14CO2 values (gray curve).
The 14C bomb peak was once colloquially called “The mushroom cloud’s silver lining” (Grimm Reference Grimm2008). This points out a positive side effect of the atmospheric nuclear weapons testing program. In essence, every carbon pool on Earth which was in exchange with atmospheric CO2 since the late 1950s has been labeled by bomb 14C (e.g., Bada et al. Reference Bada, Vrolijk, Brown, Druffel and Hedges1987). Combined with the extraordinary sensitivity of 14C detection by AMS, allowing one to perform 14C measurements in carbon samples down to the microgram range (Salehpour et al. Reference Salehpour, Håkansson and Possnert2015; Steier et al. Reference Steier, Liebl, Kutschera, Wild and Golser2017), has led to a large variety of applications. In the following, a limited number of representative examples will be discussed, demonstrating the versatile uses of the 14C bomb peak: (i) The uptake of anthropogenic atmospheric CO2 into ocean and land. (ii) The age of groundwater systems. (iii) The study of annual tree ring growth in olive trees. (iv) The age of cells in the human body. (v) Other uses of the 14C bomb peak in the biosphere. (vi) The evaluation of artwork with respect to its authenticity. (vii) The question of fraudulent whisky making. Although many uses of the 14C bomb peak lead to a better understanding of basic processes in the environment at large (i–iv), it is also being used for forensic investigations elucidating the dark side of human beings (v–vii).
APPLICATIONS OF THE 14C BOMB PEAK
The Uptake of Anthropogenic CO2 into Ocean and Land
An important question for the development of the future climate on Earth is how much of the anthropogenic CO2 released into the atmosphere can be taken up by oceans and land (plants and soil). We know that ∼45% of it stays in the atmosphere, being monitored since more than 50 years at the Mauna Loa Observatory in Hawaii (Keeling Reference Keeling2008). The rest is taken up by the ocean (∼25%) and land (∼30%). However, to verify reported anthropogenic CO2 emissions with independent Earth system observations, a better understanding of both contributions from natural variations in the CO2 cycle and of the uptake processes is needed (Peters et al. Reference Peters, Le Quéré, Andrew, Canadell, Friedlingsten, Ilyina, Jackson, Joos, Korsbakken, McKinley, Sitch and Tans2017). These complex questions are being investigated from different angles for the oceans (Worden et al. Reference Worden, Follows, Giovannoni, Wilken, Zimmerman and Keeling2015; Gruber et al. Reference Gruber, Clement, Carter, Feely, van Heuven, Hoppema, Ishii, Key, Kozyr, Lauvset, Monaco, Mathis, Murata, Olsen, Perez, Sabine, Tanhua and Wanninkhof2019), plants (Bastin et al. Reference Bastin, Finegold, Garcia, Mollicone, Rezende, Routh, Zohner and Crowther2019; Slotta et al. Reference Slotta, Wacker, Riedel, Heußner, Hartmann and Helle2021), and soil (Trumbore Reference Trumbore2009; Shi et al. Reference Shi, Allison, He, Levine, Hoyt, Beem-Miller, Zhu, Wieder, Trumbore and Randerson2020). Here, the 14C bomb peak provides a convenient tracer to study decadal dynamics of CO2, whereas cosmogenic 14C is useful at the millennium time scale.
As an interesting example, we show the surprising penetration of bomb 14C into the deepest regions of the oceans (Wang et al. Reference Wang, Shen, Sun, Ding, Zhu, Yi, Yu, Sha, Mi, He, Fang, Liu, Xu and Druffel2019), depicted in Figure 3.

Figure 3 Penetration of 14C bomb signal into the deepest trenches of the western Pacific Ocean (Wang et al. Reference Wang, Shen, Sun, Ding, Zhu, Yi, Yu, Sha, Mi, He, Fang, Liu, Xu and Druffel2019), found by measuring Δ14C in Hadal Ampiphods who live there (diamond symbols within the area encircled by the dashed line). This indicates a rapid exchange of particulate organic carbon (POC) with the deepest regions of the oceans. For comparison, Δ14C measurements of organic and inorganic material in the oceans as a function of depth are also displayed (non-diamond symbols).
The Age of Groundwater Systems
Groundwater is the largest freshwater resource on earth. Since our life depends on the availability of freshwater, it is important to understand the residence time of a groundwater system (Seltzer et al. Reference Seltzer, Bekaert, Barry, Durkin, Mace, Aalseth, Zappala, Mueller, Jurgens and Kulongoski2021), and how fast it is being recharged by precipitation. The age of groundwater systems can provide a first estimate of this information.
Very old groundwater system such as the Great Artesian Basin in Australia have ages around several hundred thousand years (Collon et al. Reference Collon, Kutschera, Loosli, Lehmann, Purtschert, Love, Sampson, Anthony, Cole, Davids, Morrissey, Sherrill, Steiner, Pardo and Paul2000). They are being continuously depleted by human use, with expected very long recharging times.
Here we give an example of a likely short recharging time established by 14C bomb peak dating of young speleothems in a groundwater system about 100 km from Sydney (Hodge et al. Reference Hodge, McDonald, Fischer, Redwood, Hua, Levchenko, Drysdale, Waring and Fink2011). Only a 5-year shift occurs between the atmospheric 14C bomb signal and the one recorded in a fast growing stalagmite (Figure 4). Thus, a short recharging time is likely to be expected.
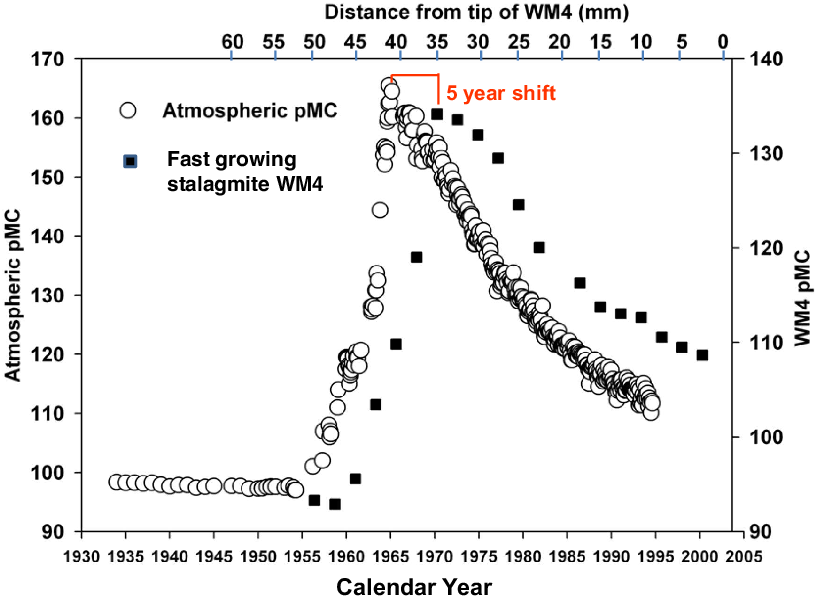
Figure 4 The figure shows a ∼5-year shift between the atmospheric 14C bomb peak and the same signal recorded in a fast-growing stalagmite (Hodge et al. Reference Hodge, McDonald, Fischer, Redwood, Hua, Levchenko, Drysdale, Waring and Fink2011), indicating a short recharging time of this groundwater system.
In general, however, in a cave system there are different water pathways for different stalagmites, depending on their locations in the cave and the overlaying rocks and soil. It is therefore a complex undertaking to come up with good estimates of the groundwater recharging times for different cave system (Markowska et al. Reference Markowska, Fohlmeister, Treble, Baker, Andersen and Hua2019).
The Study of Annual Tree Ring Growth in Olive Trees
An exact date of the Late Bronze Age eruption (∼1600 BCE) on the Greek island of Santorini in the Aegean Sea is of great interest to archaeologists and historians studying the interaction of different civilizations in the Eastern Mediterranean during that time (Warren Reference Warren2006; Kutschera Reference Kutschera2020). Great efforts have been made to determine this date by 14C dating. A key object was a branch of an olive tree supposedly buried alive in the tephra from the volcanic eruption (Friedrich et al. Reference Friedrich, Bernd Kromer, Friedrich, Heinemeier, Pfeiffer and Talamo2006). A detailed tree-ring study of a modern olive tree with the help of the 14C bomb peak (Ehrlich et al. Reference Ehrlich, Regev and Boaretto2018, Reference Ehrlich, Regev and Boaretto2021) revealed a complex tree ring growth pattern, raising doubts on the reliability of using olive trees for 14C dating (Figure 5). In addition, a new year-to-year 14C calibration (Pearson et al. Reference Pearson, Brewer, Brown, Heaton, Hodgins, Jull, Lange and Salzer2018) established a critical shift in the “plateau” region between 1600 and 1500 BCE, which does not allow one to obtain a precise date within this time range from 14C measurements. It seems that other dating methods need to be used to determine an accurate date for this important time beacon (Kutschera Reference Kutschera2020).
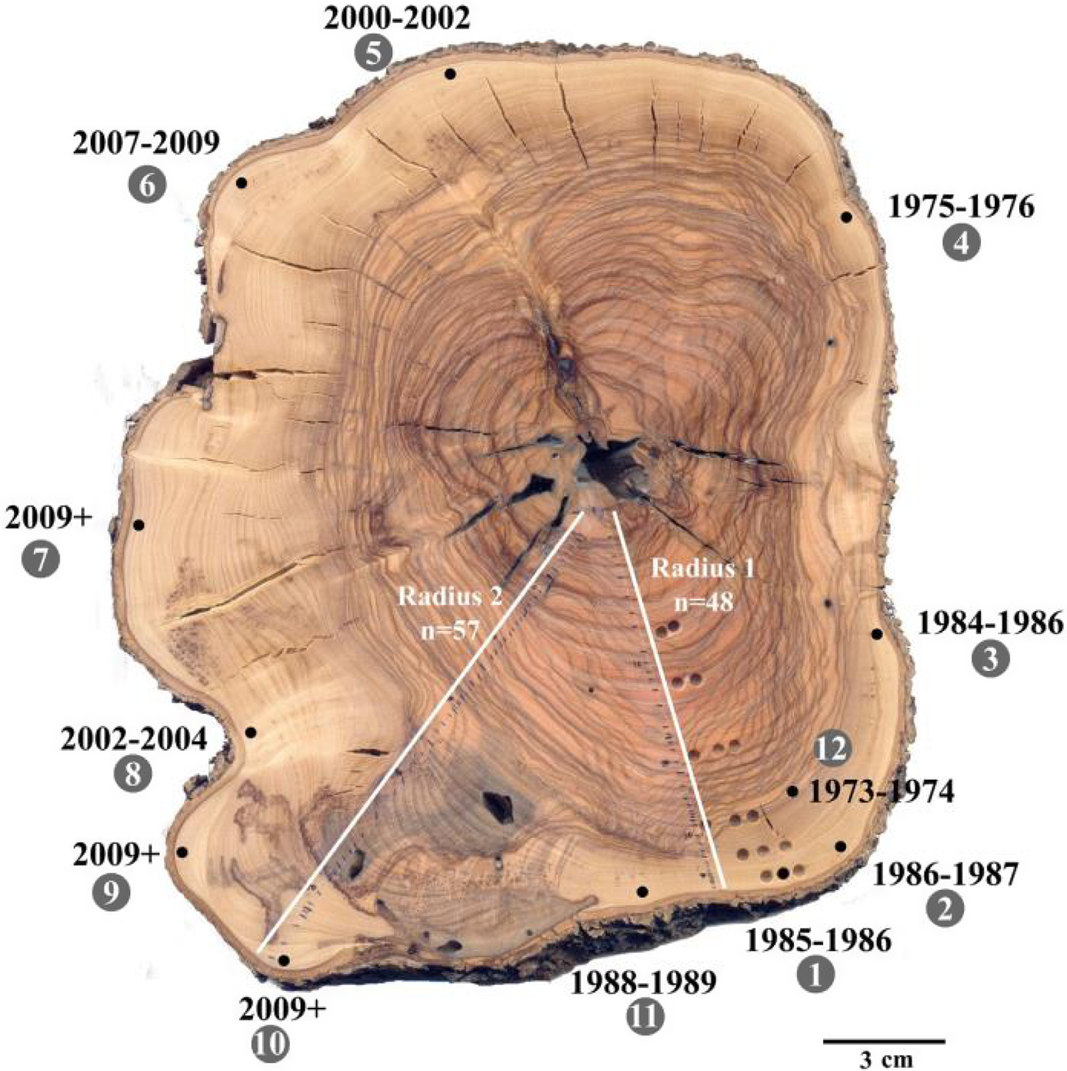
Figure 5 Cross section of a modern olive tree from northern Israel cut in 2013, where 14C bomb peak measurements around the circumference revealed a considerable variation of ages (Ehrlich et al. Reference Ehrlich, Regev and Boaretto2018). Only those regions marked with 2009+ gave signals consistent with the year of the cutting. Up to 40-year older ages are observed (point 4).
The Age of Cells in the Human Body
One of the most fascinating applications of the 14C bomb peak was developed by the Department of Cell and Molecular Biology of the Karolinska Institute in Stockholm, based on the following hypothesis, quoted from their seminal paper (Spalding et al. Reference Spalding, Bhardwaj, Buchholz, Druid and Frisén2005): “Most molecules in a cell are in constant flux, with the unique exception of genomic DNA, which is not exchanged after a cell has gone through its last division. The level of 14C integrated into genomic DNA should thus reflect the level in the atmosphere at any given point, and we hypothesized that determination of 14C levels in genomic DNA could be used to retrospectively establish the birth date of cells in the human body.” All humans who lived during the time of the bomb peak are thus potential objects for these studies (Figure 6).

Figure 6 Visualization of how the birth date of different cells in an individual of a known life span can be determined retrospectively by comparing the measured 14C signal from DNA extracts with the 14C bomb peak calibration curve (Spalding et al. Reference Spalding, Bhardwaj, Buchholz, Druid and Frisén2005).
The formation of new neurons after birth is of particular interest for the human brain. Here we show one striking example. Evidence for the formation of new neurons after birth were found in the hippocampus, an important part of the human brain where memory forming, organizing, and storing takes place (Spalding et al. Reference Spalding, Bergmann, Alkass, Bernard, Vial, Buchholz, Possnert, Mash, Druid and Frisén2013). The result of this investigation is displayed in Figure 7. In contrast, essentially no renewal of neurons after birth was found in other sections of the human brain, the neocortex (Bhardwaj et al. Reference Bhardwaj, Curtis, Spalding, Buchholz, Fink, Björk-Eriksson, Nordborg, Gage, Druid, Eriksson and Frisén2006) and the olfactory bulb of the human brain (Bergmann et al. Reference Bergmann, Liebl, Bernard, Alkass, Yeung, Steier, Kutschera, Johnson, Landén, Druid, Spalsing and Frisén2012). The age and genomic integrity of neurons after cortical strokes has also been investigated (Huttner et al. Reference Huttner, Bergmann, Salehpour, Rácz, Tatarishvili, Lindgren, Csonka, Csiba, Hortobágyi, Méhes, Englund, Solnestam, Zdunek, Scharenberg, Ström, Stahl, Sigurgeirsson, Dahl, Schwab, Possnert, Bernard, Kokaia, Lindvall, Lundeberg and Frisén2014). In general, the ability of the human brain to adapt to changing conditions (socalled “neuroplasticity”) is a field of intense studies (Yeung et al. Reference Yeung, Zdunek, Bergmann, Bernard, Salehpour, Alkass, Perl, Tisdale, Possnert, Brundin, Druid and Frisén2014; Frisén Reference Frisén2016).

Figure 7 Evidence for neurogenesis in the human hippocampus (Spalding et al. Reference Spalding, Bergmann, Alkass, Bernard, Vial, Buchholz, Possnert, Mash, Druid and Frisén2013). Δ14C values of neuronal and non-neuronal cells from the hippocampus (A) are plotted at the respective birth dates of 57 individuals (B and C). Deviations from the 14C bomb curve indicate the formation of new cells after birth. The offset between the atmospheric bomb curve and DNA measurements is indicative of the magnitude of cell turnover. The smaller offset of neurons indicates their turnover is smaller than non-neurons.
The method has also been extended to study cells in the human heart (Bergmann et al. Reference Bergmann, Bhardwaj, Bernard, Zdunek, Barnabé-Heider, Walsh, Zupicich, Alkass, Buchholz, Druid, Jovinge and Frisén2009), delivering information about constancy and renewal rates of different cells, important to a reliable functioning of the heart (Bergmann et al. Reference Bergmann, Zdunek, Felker, Salehpour, Alkass, Bernard, Sjostrom, Szewczykowska, Jakowska, dos Remedios, Malm, Andrä, Jashari, Nyengaard, Possnert, Jovinge, Druid and Frisén2015). Another application of considerable health impact is the study of the turnover of fat cells (adipocytes) since obesity increases in many countries around the world (Spalding et al. Reference Spalding, Arner, Westermark, Bernard, Buchholz, Bergmann, Blomqvist, Hoffstedt, Näslund, Britton, Concha, Hassan, Rydén, Frisén and Arner2008; Arner et al. Reference Arner, Bernard, Salehpour, Possnert, Liebl, Steier, Buchholz, Erikson, Arner, Hauner, Skurk, Rydén and Spalding2011; Hyvönen and Spalding Reference Hyvönen and Spalding2014; Arner et al. Reference Arner, Bernard, Appelsved, Fu, Anderson, Salehpour, Thorell, Rydén and Spalding2019).
Other Uses of the 14C Bomb Peak in the Biosphere
Timing of Birth and Death
The time of birth of humans can be determined by measuring bomb 14C in parts of the body where carbon is not exchanged after birth. Examples are the enamel of teeth (Spalding et al. Reference Spalding, Bhardwaj, Buchholz, Druid and Frisén2005; Buchholz and Spalding Reference Buchholz and Spalding2010), and in the eye lens crystalline (Lynnerup et al. Reference Lynnerup, Kjeldsen, Heegaard, Jacobsen and Heinemeier2008; Kjeldsen et al. Reference Kjeldsen, Heinemeier, Heegaard, Jacobsen and Lynnerup2010). In a refined 14C bomb-peak study, the separation of water-soluble and insoluble proteins of the human lens showed that the latter forming the crystalline core of the lens exhibited very low level of new carbon incorporation/exchange/turnover (Stewart et al. Reference Stewart, Lango, Nambiar, Falso, FitzGerald, Rocke, Hammock and Buchholz2013). A particularly detailed study of the age distribution of tissue in the human eye was performed by the AMS group in Debrecen (Rinyu et al. Reference Rinyu, Janovics, Molnar, Kisvaerday and Kemeny-Beke2020).
The time of death of a human can be of forensic interest. It can be determined from measuring 14C in material that has been renewed as close to the death of the person as possible, i.e., lipid fraction of bones, or hair (Wild et al. Reference Wild, Golser, Hille, Kutschera, Priller, Puchegger, Rom, Steier and Vycudilik1998). In a court case, where two old women were found dead in an apartment, a time difference of ∼1 year for the time of death for the two individuals could be established (Wild et al. Reference Wild, Golser, Hille, Kutschera, Priller, Puchegger, Rom, Steier and Vycudilik1998).
Longevity of Sharks
Sharks are iconic species in the animal world of the oceans, and the age of some great white sharks (Carcharodon carcharias) has been determined with 14C bomb peak dating of banded vertebrae to be as high as 70 years (Hamady et al. Reference Hamady, Natanson, Skomal and Thorrold2014). In a similar study of banded vertebrae in whale sharks (Rhincodon typus), the largest fish in the world, ages of up to 50 years were determined (Ong et al. Reference Ong, Meekan, Hsu, Fanning and Campana2020). An even greater age has been found for Greenland sharks (Somniosus microcephalus), with a maximum age of 400 years (Nielsen et al. Reference Nielsen, Hedeholm, Heinemeier, Bushnell, Christiansen, Olsen, Bronk Ramsey, Brill, Simon, Steffensen and Steffensen2016). The latter was established with the eye-lens dating method mentioned above.
African Elephants and Ivory Trade
A comprehensive description of the use of the 14C bomb peak for the measurement of recent biological tissues and application to wildlife forensics can be found by Uno et al. (Reference Uno, Quade, Fisher, Wittemyer, Douglas-Hamilton, Andanje, Omondi, Litoroh and Cerling2013). In the land animal world, African elephants can also be considered iconic species. Their killing has been prohibited since 1989 by CITES (The Convention on International Trade in Endangered Species of Wild Fauna and Flora). However, since their tusks provide valuable ivory, they are still being hunted after the ban. In a big effort to uncover illegal trade of ivory, the ages of large ivory seizures were determined with 14C bomb peak dating (Cerling et al. Reference Cerling, Barnette, Chesson, Douglas-Hamilton, Gobush, Uno, Wasser and Xu2016). In the abstract they state: “Carbon-14 measurements on 231 elephant ivory specimens from 14 large ivory seizures (≥0.5 ton) made between 2002 and 2014 show that most ivory (ca. 90%) was derived from animals that had died less than 3 years before ivory was confiscated” (Figure 8). This is in clear violation of the CITES convention and revealed the relentless poaching of elephants in Africa (Wasser et al. Reference Wasser, Brown, Mailand, Mondol, Clark, Laurie and Weir2015; Biggs et al. Reference Biggs, Holden, Braczkowski, Cook, Milner-Gulland, Phelps, Scholes, Smith, Underwood, Adams, Allan, Brink, Cooney, Gao, Hutton, Macdonald-Madden, Maron, Redford, Sutherland and Possingham2017).

Figure 8 14C bomb peak calibrations from the investigation of illegal ivory trade (Cerling et al. Reference Cerling, Barnette, Chesson, Douglas-Hamilton, Gobush, Uno, Wasser and Xu2016). NH3 (red color) and SH3 (blue color) are calibration curves for the Northern and Southern Hemispheres, respectively (Hua et al. Reference Hua, Barbetti and Rakowski2013). To determine a correct age of the elephant tusks, a calibration curve was established for the time period 2001 to 2013 from 14C measurements of elephant hair at known collection dates (B). The offset between the atmosphere and the elephant hair reflects the time lag of building up the keratin in hair from the foot stuff (plants, grass) consumed by the elephants. For calibration purposes, hair is assumed to be the best representative of the keratin in ivory (Cerling et al. Reference Cerling, Barnette, Chesson, Douglas-Hamilton, Gobush, Uno, Wasser and Xu2016). (Please see electronic version for color figures.)
Another study related to ivory and forensics was performed by the AMS group at the University of Salento, Italy, where also tusks from mammoths were investigated (Quarta et al. Reference Quarta, D’Elia, Braione and Calcagnile2019). In a more positive application of the 14C bomb peak, six privately owned tusks from African elephants, supposedly from before the ban from CITES, were clearly confirmed to belong to elephants hunted in the 1960s (Wild et al. Reference Wild, Kutschera, Meran and Steier2019).
The Authenticity of Artwork
It is probably not an exaggeration to say that the preservation of cultural heritage is a key to understand the development of different cultures from the past to their present state, and that it may contribute to a more respectful interaction between cultures. Part of this includes artwork, and often they gain considerable value if an authenticity can be proven by scientific methods. The development of 14C dating with AMS allows one to make such measurements on artwork with very small samples. However, great care needs to be taken to identify the origin of the object to be 14C dated, because, unfortunately, looting and forging is not uncommon on the art market (Huysecom et al. Reference Huysecom, Hajdas, Renold, Synal and Mayor2017; Hajdas et al. Reference Hajdas, Jull, Huysecom, Mayor, Renold, Syna, Hatté, Hong, Chivall, Beck, Liccioli, Fedi, Friedrich, Maspero and Sava2019).
Here, we give an example where the authenticity of a painting by a French artist was checked by applying 14C bomb peak dating (Caforio et al. Reference Caforio, Fedi, Mandò, Minarelli, Peccenini, Pellicori, Petrucci, Schwartzbaum and Taccetti2014). It turned out that the painting, which supposedly was produced by the artist early in the 20th century, actually originated from a time period when the artist was already dead. This was proven by finding a 14C signal in a small sample from the canvas of the painting, which clearly showed the 14C excess from the 14C bomb peak (Figure 9). In this case, it was fairly easy to show that the painting must have been a fake.

Figure 9 Measurement of 14C from a small piece of canvas (C) from the back of a painting possibly made by Fernand Léger (A) and of similar appearance than the one definitely belonging to this artist (B). It revealed a date after the death of Léger (D), proving it to be a fake (Caforio et al. Reference Caforio, Fedi, Mandò, Minarelli, Peccenini, Pellicori, Petrucci, Schwartzbaum and Taccetti2014).
The Question of Fraudulent Whisky-Making
Scotch whiskies are world-renown products whose original year of production is of great importance for connoisseurs and collectors. In an elaborate effort at the SUERC AMS facility near Glasgow, the Northern Hemisphere 14C bomb peak calibration curve NH1 (Hua et al. Reference Hua, Barbetti and Rakowski2013) was verified closely by measuring 14C in the ethanol component of 221 single malt whisky samples of known distillation year (Figure 10A). The observed ca. 1-year offset is consistent with the time between barley harvest and distillation (Cook et al. Reference Cook, Dunbar, Tripney and Fabel2020). This “whisky” calibration curve from 1950 to 2015 was then used to examine a range of whiskies supposedly distilled over the last 150 years. Some were found to be genuine, but others were clearly identified to be fakes (Cook et al. Reference Cook, Dunbar, Tripney and Fabel2020). For these conclusions it was also important to measure δ13C values for the samples, since the slow decrease with time due to the atmospheric CO2 contribution from fossil fuel burning provided an additional signature to fix the year of the distillation (Figure 10B).

Figure 10 14C calibration curve from known-age whiskies closely resembles the atmospheric 14C bomb curve (A). The lower part of the figure displays the δ13C values of the ethanol from these whisky samples (B). Together, these two carbon isotope signatures allowed one to determine the true age of valuable whiskies, and to distinguish between genuine products and fakes (Cook et al. Reference Cook, Dunbar, Tripney and Fabel2020).
CONCLUSION
The current review of the versatile uses of the 14C bomb peak could only touch an a few specific examples. Nevertheless, it should have made it clear that 14C from the atmospheric nuclear weapons testing program entered the entire world through the CO2 cycle in the second half of the 20th century. In particular, the entire biosphere on Earth including humans, animals, and plants who lived through this time period is labeled with an excess of 14C. This allows unique studies of dynamic processes on decadal time scales, including also the important question of how much of the anthropogenic CO2 is taken up in various reservoirs on Earth. It is likely that many more studies will be conducted benefitting from the 14C bomb signal which, however, will be “washed out” in the 21st century. There, the continued emission of “dead” CO2 from fossil fuel burning will lead to a marked suppression of the 14C signal below the natural level (Graven Reference Graven2015).
ACKNOWLEDGMENT
The author acknowledges helpful discussions with colleagues around the world who had particular expertise in the respective fields described in this review. Detailed comments from two reviewers on the original manuscript are also gratefully acknowledged.


 Open access