Abstract
It is a great challenge of identification as well as formation of groups of infectious disease data set. Data mining, a process of uncovering silent characteristics of big data is one of such techniques which have nowadays become more popular for treating massive volume of infectious disease data set. In the current study, we apply cluster analysis, one of the data mining techniques to classify real groups of infectious disease “novel corona virus disease (COVID-19)” data set of different states and union territories (UTs) in India according to their high similarity to each other. The results obtained permit us to have a sense of clusters of affected Indian states and UTs. The main objective of clustering in this study is to optimize monitoring techniques in affected states and UTs in India which will be very valuable to the government, doctors, the police and others involved in understanding seriousness of the spread of novel coronavirus (COVID-19) to improve government policies, decisions, medical facilities (ventilators, testing kits, masks etc.), treatment etc. to reduce number of infected and deceased persons.
1 Introduction
On 31 December 2019 in china, a cluster of transmittable pneumonia cases, identified as novel corona virus disease (COVID-19), was reported by the Municipal Health Commission, Wuhan. Further, on 23 January 2020, Wuhan and Hubei province was locked down on the basis of the reports that it is spreading due to community transmission in the cities. It has now spread to other provinces of China. Liu et al. [1] carefully examined the important characteristics of the disease transmission patterns among the population of different age-groups.
Till today almost all the countries around the World have been affected due to spread of the COVID-19. Till now (14 April 2020), there is no specific treatment or vaccine or drug for the disease caused by the COVID-19. The outbreak of infections due to COVID-19 is pushing many countries and regions around the World to take harsh policies, improve medical facilities (ventilators, testing kits, masks, sanitizations etc.) for protection of people. It has resulted more than 1 lakhs deaths of people of different age groups. However, it has been proven that on the basis of the common signs or symptoms like fever, cough, shortness of breath and breathing difficulties, patients are being treated (the drug named Hydroxychloroquine is useful) based on the patients’ health/clinical conditions. Moreover, a highly supportive care for infected persons is highly effective. WHO declared COVID-19 outbreak as a global health emergency and encouraged to continue strengthening and improving their preparedness for health emergencies against COVID-19.
On 30 January 2020 in India, the first case of the COVID-19 was reported in Kerala originating from China. The Indian government has declared this outbreak as an epidemic in several Indian states and UTs and several educational institutions and commercial offices were shut down. India further suspended all type of tourist visas because it was found that a majority of the cases were linked to other countries like Spain, Italy, Indonesia etc. On 22 March 2020, India announced a 14-h public curfew. Further, on 24 March 2020, the Prime Minister Shree Narendra Modi ordered a nationwide lockdown for 21 days (till 14 April 2020). All the State and UTs governments took several actions to control the spread of the virus COVID-19.
Data Science and related technologies are very important in the fight against any pandemic like 2003 severe acute respiratory syndrome coronavirus (SARS-CoV), COVID-19 to help governments and health managements to figure out the best preparation and response to such pandemics. Big data, data mining, machine learning and several other technologies can be used to analyze data quickly and effectively for tracking and controlling the spread of COVID-19 around the world [2,3,4,5]. Big data became nowadays a thrust area for researchers, engineers, health managers and administrators [6]. Several researchers exploited data mining techniques widely which detects hidden information from big data [7, 8]. The results obtained from the study by Liu et al. [1] can be linked to India and other countries, which will be valuable in understanding the virus transmission patterns among the population of different age-groups.
In this paper, we used a data mining technique to monitor the novel corona virus (COVID-19) infections in India through cluster analysis. The main objective of this study is to optimize monitoring techniques (screening, closedown, curfews, lockdown, evacuations, legal actions etc.) in affected states and union territories in India which will be very valuable to the government, doctors, the police and others involved in understanding seriousness of the spread of novel corona virus (COVID-19) to improve government policies, decisions, medical facilities (ventilators, testing kits, masks etc.), treatment etc. to reduce number of infected and deceased persons.
2 Materials and Methods
2.1 Study Area
The republic of India (India) is a seventh-largest by area and the second-most populous country in in the world. It is a country in South Asia which is bounded by the Indian Ocean on the south, the Bay of Bengal on the southeast, and the Arabian Sea on the southwest. Its land boarders sharing are with China, Bhutan and Nepal to the north, Bangladesh and Myanmar to the east and Pakistan to the west. The one of the union territories of India, Andaman and Nicobar Islands shares its border with Thailand and Indonesia. It is a federal union having 28 states and 8 union territories. All these states and union territories are included in the study.
2.2 Methodology
The methodology has three stages. Stage I consists of collection of sample observations and descriptive analysis; in stage II, statistical analysis of COVID-19 data set is performed using cluster analysis and in stage III, variation within clusters are shown using box plot.
2.2.1 Stage I: Collection of Sample Observations and Graphical Representation of the Data
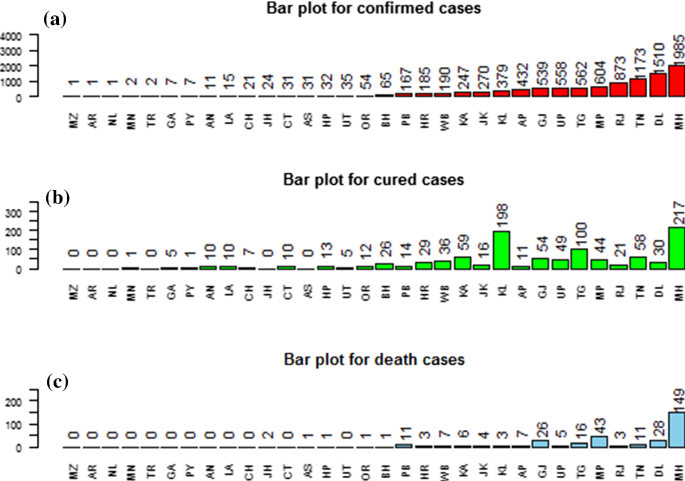
The data set related to COVID-19 during 30 January 2020 to 14 April 2020 (8:00 GMT + 5:30) in India was collected from the website of Government of India (www.mygov.in [9]). We also take information from https://en.wikipedia.org [10]. We have included 27 different states: Andhra Pradesh (AP), Arunachal Pradesh (AR), Assam (AS), Bihar (BH), Chhattisgarh (CT), Goa (GA), Gujarat (GJ), Haryana (HR), Himachal Pradesh (HP), Jharkhand (JH), Karnataka (KA), Kerala (KL), Madhya Pradesh (MP), Maharashtra (MH), Manipur (MN), Mizoram (MZ), Nagaland (NL), Odisha (OR), Punjab (PB), Rajasthan (RJ), Tamil Nadu (TN), Telengana (TG), Tripura (TR), Uttarakhand (UT), Uttar Pradesh (UP), West Bengal (WB) and 5 union territories (UTs): Andaman and Nicobar Islands (AN), Chandigarh (CH), Delhi (DL), Jammu and Kashmir (JK), Pondicherry (PY), Ladakh (LA). The data consists of three parameters: total number of confirmed cases, total number of cured/discharged cases, and total number of death cases. The total number of confirmed, cured and deaths cases during the period are 10014, 1036 and 328, respectively. However, there is no confirmed case found in the following states and UTs: Meghalaya, Sikkim, Lakshadweep and Dadra & Nagar Haveli and Daman & Diu. A summary of the data set is given in the Table 1 and the other characteristics of the data are presented through bar plots in Fig. 1.
2.2.2 Stage II: Cluster Analysis
This is a statistical technique which clusters the sample observations into groups depending upon the essential similarities found in the data set [11,12,13,14]. Ward [15] suggested agglomerative hierarchical cluster analysis in which a squared Euclidean distance is used for depending similarities in the data set. There is no prior assumption required for this technique and the clustering is done on the basis of similarities within the data set. The ward method is the simplest and the most commonly used method that uses the analysis of variance (ANOVA) to evaluate distances between clusters [16]. It has been found an efficient method of data analysis by several authors in case of a large number of data set. In this study, the R software and its packages were used to carry out the cluster analysis.
Elbow method using R software was used for getting optimum number of clusters (Fig. 2). The results obtained from the elbow method suggested six optimum numbers of clusters. The dendrograms of cluster analysis calculated by using all the parameters mentioned above in COVID-19 data set is given in the Fig. 3 for the visual representation and also by a phylogenic tree in Fig. 4. Cluster I corresponded to the areas Andhra Pradesh, Bihar, Haryana, Jammu and Kashmir, Punjab and West Bengal. Cluster II corresponded to the areas Andaman and Nicobar Island, Chandigarh, Chhattisgarh, Goa, Himachal Pradesh, Ladakh, Manipur, Mizoram, Odisha, Puducherry, Uttarakhand, Assam, Jharkhand, Arunachal Pradesh, Tripura, and Nagaland. Cluster III corresponded to the areas Delhi, Rajasthan and Tamilnadu. Cluster IV corresponded to the areas Gujarat, Karnataka, Madhya Pradesh, Telengana and Uttar Pradesh. Cluster V corresponded to the area Kerala and the cluster VI corresponded to the areas Maharashtra.
2.2.3 Stage III: Analysis Using Box Plot
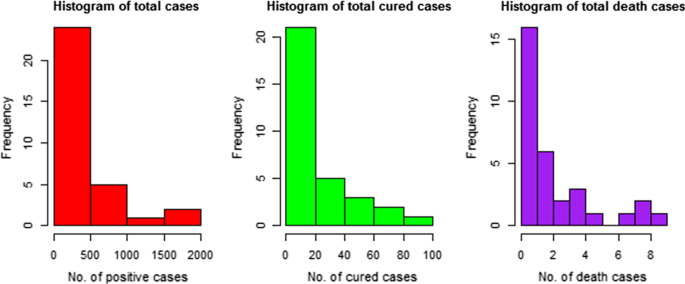
All the parameters i.e. the total confirmed cases, death cases as well as cured cases are also analyzed statistically using R software for measuring the deviation within various clusters. For this study, we used box plots to represent the deviation in the cases [17]. These parameters are skewed (Fig. 5) so median as the measure of central tendency is more appropriate to use [18] and we know that this measure is the most powerful tool for showing median, range and the shape of the underlying distribution of the data.
These box plots (Fig. 6) were constructed to assess variation in COVID-19 severity by the clustering cluster I–VI. Here we considered an area as a red zone if there are 55 or more than 55 confirmed cases in a state or an UT. Here, the states and UTs under clusters I, III, IV, V and VI were more affected areas i.e. more than 55% confirmed cases. Maharashtra under cluster VI had high severity of confirmed cases. Further, we found percentage of cured and death cases in different states and UTs. We divided the whole states and UTs into four zones- below 25%, 25–35%, 35–50% and above 50% and below 2%, 2–4%, 4–5% and above 5%, respectively according to the percentage of cured and death cases. The presented trends in Box plots for total number of confirmed cases of COVID-19 showed severity of confirmed cases in clusters I and clusters III–VI. Cluster I, III, IV and cluster V had less than 25% of the cured cases, areas under cluster II had cured cases lies in all the zones i.e. below 25%, 25–35%, 35–50% and above 50%. The UT Andaman and Nicobar Islands under cluster II had more than 80% success rate and the state Kerala under the cluster V had approximately 52.24% success rate. Similarly, we found that areas under clusters II, III and V, there were less than 2% of the death cases, areas under cluster I and IV, death rate lied in all the zones i.e. below 2%, 2–4%, 4–5% and above 5%, where Jharkhand had 8.33% death cases. Maharashtra under cluster VI had 7.51% death cases. Kerala and Maharashtra were observed single location in the cluster IV and the cluster VI, respectively and hence represented as single lines in Box plots.
3 Conclusions
In this study, we used cluster analysis to classify Indian states and UTs on the basis of the various status of COVID-19. Hierarchical cluster analysis was performed to determine relationships depending upon the observations obtained from the three types of cases of COVID-19 of Indian states and UTs. Here, cluster analysis grouped 27 states and 5 UTs into six clusters (I–VI). Except the areas under cluster II, all the areas were affected much with COVID-19, where the state Maharashtra has high number of confirmed cases. Box plot shows variations among different clusters in of the three cases. The trend in box plot showed a good trend of cured cases in Jharkhand and Kerala but worst condition of death cases in the state Maharashtra. It was found that the areas under clusters III and VI were required optimization of monitoring techniques (screening, closedown, curfews, lockdown, evacuations, legal actions etc.) which will be very valuable to the government, doctors, the police and others involved in understanding seriousness of the spread of novel corona virus (COVID-19) to improve government policies, decisions etc. Areas under clusters I, IV and VI needed more medical facilities (ventilators, testing kits, masks etc.), treatment etc. to reduce number of deceased persons.
References
Liu Y, Gu Z, Xia S, Shi B, Zhou X, Shi Y, Liu J (2020) What are the underlying transmission patterns of COVID-19 outbreak? An age-specific social contact characterization. EClincialMedicine. https://doi.org/10.1016/j.eclinm.2020.100354
Shi Y, Shan Z, Li J, Fang Y (2017) How China deals with big data. Ann Data Sci 4(4):433–440. https://doi.org/10.1007/s40745-017-0129-9
Hassani H, Huang X, Ghodsi M (2018) Big data and causality. Ann Data Sci 5(2):133–156. https://doi.org/10.1007/s40745-017-0122-3
Xu Z, Shi Y (2015) Exploring big data analysis: fundamental scientific problems. Ann Data Sci 2(4):363–372. https://doi.org/10.1007/s40745-015-0063-7
Wang Q, Ma Y, Zhao K, Tian YJ (2020) A comprehensive survey of loss functions in machine learning. Data Sci, Ann. https://doi.org/10.1007/s40745-020-00253-5
Shi Y (2014) Big data: history, current status, and challenges going forward. Bridge 44(4):6–11
Olson DL, Shi Y (2007) Introduction to business data mining. McGraw-Hill/Irwin, New York
Shi Y, Tian YJ, Kou G, Peng Y, Li JP (2011) Optimization based data mining: theory and applications. Springer, Berlin
www.mygov.in. Accessed 14–15 April 2020
https://en.wikipedia.org. Accessed 14–15 April 2020
Dilts D, Khamalah J, Plotkin A (1995) Using cluster analysis for medical resource decision making. Med Decis Making 15(4):333–347
McLachlan GJ (1992) Cluster analysis and related techniques in medical research. Stat Methods Med Res 1(1):27–48
Romesburg HC (1984) Cluster analysis for researchers. Lifetime Learning Publications, Belmont
Johnosn RA, Wichern DW (2002) Applied multivariate analysis, 5th edn. Prentice-Hall, New York
Ward JH (1963) Ward’s method. J Am Stat Assoc 58:236–246
Singh KP, Malik A, Mohan D, Sinha S (2004) Multivariate statistical techniques for the evaluation of spatial and temporal variations in water quality of Gomti River (India): a case study. Water Res 38:3980–3992
Kamble SR, Vijay R (2011) Assessment of water quality using cluster analysis in coastal region of Mumbai, India. Environ Monit Assess 178:321–332
Gun AM, Gupta MK, Dasgupta B (2008) Fundamentals of statistics, vol 1. World Press Private, Kolkata
Acknowledgements
The author is grateful to the Editors and referees for their valuable suggestions which led to improvements in the paper.
Author information
Authors and Affiliations
Corresponding author
Ethics declarations
There is no any funding.
Additional information
Publisher's Note
Springer Nature remains neutral with regard to jurisdictional claims in published maps and institutional affiliations.
Rights and permissions
About this article
Cite this article
Kumar, S. Monitoring Novel Corona Virus (COVID-19) Infections in India by Cluster Analysis. Ann. Data. Sci. 7, 417–425 (2020). https://doi.org/10.1007/s40745-020-00289-7
Received:
Revised:
Accepted:
Published:
Issue Date:
DOI: https://doi.org/10.1007/s40745-020-00289-7


