
Abstract
Introduction
To explore how adaptive choice-based conjoint (ACBC) analysis could contribute to shared decision-making in the treatment of individual patients with osteoarthritis (OA).
Methods
In-depth case study of three individuals randomly selected from patients with OA participating in an ACBC analysis exercise. Eleven members of a research users’ group participated in developing an ACBC task on medication preferences for OA. Individual medication priorities are illustrated by the detailed analysis of ACBC output from three randomly selected patients from the main sample.
Results
The case study analysis illustrates individual preferences. Participant 1’s priority was avoidance of the four high-risk side effects of medication, which accounted for 90% of the importance of all attributes, while the remaining attributes (expected benefit; way of taking medication; frequency; availability) accounted only for 10% of the total influence. Participant 3 was similar to participant 1 but would accept a high risk of one of the side effects if the medication were available by prescription. In contrast, participant 2’s priority was the avoidance of Internet purchase of medication; this attribute (availability) accounted for 52% of the importance of all attributes.
Conclusions
Individual patients have preferences that likely lead to different medication choices. ACBC has the potential as a tool for physicians to identify individual patient preferences as a practical basis for concordant prescribing for OA in clinical practice. Future research needs to establish whether accurate knowledge of individual patient preferences for treatment attributes and levels translates into concordant behavior in clinical practice.
Introduction
National and international guidelines for the management of patients with osteoarthritis (OA) conclude that prescribed medications, notably nonsteroidal anti-inflammatory drugs (NSAIDS), have an important role to play, alongside non-pharmacological interventions [1, 2], in the long-term relief of pain and improvement in activity of daily living. However, there is evidence that many patients with long-term conditions such as OA do not utilize, or continue with, prescribed medication. Non-adherence may often be intentional and may reflect rational decisions by patients related to factors other than the efficacy of the medicine for their particular condition, such as perceived side effects, inconvenience of dosage times, and the mode of drug delivery [3]. From a health care policy perspective, there are concerns that prescribing should be evidence-based [4], whilst acknowledging patient concerns [5, 6]. Concordance has been defined as “agreement between the patient and healthcare professional, reached after negotiation, that respects the beliefs and wishes of the patient in determining whether, when and how their medicine is taken, and in which the primacy of the patient’s decision is recognized” [6].
The challenge is how to translate the concept of concordance into practical and meaningful activity in the clinical situation. One specific problem is how to elicit information about patient preferences in a format that can inform the clinician and underpin joint decisions, with evidence suggesting that the amount of information being shared in a usual consultation is often misjudged by both doctors and their patients [7]. A second problem is that while some interventions to improve concordance have been developed, they have not had a clear impact on long-term patterns of medication use [8].
To date, attempts to improve concordance have often focused on the conversation that takes place during a consultation. An alternative approach is to improve the availability of relevant information in the consultation by applying formal methods of decision analysis to each individual patient in the clinical situation. There is evidence that patients can benefit from the use of decision support systems, but their complexity and the resulting increase in workload and interruption with the natural exchange of a consultation are seen as barriers to their use by clinicians [9].
A different way to gather and present information from patients is to present scenarios containing different medication attributes. We have recently completed a feasibility study using adaptive choice-based conjoint analysis (ACBC). ACBC combines features of two earlier methods: adaptive conjoint analysis (ACA) and choice-based conjoint (CBC) analysis. ACA allows participants to develop their preferences for sets of attribute configurations interactively [10], while CBC asks participants to choose their preference between presented sets of treatment attributes [10].
In the ACBC study reported here, participants with OA were presented with scenarios on a computer comprising eight different medication attributes and their task was to choose which scenario was preferable. Successive scenarios adapted to participants’ prior responses. We have established the feasibility, practicality, and patient acceptability of this method among a group of older patients with OA [11]. All stages of the study were informed by the International Society for Pharmacoeconomics and Outcomes Research (ISPOR) guidelines for the conduct of conjoint analysis [12].
The aim of the current study was to investigate the potential of ACBC as an approach to supporting shared decision-making with individual patients in clinical practice.
Methods
Our design was a detailed case study of the ACBC output of three individual patients randomly selected from a sample of patients with OA who participated in an ACBC exercise.
Participants
All participants in the ACBC project were members of the osteoarthritis research users’ group (RUG), part of the wider public and patient involvement initiative in the Arthritis Research UK Primary Care Centre at Keele University, UK. Eleven RUG members with osteoarthritis and reporting one or more of hip, knee, hand, and foot joint pain over the previous 12 months and aged over 50 years (seven females and four males) were invited to participate. None of the 11 participants were involved in any previous ACBC study and had not taken part in developing the questionnaire. Three participants—indicated as participants 1, 2, and 3—were randomly selected for detailed discussion in this paper.
Ethical Statement
All participants in the ACBC project were members of the extended Patient and Public Involvement group of the Arthritis Research UK Primary Care Centre at Keele University. These members all sign an agreement that provides general consent to use their expertise in the development of research. The study complied with Keele University guidelines for the storage of sensitive and confidential data on laptops.
Attributes and Levels
Defining attributes and levels is the most fundamental and critical aspect of designing a good conjoint analysis study [13]. Choice-based tasks such as ACBC define scenarios on the basis of pre-defined ‘attributes’ (for example in medication studies, characteristics such as route of administration) and ‘levels’ of the attribute (for example, oral and topical as levels of the “route of administration” attribute). When selecting the attributes, it is important that the ones included in the conjoint analysis task are factors that influence patient preference regarding pharmaceutical treatment of OA and are easy for the respondents to understand. The rationale and justification behind the inclusion of attributes were based upon: a full systematic search to identify the attributes used in similar studies, an ACBC feasibility study [11], and a recommendation from an earlier study that more side-effect attributes should be included than in previous choice experiments relating to NSAIDS for osteoarthritis [14]. In general, researchers should select attributes and levels that are realistic and credible to respondents [15]. Therefore, the wording and terminology used in all attributes and levels were based on RUG recommendations and suggestions, for example, RUG members suggested using “no risk to high risk” instead of percentages to represent risk of side effects. Furthermore, RUG members suggested using 25, 50, and 75% to represent the benefit levels; the rationale was that patients would not expect 100% benefit and they would not take the medication if it has 0% benefit. The attributes and levels are shown in Table 1. No RUG members who participated in the development of attributes and levels participated in completing the final ACBC questionnaire.
ACBC Task
As previously described [11], participants were invited individually to complete the ACBC task on a computer in the computer laboratory at Keele University. The computer-based interactive ACBC task was created using Sawtooth Software Inc. (SSI) survey platform (8.0.2) [16]. The first screen was an introduction explaining the task. This was followed by questions on demography and the respondents’ health. The main task consisted of three stages.
Stage 1: Build your own (BYO) configuration section. This task includes one BYO question that introduces all attributes and levels and asks the respondents to indicate the preferred level for each attribute. The software then generates scenarios based on these attributes and levels. An example of a BYO question is shown in Fig. 1.

An example of a “BYO question” from the ACBC task
Stage 2: Screening section, which includes three different types of questions:
-
(a)
“Screening” Questions Based on each respondent’s answers in stage 1, the software creates a pool of hypothetical scenarios that includes every attribute level but focuses around the respondent’s preferred levels. These scenarios are customized individually and are generated during the task for each respondent. According to the software guidelines, and based on the number of attributes and levels included in this study, we instructed the software to generate seven pages with four screening questions on each page for each respondent. In each screen, the respondents were shown four different scenarios and asked to indicate whether they would consider each one as “a possibility” or “won’t work for me”. At this stage, respondents are not asked to make final choices, as the software is trying to identify the most and least important level for each attribute. An example of a screening task is shown in Fig. 2.
Fig. 2 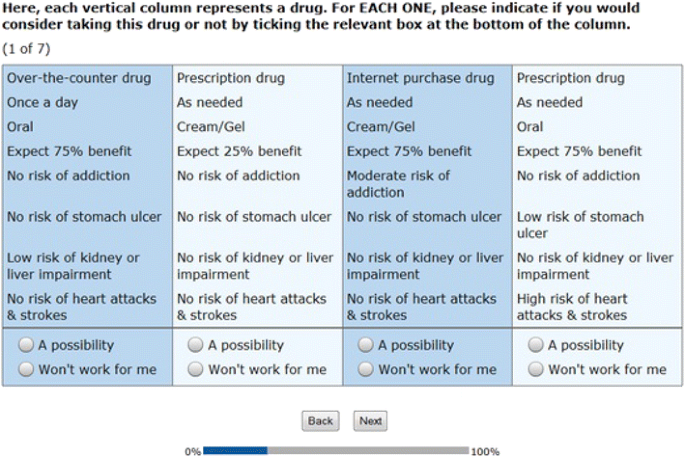
An example of a “screening question” from the ACBC task
-
(b)
“Unacceptable” Questions Here, respondents indicate if they are avoiding a specific level of some attributes. After the “screening questions”, the software evaluates whether the respondent was using non-compensatory screening rules (i.e., if the respondent was systematically avoiding one or more specific levels). All levels that could have been possibly avoided are then presented to the respondents in the “unacceptable question” format and they are asked to indicate if they were avoiding one of these levels or they wish to opt-out; i.e., “none of the listed levels is totally unacceptable”. The selected level will then be eliminated from the following screening questions. According to the software guidelines and based on the number of attributes and levels included in this study, we instructed the software to generate a maximum of four unacceptable questions for each respondent. The number of unacceptable questions varies between respondents based on the respondents’ non-compensatory screening rules. An example of the unacceptable question is shown in Fig. 3.
Fig. 3 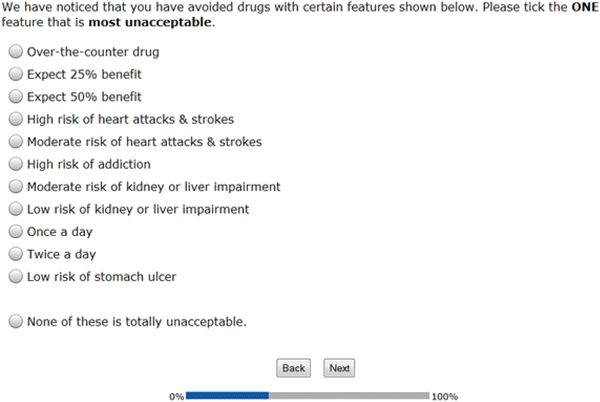
An example of an “unacceptable question” from the ACBC task
-
(c)
“Must Have” Questions Here, respondents indicate if they are interested in only one level of some attributes. After at least two “unacceptable” questions, the software scans and evaluates previous answers to see if the respondent expressed interest in only one level of some attributes. These levels are then presented to the respondent in “must have” question format. If the respondent chooses a specific level in the “must have” question, the software will eliminate all other levels of the same attribute and the respondent will only have this one level in all subsequent questions. Thus, the “must have” questions are very significant and the software does not present them to all respondents. The software produces the “must have” question when it picks up that one level of a particular attribute was constantly selected by the respondent. However, an opt-out answer is always provided in both “unacceptable” and “must have” questions. The view of the “must have” question is very similar to the “unacceptable” question.


Stage 3: Choice tasks section Finally, the respondents are shown a series of choice tasks, presenting scenarios that have the remaining levels in groups of three scenarios. These scenarios consist of the levels that the respondent marked as possibilities and conform to the must have/unacceptable rules. The chosen scenario in the first choice question will then compete in the next question with more scenarios until the software identifies the preferred scenario of the respondent. The number of choice tasks varies between respondents based on the respondents’ determination and selection of particular levels of particular attributes. An example of a choice task is shown in Fig. 4.

An example of a “choice question” from the ACBC task
Data Analysis
Regression techniques are used to analyze the responses for all types of conjoint analysis. The ACBC questionnaire uses two types of regression: hierarchical Bayes (HB) and monotone regression. Generally, it is recommended to use HB even with a small sample size. However, ACBC’s predictions from monotone regression are as good as those from HB estimation and when strictly individual estimation is required, monotone regression produces results that are applicable, usable, and uninfluenced by the group average [17]. Therefore, monotone regression was used to analyze individual respondent results. The ACBC software has a built-in monotone regression analysis. The results of the monotone regression are presented as the relative importance of each attribute to the individual patient. The relative importance of the attributes is a calculation for each attribute as to the weight that the individual places on it compared with the other seven attributes that the individual has been assessing in the scenarios during the task. The relative importance figures for each of the eight attributes add up to 100% for that individual [18]. The term ‘importance’ may be misinterpreted as a positive value. For example, 20% relative importance for an attribute may not necessarily mean that this attribute is important. It could mean that it is the least important attribute if all other attributes within the conjoint task have higher relative importance. Therefore, the relative importance value for one attribute should be interpreted in the context of others within the conjoint task.
Although the relative importance (attribute score) indicates which attributes are important to a participant, it does not provide an indication of which aspects (level) of the attribute an individual regards as the most and least important. For example, the frequency of taking medicine may be an important attribute, but the relative importance score does not provide information about which level the patient would opt for, e.g., one a day, twice a day, 3–4 times a day, or as needed. Such information on the levels is provided by the utility values for each level of each attribute. The utilities for all levels were calculated using the monotone regression [19]. Generally, conjoint analysis assumes that respondents place specific value (utility) on each level of an attribute. In ACBC monotone regression, the calculation of the utilities differs from traditional CBC. In ACBC regression, the utility score of each level is arbitrary (as given by the software), and utilities are interval data scaled to an arbitrary additive constant within each attribute [18]. Thus, the relative importance value is not sensitive to the number value of the utilities, but to the overall scaling of the levels. The utility for each level is a number that represents the weight that a respondent puts on that particular level in the context of other levels within the same attribute. The level with the highest utility in each attribute is the most favorable, and the utilities of all levels in each attribute are scaled to sum to 0. Unlike HB, which uses the logit rule to estimate utilities, the utilities in the monotone regression are ordinal, representing the order of the levels only [20]. The utility value of one level cannot therefore be arithmetically compared with the value of another level in another attribute or the same level in another individual participant. These values have a meaning within each attribute but cannot be compared across several attributes and the intervals between the values of the utilities are only comparable within each attribute. Therefore, the utilities for each individual participant were standardized to have a mean of zero and a standard deviation of 1. We created standardized values (z-scores) using SPSS. By standardizing the attribute level values, it is possible to examine the trade-offs between the levels of different attributes that a participant is willing to make. For example, the analysis will reveal if a participant is willing to trade-off a high risk of heart attack from treatment for his or her OA if offered a 50% expected benefit compared, say, to a 25% expected benefit of the treatment.
Results
Participants’ Characteristics
Participants’ characteristics in the main ACBC sample are shown in Table 2. The majority of respondents were aged 60–69 and most had OA for more than 5 years. Most patients reported that pain interfered moderately or extremely with daily life.
Attributes-Relative Importance Scores
Table 3 shows the percentage relative importance scores for all ACBC participants. Each participant’s profile can be compared to the “group average” column in Table 3. The three selected detailed participant profiles are labeled as participants 1, 2, and 3.
For participant 1, four attributes contribute over 90% of the total relative importance: “risk of kidney/liver side effects”, “risk of heart attacks/strokes”, “risk of addiction” and “risk of stomach side effects”. Four attributes are of relatively negligible importance: “availability”, “frequency of taking”, “way of taking” and “expected benefit”. For participant 1, avoidance of risk emerges as the dominant factor in medication preference.
For participant 2, the “availability” attribute has a relative importance score of 52%. Three of the “risk” attributes have values of around 10%, while “frequency of taking”, “way of taking”, “expected benefit” and “risk of stomach side effects” are of relatively little importance to participant 2. For participant 2 therefore, “availability” emerges as the dominant factor in medication preference.
For participant 3, four attributes are important: “risk of kidney/liver side effects”, “risk of heart attacks/strokes”, “risk of addiction” and “availability”. “Frequency of taking”, “way of taking” and “expected benefit” are of relatively little importance to this participant, for whom avoidance of risk and “availability” emerge as the dominant factors in medication preference. This participant is similar to participant 1, with the exception that “risk of stomach side effects” is less important and “availability” is more important (Table 3).
Attribute Levels
The attribute level data shown in Figs. 1, 2, and 3 indicate the specific preferences of each participant within each attribute. The standardized format allows us to identify potential trade-offs between the levels of different attributes that the patient is willing to make in choosing the preferred medication format.
For participant 1 (Fig. 5), the main concerns are avoidance of all high-risk side effects (kidney/liver impairment; stomach ulcer; heart attacks/stroke; and addiction). The standardized scores suggest that if this individual had to accept one type of high-risk side effect, there would be a slight preference to accept a high risk of heart attack/stroke rather than of kidney/liver side effects, stomach side effect or addiction. The remaining attributes and their levels (expected benefit, way of taking medication, frequency, and availability) have, in comparison, little influence on the choice.

Attribute levels for participant 1
For participant 2 (Fig. 6), the dominant concern is to avoid internet purchased drugs and conversely to be able to get medication over the counter. The standardized scores indicate that this individual is willing to accept high risks of gastric ulcer, of addiction, of kidney/liver impairment and of heart attack or stroke in order to be able to get medicine over the counter (as opposed to on prescription or over the Internet). If the drug were only available on prescription, this individual would not accept any of these side effects at the “high” level but would accept low risk of all the side effects. These results may indicate that the participant believes that over-the-counter medicines are unlikely to have high risk of side effects.

Attribute levels for participant 2
Participant 3 (Fig. 7) is somewhat similar to participant 1 in seeking to avoid side effects. However, for this participant, availability of medicine via prescription is an important attribute level. The results indicate that if the drug were available on prescription, this individual would accept a high risk of one of the side effects, but any combination of high-risk side effects would outweigh the utility of obtaining the drug on prescription. These results may indicate that the participant places a high value on having a medicine prescribed by a doctor (as opposed to participant 2, who favors over-the-counter medication).

Attribute levels for participant 3
Discussion
The ACBC task used in this study with participants with OA is able to elicit specific patient preferences about medication in around 20 min [11]. We have confirmed that ACBC has the potential to consider a wider range of treatment permutations than previous studies (see Table 4). The ACBC task was also able to distinguish between individuals with OA who have varying and contrasting preferences with respect to one of the most common and guideline-recommended treatments for the long-term management of symptoms and disability, namely NSAIDs [1].
It is becoming clear that concordance requires methods for transforming complex information into a format that doctors and participants can readily and rapidly view. In 2006, the average duration of GP consultation in England was 12 min [24]. Patients are increasingly turning to the Internet to get information on medicines [25] and health care professionals are using a range of information technologies [26].
While empirical evidence indicates that decision support systems can improve adherence [27], the ACBC method has not yet been used in clinical practice, although the possibility of using conjoint analysis has been advocated [28].
The implication of the findings presented here is that, in terms of both attributes and attribute levels, individual patients have preferences that are likely to lead to different medication choices. We reported in a previous paper that ten out of the total 11 participants confirmed that the results of the task reflected their own preferences and one participant was not sure that the prediction of the attribute with the highest relative importance was accurate, but agreed with the remaining results [11]. Given that these preferences could be elicited in clinical practice and made available to both clinicians and patients as part of their consultation together, the profiles presented here highlight the potential for an ACBC task to be used for such consultations and to improve concordance. However, our study has not investigated the usefulness and impact of the task in such a clinical setting. It remains to be determined whether accurate knowledge of individual patient preferences for treatment attributes and their levels translates into concordant behavior in clinical practice.
Another possible limitation is that the majority (four out of eight) of attributes included in the ACBC questionnaire were about medication side effects, which may undervalue the importance of medication benefits. Furthermore, the numbers of levels in each attribute were different. For example, ‘way of taking the medication’ included two levels, while side effect attributes included four levels each. Generally, in conjoint analysis, attributes with a greater number of levels are found to be more important, and this should be borne in mind when interpreting our results.
One question is whether people are consciously aware of their medication preferences. Consumer psychologists have shown that people’s behavior in, for example, supermarkets is to a considerable extent governed by factors of which they have no conscious knowledge. For example, slow music played in supermarkets is associated with longer visits than fast music [29]. It is known that “even goal-directed behavior often takes place outside conscious awareness and that goals can be automatically activated by a multitude of environmental cues” [30]. People’s attitudes to taking medicines are influenced by many factors (including those reported here). While the current study does not consider the reasons for people’s preferences, its starting point is that current preferences of patients with OA are potentially important to elicit and consider as part of promoting concordance with NSAID treatment. ACBC makes explicit the relative importance of a range of factors and, as reported by us previously, participants thought that the ACBC task was responsive and helped in making decision about medicines [11].
As Coulter [31] has observed, the rhetoric of patient-centered medicine is not always matched by its practice. In the field of OA, achieving patient-centered medicine is hampered by the paucity of studies that have explored medication-taking decisions [32]. Our case studies explored a wider range of attributes and levels than have hitherto been studied in relation to OA medication. ACBC makes, at least to some extent, possibly unconscious decisions explicit and allows the patient some insight into normally hidden values and preferences. By using a case study approach, this study highlights individual profiles and how these could form the basis for concordant prescribing.
Conclusions
In conclusion, this study has shown that individual patients have preferences that are likely to lead to different medication choices. ACBC has the potential to identify individual preferences as a practical basis for concordant prescribing for osteoarthritis in clinical practice.
References
NICE: Osteoarthritis: Care and Management in Adults. 2013. http://www.nice.org.uk/guidance/cg177. Accessed July 1, 2015.
McAlindon TE, Bannuru RR, Sullivan MC, et al. OARSI guidelines for the non-surgical management of knee osteoarthritis. Osteoarthr Cartil. 2014;22:363–88.
Pound P, Britten N, Morgan M, et al. Resisting medicines: a synthesis of qualitative studies of medicine taking. Soc Sci Med. 2005;61:133–55.
Dietrich ES. Effects of the National Institute for Health and Clinical Excellence’s technology appraisals on prescribing and net ingredient costs of drugs in the National Health Service in England. Int J Technol Assess Health Care. 2009;25:262–71.
Haynes RB. Evidence-based medicine and healthcare: advancing the practice. Singap Med J. 2004;45:407–9.
Marinker M, Blenkinsopp A, Bond C, et al. From compliance to concordance: achieving shared goals in medicine taking. London: Royal Pharmaceutical Society of Great Britain; 1997.
Cox K, Stevenson F, Britten N, Dundar Y. A systematic review of communication between patients and health care professionals about medicines: the consequences for concordance. Health Expect. 2004;7:234–45.
Haynes RB, McDonald H, Garg AX, et al. Interventions for helping patients to follow prescriptions for medication. Cochrane Library (Updated Feb 2002). JAMA. 2004;288:2868–79.
Da Silva D. Helping people share decision making. London: The Health Foundation; 2012.
Cunningham C, Deal K, Chen Y. Adaptive choice-based conjoint analysis: a new patient-centered approach to the assessment of health service preferences. Patient. 2010;3:257–73.
Al-Omari B, Sim J, Croft P, Frisher M. Patient preferences for the pharmacological treatment of osteoarthritis: a feasibility study using adaptive choice-based conjoint analysis (ACBCA). Eur J Pers Cent Healthc. 2015;3:253–60.
Bridges JF, Hauber AB, Marshall D, et al. Conjoint analysis applications in health—a checklist: a report of the ISPOR Good Research Practices for Conjoint Analysis Task Force. Value Health. 2011;14:403–41.
Orme B. Formulating attributes and levels in conjoint analysis. http://www.sawtoothsoftware.com/download/techpap/formatt.pdf. Accessed Apr 15, 2016.
Fraenkel L, Fried T. If you want patients with knee osteoarthritis (OA) to exercise: tell them about NSAIDS. Patient. 2008;1:21–6.
Ryan M, Farrar S. Using conjoint analysis to elicit preferences for health care. BMJ (Clinical research ed.). 2000;320:1530–3.
Sawtooth. SSI Web. How SSI web works. http://www.sawtoothsoftware.com/products/ssiweb/howssiwebworks.shtml. Accessed Apr 15, 2016.
Johnson R, Orme B. A new approach to adaptive CBC [Online]. https://www.sawtoothsoftware.com/download/techpap/acbc10.pdf. Accessed Apr 15, 2016.
Orme BK. Getting started with conjoint analysis: strategies for product design and pricing research. 2nd ed. Madison: Research Publishers LLC; 2010.
Cattin P, Wittink DR. Further beyond conjoint measurement: toward a comparison of methods. In: Perrault WD, editor. NA—advances in consumer research, vol. 4. Atlanta: Association for Consumer Research; 1977. p. 41–5.
Sawtooth Software Inc. Monotone regression (Pure Individual Analysis). https://www.sawtoothsoftware.com/help/issues/ssiweb/online_help/monotoneregression_pureindi.htm. Accessed Apr 15, 2016.
Ryan M, Bate A, Eastmond C, Ludbrook A. Use of discrete choice experiments to elicit preferences. Qual Health Care. 2001;10:i55–60.
Seston EM, Ashcroft DM, Griffiths CEM. Balancing the benefits and risks of drug treatment: a stated-preference, discrete choice experiment with patients with psoriasis. Arch Dermatol. 2007;143:1175–9.
Fraenkel L, Bogardus ST Jr, Concato J, Wittink DR. Treatment options in knee osteoarthritis. Arch Intern Med. 2004;164:1299–304.
Royal College of General Practitioners. The 2022 GP: compendium of evidence. London: Royal College of General Practitioners; 2013.
McMullan M. Patients using the Internet to obtain health information: how this affects the patient-health professional relationship. Patient Educ Couns. 2006;63:24–8.
Stoyanov SR, Hides L, Kavanagh DJ, Zelenko O, Tjondronegoro D, Mani M. Mobile App Rating Scale: a new tool for assessing the quality of health mobile apps. JMIR Mhealth Uhealth. 2015;3:e27.
Dos Santos MA, Tygesen H, Eriksson H, Herlitz J. Clinical decision support system (CDSS)—effects on care quality. Int J Health Care Qual Assur. 2014;27:707–18.
Fraenkel L. Conjoint analysis at the individual patient level: issues to consider as we move from a research to a clinical tool. Patient. 2008;1:251–3.
Milliman R. Using background music to affect the behavior of supermarket shoppers. J Mark. 1982;46:86–91.
Dijksterhuis A, Smith PK, van Baaren RB, Wigboldus DHJ. The unconscious consumer: effects of environment on consumer behaviour. J Consum Psychol. 2005;15:193–202.
Coulter A. The autonomous patient: ending paternalism in medical care. London: Stationery Office; 2002.
Laba TL, Brien JA, Fransen M, Jan S. Patient preferences for adherence to treatment for osteoarthritis: the MEdication Decisions in Osteoarthritis Study (MEDOS). BMC Musculoskelet Disord. 2013;14:160.
Acknowledgments
This work carried out and funded by Institute for Primary Care and Health Sciences, Keele University, Staffordshire ST5 5BG, UK. We would like to thank Carol Rhodes and Adele Higginbottom for their substantial contribution in facilitating and organizing the Research Users’ Group meetings. We are grateful to the members of the Research Users’ Group at the Arthritis Research UK Primary Care Centre, Keele University, UK, as this research would not have been possible without their participation. Basem Al-Omari was supported by a Keele University Acorn student fellowship. All named authors meet the International Committee of Medical Journal Editors (ICMJE) criteria for authorship for this manuscript, take responsibility for the integrity of the work as a whole, and have given final approval for the version to be published.
Disclosures
Basem Al-Omari, Julius Sim, Peter Croft, and Martin Frisher have nothing to disclose.
Compliance with Ethics Guidelines
All participants in the ACBC project were members of the extended Patient and Public Involvement group of the Arthritis Research UK Primary Care Centre at Keele University. These members all signed an agreement that provides general consent to use their expertise in the development of research. The study complied with Keele University guidelines for the storage of sensitive and confidential data on laptops.
Data availability
The datasets during and/or analyzed during the current study are available from the corresponding author on reasonable request.
Open Access
This article is distributed under the terms of the Creative Commons Attribution-NonCommercial 4.0 International License (http://creativecommons.org/licenses/by-nc/4.0/), which permits any noncommercial use, distribution, and reproduction in any medium, provided you give appropriate credit to the original author(s) and the source, provide a link to the Creative Commons license, and indicate if changes were made.
Author information
Authors and Affiliations
Corresponding author
Additional information
Enhanced content
To view enhanced content for this article go to http://www.medengine.com/Redeem/4E87F06057B18182.
Rights and permissions
Open Access This article is distributed under the terms of the Creative Commons Attribution 4.0 International License (https://creativecommons.org/licenses/by/4.0), which permits use, duplication, adaptation, distribution, and reproduction in any medium or format, as long as you give appropriate credit to the original author(s) and the source, provide a link to the Creative Commons license, and indicate if changes were made.
About this article

Cite this article
Al-Omari, B., Sim, J., Croft, P. et al. Generating Individual Patient Preferences for the Treatment of Osteoarthritis Using Adaptive Choice-Based Conjoint (ACBC) Analysis. Rheumatol Ther 4, 167–182 (2017). https://doi.org/10.1007/s40744-017-0056-4
Received:
Published:
Issue Date:
DOI: https://doi.org/10.1007/s40744-017-0056-4