
Abstract
Background and Objective
l-Glutamine is a treatment for children and adults with sickle cell disease. A comprehensive evaluation of the pharmacokinetics of l-glutamine in sickle cell disease has not been conducted. We aimed to assess the effects of long-term dosing, multiple dose levels, and food intake on l-glutamine exposure in patients with sickle cell disease compared to normal participants.
Methods
We conducted an open-label dose-ascending trial of l-glutamine in pediatric and adult participants with sickle cell disease (N = 8) and adult healthy volunteers (N = 4), providing a total of 400 plasma l-glutamine concentrations. Each participant received three ascending oral doses (0.1 and 0.3 g/kg twice daily and 0.6 g/kg once daily) over 3 weeks. Plasma l-glutamine concentrations were quantified using ion exchange chromatography. Both a non-compartmental pharmacokinetic analysis and a population pharmacokinetic analysis were performed.
Results
l-glutamine had rapid absorption and elimination, and there was no significant change in the baseline (pre-dose) l-glutamine concentration throughout the study, indicating no drug accumulation. Pharmacokinetics was best described by a one-compartment model with first-order kinetics. The dose-normalized peak concentration decreased with dose escalation, indicating the capacity-limited non-linear pharmacokinetics of oral l-glutamine. A covariate analysis showed that baseline l-glutamine concentrations correlated negatively with glutamine clearance, whereas dose positively correlated with volume of distribution. Food intake did not significantly affect glutamine clearance, indicating that l-glutamine can be taken with or without food.
Conclusions
We report the first pharmacokinetic study of multiple-dose, long-term oral l-glutamine therapy and the first population pharmacokinetic analysis of l-glutamine for sickle cell disease. These findings may permit optimized dosing of l-glutamine for patients with sickle cell disease to maximize treatment benefits.
Clinical Trial Registration
This trial is registered at ClinicalTrials.gov (NCT04684381).
Absorption and elimination of l-glutamine were rapid, and there was no accumulation of l-glutamine across study visits. |
Increased l-glutamine doses reduced relative concentrations, thus doses higher than 0.3 g/kg do not yield substantially higher blood concentrations. |
Food intake did not alter glutamine clearance, thus l-glutamine can be taken with or without food. |
1 Introduction
Sickle cell disease (SCD) is a genetic blood disorder caused by the abnormal hemoglobin (Hb), sickle hemoglobin, that affects millions of individuals worldwide [1]. The key pathophysiological processes in SCD are hemolysis and vaso-occlusion, resulting in chronic anemia, severe painful episodes, and progressive organ damage [2]. The mainstay of therapy for SCD is hydroxyurea, but additional therapies are also now available [3] including the amino acid, l-glutamine [4].
l-glutamine, one of the most abundant amino acids, is involved in numerous metabolic pathways. Its therapeutic potential has been studied in critical illness [5], cardiometabolic disease [6], exercise physiology [7], and other conditions. In hemolytic disorders such as SCD, reduced levels of plasma and erythrocyte l-glutamine have been reported [8, 9], prompting investigations of its therapeutic utility for SCD since the 1970s [10,11,12]. A small number of clinical trials indicate that oral l-glutamine can reduce the frequency of acute vaso-occlusive complications and hospitalizations in patients with SCD [13, 14], leading to its regulatory approval by the US Food and Drug Administration in 2017. The mechanisms of action of l-glutamine for SCD are not fully understood, and its diverse metabolic functions suggest that it may act through multiple pathways [4, 15]. Because it is one of the precursors of glutathione, the proposed primary action of l-glutamine in SCD is the mitigation of oxidative damage in erythrocytes by augmenting the intracellular production of glutathione [9, 16,17,18].
The dose and frequency of administration used in clinical trials and currently recommended for SCD were empirically chosen, and studies examining l-glutamine pharmacokinetics in humans are few. Ziegler et al. studied the safety and pharmacokinetics of l-glutamine in healthy volunteers and found that l-glutamine was well tolerated up to a dose level of 0.57 g/kg/day [19]. Both absorption and elimination were rapid, and their findings were compatible with a two-compartment elimination model, indicating distribution to the extracellular fluid compartment. Morris et al. showed that the pharmacokinetic (PK) profiles following a single oral dose of l-glutamine were similar in patients with SCD and healthy volunteers [20].
The optimal dosage of l-glutamine for SCD remains unknown, especially considering multiple-dose, long-term oral therapy. Therefore, we conducted a clinical trial to investigate the pharmacokinetics of escalating doses of oral l-glutamine over a 3-week period in patients with SCD. Our primary aim was to evaluate the effects of different dose levels on the absorption and disposition of l-glutamine and to assess potential food–drug interactions. The tolerability and toxicity of multiple doses of l-glutamine treatment were also evaluated.
2 Methods
2.1 Study Overview
This was a single-center, open-label, phase IV trial conducted from January to June 2021 at the Cincinnati Children’s Hospital Medical Center. Adult participants provided written informed consent. Minors provided written assent, and their legal guardians provided written permission. The Cincinnati Children’s Hospital Medical Center Institutional Review Board approved this study, and it was conducted according to the guidelines of the Declaration of Helsinki and the International Conference on Harmonisation. The trial is registered at ClinicalTrials.gov (NCT04684381).
2.2 Selection of Participants
Participants with SCD as well as healthy volunteers were enrolled. The main inclusion criteria for the SCD group were age ≥ 5 years and a diagnosis of SCD (either homozygous sickle cell anemia, sickle-β0-thalassemia, or sickle-hemoglobin C disease). The main exclusion criteria for the SCD group were hospitalization in the preceding 2 months; chronic kidney disease stage 4 or 5; severe chronic liver disease (Child-Pugh score 10–15); transfusion in the preceding 3 months; or the use of any l-glutamine supplement in the preceding 30 days. The main inclusion criteria for healthy volunteers were age ≥18 years; no known hematologic illness; and no known renal or hepatic impairment. Main exclusion criteria for healthy volunteers were transfusion in the preceding 3 months and an abnormal Hb profile by Hb electrophoresis.
Sample size and allocation groups were pragmatically chosen in advance to be able to describe the pharmacokinetics of l-glutamine in a population that varied by age, genotype, and hydroxyurea co-treatment, as well as to allow a comparison with healthy volunteers. Twelve participants were allocated to three groups: pediatric SCD, age <18 years (N = 4); adult SCD, age ≥18 years (N = 4); and healthy volunteers, age ≥ 18 years (N = 4). Enrollment into each group stopped when its intended sample size was reached. Participants who did not complete at least the third study visit were withdrawn and replaced; their data were saved but not used in this analysis (Fig. 1 of the Electronic Supplementary Material [ESM]).
2.3 Study Intervention
l-glutamine powder (Endari®) was dissolved in 120 mL of water and taken by mouth at 3 ascending dose levels for 3 consecutive weeks as shown in the study schema (Fig. 1). Weight-based doses (0.1 g/kg twice daily, 0.3 g/kg twice daily, and 0.6 g/kg once daily) were supplied as re-packaged Endari® powder for specific individualized doses (i.e., not rounded to the nearest Endari® packet size). Between study visits, participants continued to take l-glutamine until the next weekly study visit, when the dose was increased (visit 2) or continued unchanged (visit 3). Study medication was stopped at the end of visit 4, but patients could choose to continue l-glutamine for clinical care using commercially available products. Concomitant treatment with hydroxyurea was allowed, but the dose must have been stable in the 3 months preceding enrollment and unchanged during the trial. Other disease-modifying pharmacotherapies were similarly allowed. Participants with SCD who began a new disease-modifying therapy or had dose adjustments during the trial would be withdrawn. Long-term transfusion therapy was an exclusion criterion, and transfusions were a reason for early withdrawal from the study. Standard clinical care was not restricted.
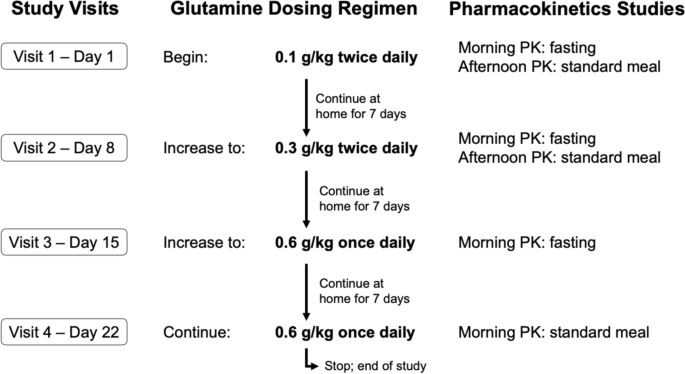
Study schema.l-glutamine dosing regimen and pharmacokinetic studies are shown by study visit. PK pharmacokinetics
2.4 Data Collection and Laboratory Analysis
Blood samples for the PK analysis were collected at baseline (immediate pre-dose) and 30, 60, 120, 180, and 240 min after the morning dose of l-glutamine (visits 1, 2, 3, and 4) and after the second dose in the afternoon (visits 1 and 2) using the same timing. To assess potential food–drug interactions in the PK analyses, l-glutamine was administered either following an overnight fast (a.m. doses on visits 1, 2, and 3) or after standardized meals (lunch on visits 1 and 2, and breakfast on visit 4) as illustrated (Fig. 1). Plasma was separated by centrifugation within 1 h of collection and frozen immediately (− 20 °C) until analysis in batches. The concentration of l-glutamine and other amino acids including a major l-glutamine metabolite, l-glutamate, were measured by ion-exchange chromatography (L-8900 Amino Acid Analyzer; Hitachi, Bethesda, MD, USA) using a Clinical Laboratory Improvement Amendments-certified process.
2.5 Descriptive Non-compartmental Pharmacokinetic Analysis
A descriptive non-compartmental PK analysis (NCA) was conducted using Phoenix WinNonlin® Professional Version 8.4 (Certara USA Inc., Princeton, NJ, USA). Parameters obtained included: (1) time to peak concentration (Tmax); (2) actual and dose-normalized peak concentrations (Cmax); and (3) the apparent terminal elimination half-life (T1/2), calculated as 0.693/λz. Considering l-glutamine is an endogenous amino acid, Cmax values were obtained by subtracting baseline concentrations from peak values. The apparent terminal elimination rate constant, λz, was estimated by linear regression on the terminal phase of the semi-logarithmic plasma concentration-versus-time curve. At least three data points with measurable concentrations were required to calculate λz. Points prior to and including Cmax were not used. The λz was only calculated when the coefficient of determination (r2) for the linear regression was ≥ 0.8.
2.6 Population PK Modeling
2.6.1 Base Model Development
To better understand the covariate effects on PK parameters, population PK analyses were performed by nonlinear mixed-effect modeling using NONMEM (ICON, Ellicott City, MD, USA) [21]. Perl speaks NONMEM (PsN) version 3.6.2 [22] and Pirana version 2.7.1 (Certara USA Inc.) were used as the interface. NONMEM version 7.4 with the first-order conditional estimation with η–ε interaction algorithm was employed to estimate the typical population parameters, random effect of inter-individual variability, and residual errors simultaneously. The inter-individual variability was assessed using the following model (Eq. 1):
where Pi is the estimated parameter value for individual I, Ppop is the typical population value of the PK parameters such as clearance and volume of distribution, and ηi is an inter-individual random effect for individual i. Inter-occasion variability was also evaluated [23]. For the full dataset, four occasions were defined. The intra-individual variability was described by a proportional and additive error model (Eq. 2).
where Yi,j is the observed concentration, Cpred,i,j is the predicted concentration for individual i, and ε is a residual error.
For the PK analysis, the individual baseline l-glutamine concentration was subtracted from each l-glutamine measurement to obtain the absolute concentrations of l-glutamine due to the drug intake, assuming that the endogenous l-glutamine level is constant. Different base models including one-compartment and two-compartment with first-order or Michaelis–Menten disposition models were tested. A first-order absorption with or without a lag time was evaluated as the absorption model. Efforts were also made to model the parent drug, l-glutamine, and its metabolite, l-glutamate, simultaneously. However, the parameter for describing the glutamine-glutamate conversion was small and near the zero boundary, indicating the concentration of l-glutamate is small and could be ignored.
2.6.2 Covariate Analysis
Variables such as body weight, age, height, body surface area, sex, l-glutamine dose levels, food intake, serum creatinine, Hb genotype (HbAA [healthy volunteers], sickle-hemoglobin C disease or homozygous sickle cell anemia), baseline l-glutamine concentration, and baseline l-glutamate concentration were evaluated as potential covariates using the stepwise selection method. The meal effect was considered as a categorical covariate and was coded as 0, 0.5, or 1 for fasting, snack intake, and full meal intake, respectively. If the participant consumed a snack and a full meal between two consecutive measurements, the meal was coded as 1.5. For covariate model selection, the change in the objective function value (OFV) between two nested models was assumed to follow the χ2 distribution, and forward inclusion and backward elimination with a significance level of < 0.05 (− 3.84 points in OFV) and < 0.01 (− 6.64 points in OFV) were used, respectively. In accordance with allometry theory, body weight was found to be significantly correlated to l-glutamine clearance (CL/F) and volume of distribution (V/F) at initial evaluation, where F represents relative bioavailability. We therefore used allometrically scaled body weight to account for differences in body size as follows (Eq. 3):
where BWi is body weight for individual i, BWstandard is 70 kg, and power is the coefficient set at 0.75 for CL/F and 1 for V/F. Other patient characteristics and laboratory measurements were tested as formulated for categorical or continuous covariates as demonstrated by Eqs. 4 and 5, respectively:
where Pi, COVcat, and COVcon are the parameters for individual i, COVmedian is the standardized value for a continuous covariate, and Ɵ represents the power factor of the relationship.
2.6.3 Model Evaluation
The following criteria were considered for model selection: successful convergence, OFV (or Akaike Information Criterion), precision of parameter estimates, and plausibility of parameter estimates. In addition, diagnostic goodness-of-fit plots and graphical assessments were performed using R version 3.6.2 and Xpose version 4.4.0 [24]. The following diagnostic plots were used to evaluate the models: observed value (DV) versus population predicted value (PRED), DV versus individual predicted value (IPRED), conditional weighted residuals versus PRED, and conditional weighted residuals versus time after dose to identify a bias corresponding to model misspecification. A non-parametric bootstrap analysis was employed to evaluate the stability of the final model using Perl-speaks-NONMEM (PsN) version 3.5.3. The resampling was done 1000 times, and 95% confidence intervals of parameter estimates from the bootstrap analysis were compared to the final model estimates. The visual predictive check was used for the final evaluation [25]. One thousand replicates of simulated datasets were generated using the final model, and the distribution of simulated observations was compared with the actual observations.
2.7 Additional Statistical Analysis
A Student’s t-test was used for the comparison of PK parameters (e.g., Cmax, area under the curve) between dose groups. P-values <0.05 from two-sided tests were considered statistically significant.
3 Results
3.1 Participants
We enrolled 15 participants, 12 of whom completed at least the third study visit (Fig. 1 of the ESM). The data from the three withdrawn participants were not included in this analysis. Characteristics of the final study population (N = 12) are shown in Table 1. Overall, two thirds were female with an age range of 6.8–43.8 years. Among the SCD group, there was an equal distribution of genotypes (four homozygous sickle cell anemia, four sickle-hemoglobin C disease) and hydroxyurea use (four yes, four no). Healthy volunteers had normal Hb phenotypes and blood counts.
3.2 Descriptive PK Analysis
After oral administration, l-glutamine plasma concentrations peaked (Tmax) at an average (mean ± standard deviation) of 1.2 ± 0.9 hours (Fig. 2). Compared with dose levels of 0.1 g/kg and 0.3 g/kg, the Tmax was higher at the dose of 0.6 g/kg (p < 0.05), indicating slower absorption at higher doses. At the lowest dose (0.1 g/kg), l-glutamine concentrations returned to baseline concentrations within 4 hours. However, with 0.3 g/kg or 0.6 g/kg dosing, the plasma l-glutamine concentration remained higher than baseline at 4 h. No significant changes in the baseline plasma l-glutamine concentrations were observed between visits (Fig. 2). Peak l-glutamine concentrations (Cmax) were higher at each successive dose escalation, but dose-normalized Cmax decreased successively, indicating non-linear pharmacokinetics (Fig. 3). The T1/2 had an average value of 1.0 ± 0.7 h from visits when samples were rich enough to calculate the T1/2.

Pharmacokinetic profiles of l-glutamine and l-glutamate. Mean (± standard deviation) concentrations of l-glutamine (black) and glutamate (blue) are shown by time (hours) after the first dose of study medication for each visit. Study visits are arranged by columns, and study groups (1 = pediatric sickle cell disease, 2 = adult sickle cell disease, and 3 = healthy volunteers) are arranged in rows. The baseline glutamine concentrations from visit 1 are shown by the dotted red line in all graphs to demonstrate the return to baseline concentrations across multiple doses

l-glutamine peak concentration (Cmax) normalized by dose. Dose-normalized Cmax decreased with dose escalation, indicating capacity-limited non-linear pharmacokinetics of oral l-glutamine
3.3 Population PK Modeling
For PK modeling, a one-compartment model with first-order input and disposition was found to outperform other base models examined. The inclusion of inter-occasion variability on the clearance significantly improved the model with a reduction of OFV by 34.5 units. Allometrically scaled body weight was included in the model to account for body size-related differences in volume of distribution and clearance with the theoretical values of 0.75 for clearance and 1 for volume. This inclusion resulted in a significant improvement in model fit (ΔOFV = − 13.9, p < 0.001). Of note, when the quantitative impact of weight on PK parameters was estimated as a power function, as shown in Eq. 5 (Table 2), the exponents were estimated as 0.73 for clearance and 0.78 for volume, respectively, similar to the theoretical values of 0.75 and 1. Pre-dose l-glutamine baseline was identified as a significant covariate for clearance (ΔOFV = −8.6; p < 0.01), with a negative relationship in which higher pre-dose baselines were associated with decreased l-glutamine clearance.
To describe the non-linear pharmacokinetics observed in the NCA, we tested a Michaelis–Menten base model structure. However, the model was found to be unstable. We found that the dose level was significantly associated with the volume of distribution (ΔOFV = − 7.8; p < 0.01): the higher the dose, the lower the relative bioavailability.
No effects of age, sex, Hb genotype, serum creatinine levels, or baseline l-glutamate concentrations on l-glutamine pharmacokinetics were observed. The population PK parameter estimates and bootstrap results are summarized in Table 2. The population clearance estimate was 78.5 L/h/70 kg, and the volume of distribution estimate was 52.3 L/70 kg. Goodness-of-fit plots indicated slight over-predictions of high concentrations but showed an overall reasonable model fit (Fig. 2 of the ESM). The simulated plasma concentrations by visual predictive check analyses were in reasonable agreement with the observed data. The 2.5th, 50th, and 97.5th percentile of predictions overlaid well with their corresponding percentile of observations (Fig. 4).

Prediction-corrected visual predictive check of the final population pharmacokinetic model. The x-axis indicates time after the baseline glutamine concentration. The y-axis is the prediction-corrected glutamine concentration. Individual data points are shown in small open figures in black. The red line is the median of the observed data. The dashed black lines show the 2.5th and 97.5th percentiles of the observed data. The area shaded light red shows the 95% confidence interval of the model-predicted median. The area shaded in gray shows the 95% confidence interval of the model-predicted 2.5th and 97.5th percentiles
3.4 Tolerability and Toxicity
Five participants reported adverse events; none was severe (Table 1 of the ESM). Gastrointestinal complaints (dyspepsia, nausea, vomiting, and diarrhea) were most common, occurred mostly at the 0.6occurred mostly at the 0.6 g/kg dose level, and led to early discontinuation of therapy in one participant. Blood urea nitrogen increased with l-glutamine treatment (8.8 vs 12.5 mg/dL, p = 0.004) but not creatinine (0.63 vs 0.63 mg/dL, p = 0.887), comparing values at the screening visit to visit 2. Ammonia levels did not increase or differ across study visits (p = 0.349). There were no changes in electrolytes, hepatic enzymes, and coagulation testing (data not shown). l-glutamate levels increased transiently after l-glutamine doses, which was an effect that appeared to be more prominent in healthy volunteers (Fig. 2).
4 Discussion
This is the first PK study of multiple-dose, long-term, oral l-glutamine therapy and the first population PK analysis of l-glutamine for SCD. We observed rapid oral absorption and a significant increase in l-glutamine concentrations, consistent with previous studies [19, 20]. Body size was found to be significantly correlated with l-glutamine clearance (CL/F) and volume of distribution (V/F). We identified a non-proportional increase in l-glutamine exposure with dose escalation, especially at the high doses. In our PK model, this phenomenon was described by the significant correlation between dose and volume of distribution. Consequently, doses > 0.3 g/kg do not yield proportionally higher blood concentrations. We found that higher pre-dose l-glutamine baseline levels were associated with lower l-glutamine clearance. This is likely because elevated levels of endogenous l-glutamine can potentially compete with exogenous l-glutamine for metabolism and other elimination processes. The covariate analysis further showed that food did not significantly influence l-glutamine clearance, suggesting that l-glutamine can be taken with or without food. One patient had marked dyspepsia at the high dose of 0.6 g/kg, indicating that high doses may not be palatable or tolerable. In addition, pharmacokinetics did not differ significantly with age, SCD genotype, or between participants with SCD and healthy volunteers. Overall, our findings support the current Food and Drug Administration-approved 0.3 g/kg twice-daily dosing regimen.
In our analysis, a one-compartment with first-order absorption model best described the oral l-glutamine concentration–time profiles. In an early PK and safety study, Ziegler et al. reported that the blood concentration fell in two elimination phases after subjects received l-glutamine intravenously, [19] which suggests that l-glutamine pharmacokinetics could be described by a two-compartment model. In their study, the first elimination phase, mostly caused by the distribution of the drug to extravascular space, was rapid with a T1/2 of 12 min. The T1/2 for the second phase, mostly due to metabolism and/or renal elimination, was 67 min. The disparity in model structure between our study and the study reported by Ziegler et al. could be due to different administration routes (intravenous vs oral) and PK sampling schemes. With a Tmax of 1.2 h seen in our oral dosing study, the rapid distribution of l-glutamine could be disguised by the gradual increase of drug concentration in the central compartment (i.e., blood circulation). In addition, our sampling scheme was sparse, which may also contribute to the simpler one-compartment model identified in our study in contrast to the two-compartment model reported by Ziegler et al. [19].
The oral clearance in our study was 78.5 L/h/70 kg when the dose level was normalized to 0.1 g/kg. This value is lower than the estimated 97 L/h reported in adults after a single intravenous injection at a dose level of 0.05 g/kg [19]. This discrepancy between studies was probably not due to significant differences in PK profiles as we observed similar l-glutamine exposure levels as reported in Ziegler et al., and l-glutamine T1/2 in both studies is approximately 1 h. The difference is more likely attributable to the way we structured the PK parameters in our model. In our analysis, clearance was estimated under a typical scenario with a glutamine baseline of 683 µmol/L and a dose level of 0.1 g/kg. In contrast, Ziegler et al. conducted an NCA that did not normalize the baseline l-glutamine level or dose level [19]. The volume of distribution of 52.3 L/70 kg was within the range of 512 ± 63 mL/kg and 1254 ± 84 mL/kg in the low-dose (0.1 g/kg) and high-dose (0.3 g/kg) oral studies as reported by Ziegler et al.
One limitation of the study is the sparse sampling scheme in some patients, causing difficulties in conducting a robust NCA in all patients. However, as shown in Fig. 2, we were able to depict the entire PK profiles. In addition, we used a population PK analysis that allowed us to obtain meaningful results using sparse sampling. We also studied a small number of participants, which may have limited our ability to detect some inter-individual differences in l-glutamine pharmacokinetics that may be present in the overall patient population.
5 Conclusions
In summary, this is the first PK study of multiple-dose, long-term, oral l-glutamine therapy and the first population PK analysis of l-glutamine for SCD. In general, our findings support the currently recommended dose of l-glutamine in SCD for both children and adults, with or without food, and in different hemoglobin genotypes. Pharmacokinetic-optimized dosing and PK-pharmacodynamic studies can now be performed to maximize treatment benefits.
References
Piel FB, Hay SI, Gupta S, Weatherall DJ, Williams TN. Global burden of sickle cell anaemia in children under five, 2010–2050: modelling based on demographics, excess mortality, and interventions. Plos Med. 2013;10: e1001484.
Quinn CT. Sickle cell disease in childhood from newborn screening through transition to adult medical care. Pediatr Clin N Am. 2013;60:1363–81.
Nardo-Marino A, Brousse V, Rees D. Emerging therapies in sickle cell disease. Br J Haematol. 2020;190:149–72.
Sadaf A, Quinn CT. glutamine for sickle cell disease: knight or pawn? Exp Biol Med (Maywood). 2020;245:1535370219900637.
Tao K, Li X, Yang L, Yu W, Lu Z, Sun Y, et al. Glutamine supplementation for critically ill adults. Cochrane Database Syst Rev. 2014;9:CD010050.
Durante W. The emerging role of L-glutamine in cardiovascular health and disease. Nutrients. 2019;11:2092.
Ahmadi AR, Rayyani E, Bahreini M, Mansoori A. The effect of glutamine supplementation on athletic performance, body composition, and immune function: a systematic review and a meta-analysis of clinical trials. Clin Nutr. 2019;38:1076–91.
Morris CR, Hamilton-Reeves J, Martindale RG, Sarav M, Gautier JBO. Acquired amino acid deficiencies: a focus on arginine and glutamine. Nutr Clin Pract. 2017;32:30S-47S.
Morris CR, Suh JH, Hagar W, Larkin S, Bland DA, Steinberg MH, et al. Erythrocyte glutamine depletion, altered redox environment, and pulmonary hypertension in sickle cell disease. Blood. 2008;111:402–10.
Shirahama K, Kubota S, Yang JT. Do amino acids reverse the sickling of erythrocytes containing hemoglobin S? Hemoglobin. 1980;4:149–55.
Mackenzie RD, Gleason EM, Schatzman GL, Cawein MJ. An in vitro method for screening compounds for the effect on the rate of sickling of erythrocytes. J Int Med Res. 1976;4:375–81.
Rumen NM. Inhibition of sickling in erythrocytes by amino acids. Blood. 1975;45:45–8.
Niihara Y, Miller ST, Kanter J, Lanzkron S, Smith WR, Hsu LL, et al. A phase 3 trial of L-glutamine in sickle cell disease. N Engl J Med. 2018;379:226–35.
Niihara Y. glutamine therapy reduces hospitalization for sickle cell anemia and sickle β°-thalassemia patients at six months: a phase II randomized trial. Clin Pharmacol Biopharm. 2014;3:1–5.
Quinn CT. Glutamine for sickle cell anemia: more questions than answers. Blood. 2018;132:689–93.
Gizi A, Papassotiriou I, Apostolakou F, Lazaropoulou C, Papastamataki M, Kanavaki I, et al. Assessment of oxidative stress in patients with sickle cell disease: the glutathione system and the oxidant–antioxidant status. Blood Cells Mol Dis. 2011;46:220–5.
Reid M, Badaloo A, Forrester T, Jahoor F. In vivo rates of erythrocyte glutathione synthesis in adults with sickle cell disease. Am J Physiol Endocrinol Metab. 2006;291:E73–9.
Zerez CR, Lachant NA, Lee SJ, Tanaka KR. Decreased erythrocyte nicotinamide adenine dinucleotide redox potential and abnormal pyridine nucleotide content in sickle cell disease. Blood. 1988;71:512–5.
Ziegler TR, Benfell K, Smith RJ, Young LS, Brown E, Ferrari-Baliviera E, et al. Safety and metabolic effects of L-glutamine administration in humans. JPEN J Parenter Enteral Nutr. 1990;14:137S-S146.
Morris CR, Kuypers FA, Hagar R, Larkin S, Lavrisha L, Saulys A, et al. Implications for the metabolic fate of oral glutamine supplementation within plasma and erythrocytes of patients with sickle cell disease: a pharmacokinetics study. Complement Ther Med. 2022;64: 102803.
Beal SL, Sheiner LB, Boeckmann AJ, Bauer RJ. NONMEM 7.4 users guide. Available from: https://nonmem.iconplc.com/nonmem743/guides. Accessed 11 Aug 2023.
Lindbom L, Ribbing J, Jonsson EN. Perl-speaks-NONMEM (PsN): a Perl module for NONMEM related programming. Comput Methods Programs Biomed. 2004;75:85–94.
Karlsson MO, Sheiner LB. The importance of modeling interoccasion variability in population pharmacokinetic analyses. J Pharmacokinet Biopharm. 1993;21:735–50.
Jonsson EN, Karlsson MO. Xpose: an S-PLUS based population pharmacokinetic/pharmacodynamic model building aid for NONMEM. Comput Methods Programs Biomed. 1998;58:51–64.
Bergstrand M, Hooker AC, Wallin JE, Karlsson MO. Prediction-corrected visual predictive checks for diagnosing nonlinear mixed-effects models. AAPS J. 2011;13:143–51.
Author information
Authors and Affiliations
Corresponding author
Ethics declarations
Funding
This research was supported by funding from Emmaus Medical, Inc., the manufacturer of Endari® (l-glutamine powder).
Conflicts of Interest/Competing Interests
Alina Sadaf, Min Dong, Amanda Pfeiffer, Teresa Latham, Theodosia Kalfa, Alexander A. Vinks, Russell E. Ware, and Charles T. Quinn have no conflicts of interest that are directly relevant to the content of this article.
Ethics Approval
The Cincinnati Children’s Hospital Medical Center Institutional Review Board approved this study, and it was conducted according to the guidelines of the Declaration of Helsinki and the International Conference on Harmonisation.
Consent to Participate
Adult participants provided written informed consent. Minors provided written assent, and their legal guardians provided written permission.
Consent for Publication
Not applicable.
Availability of Data and Material
The datasets generated and analyzed during the current study are available from the corresponding author on reasonable request.
Code Availability
Not applicable.
Authors’ Contributions
Concept and planning of the study: AS, MD, AP, TSL, TAK, AAV, REW, CTQ. Acquisition, analysis, and interpretation of data: AS, MD, AP, TSL, TAK, AAV, REW, CTQ. Drafting and/or critical revision of the manuscript: AS, MD, REW, CTQ. Approval of the final submitted version of the manuscript: AS, MD, AP, TSL, TAK, AAV, REW, CTQ.
Supplementary Information
Below is the link to the electronic supplementary material.
Rights and permissions
Open Access This article is licensed under a Creative Commons Attribution-NonCommercial 4.0 International License, which permits any non-commercial use, sharing, adaptation, distribution and reproduction in any medium or format, as long as you give appropriate credit to the original author(s) and the source, provide a link to the Creative Commons licence, and indicate if changes were made. The images or other third party material in this article are included in the article's Creative Commons licence, unless indicated otherwise in a credit line to the material. If material is not included in the article's Creative Commons licence and your intended use is not permitted by statutory regulation or exceeds the permitted use, you will need to obtain permission directly from the copyright holder. To view a copy of this licence, visit http://creativecommons.org/licenses/by-nc/4.0/.
About this article

Cite this article
Sadaf, A., Dong, M., Pfeiffer, A. et al. A Population Pharmacokinetic Analysis of l-Glutamine Exposure in Patients with Sickle Cell Disease: Evaluation of Dose and Food Effects. Clin Pharmacokinet 63, 357–365 (2024). https://doi.org/10.1007/s40262-024-01349-4
Accepted:
Published:
Issue Date:
DOI: https://doi.org/10.1007/s40262-024-01349-4