
Abstract
The need for data-driven decision-making primarily motivates interest in analysing Big Data in higher education. Although there has been considerable research on the value of Big Data in higher education, its application to address critical issues within the sector is still limited. This systematic review, conducted in December 2021 and encompassing 75 papers, analysed the applications of Big Data and analytics in higher education. The focus was on their usage in supporting learning, teaching and administration as reported in papers indexed in SCOPUS, Web of Science and IEEE Xplore. The key findings from the review revealed that Big Data and analytics are predominantly used to support learning and, to a lesser extent, guide teaching and informing administrative decision-making processes. The review also identified a set of studies focused on supporting student well-being. Further, we extend the use of Big Data in higher education to include the well-being of students and staff. This paper contributes to the growing debate on the practical use of Big Data and analytics to provide valuable insights for solving systemic challenges facing high education in the twenty-first century.
1 Introduction and related research
Higher education institutions generate large amounts of exponentially increasing ‘Big Data’ (Monino & Sedkaoui, 2016) either via interaction between different stakeholders or via stakeholders interacting with the learning management systems and student records systems. Although there is no single definition of Big Data (Arbia, 2021), it is generally described using 3 Vs (Erevelles et al., 2016; Grover et al., 2018; Ristevski & Chen, 2018) – volume (a large amount of data), variety (heterogeneity of data, ranging from structured to unstructured) and velocity (the speed with which the data can be accessed). Some researchers added veracity (data quality, e.g., Jin et al., 2015), value (the worth of the generated insights, e.g.Lycett, 2013; Naeem et al., 2022) or variability (the presence of inconsistency and noise, e.g., Jo, 2019). Regardless of any particular conceptualisation, the increasing amount of data generated in the higher education sector provides opportunities for extracting valuable, actionable insights, similar to other sectors. For example, in the healthcare sector (Singh et al., 2021), Big Data techniques are used in medical image processing to detect or predict disease progression (Rehman et al., 2022). In cybersecurity (Alani, 2021), Big Data and analytics are being used for ransomware (Huang et al., 2018) or phishing detection (Gutierrez et al., 2018). In addition, Big Data has been used for crop yield prediction (Abbas et al., 2020), digital marketing (Kushwaha et al., 2021) and search engine optimisation (Drivas et al., 2020).
With the increasing use of digital technologies to support learning and teaching, a significant amount of data is being generated, primarily by engaging students and faculty in learning management systems (LMS). This data can be harvested, processed and used to address critical challenges higher education institutions face. Drawing on the successes of using Big Data in various sectors, higher education can likewise seize the opportunity to apply Big Data techniques to gain valuable insight for decision-making. Early research noted that higher education is a sector yet to be penetrated by Big Data and analytics (Attaran et al., 2018), referring to Big Data as an ‘untapped opportunity’ in higher education (Chaurasia & Frieda Rosin, 2017). Several early articles discussed the potential of harnessing Big Data in higher education (e.g., Attaran et al., 2018; Daniel, 2017; Tasmin et al., 2020). For example, Daniel (2015) proposed three scenarios in which Big Data can support learning, teaching and administration. These scenarios were developed from a critical analysis of early work on applying Big Data in education. Chaurasia and Frieda Rosin (2017) further proposed four potential uses of Big Data in education, including reporting and compliance (which could be subsumed under supporting administration in Daniel's (2015) framework), analysis and visualisation (classified under supporting the teaching and learning process), security and risk mitigation (supporting administration) and predictive analytics (supporting the teaching and learning process). Big Data can identify at-risk students, provide individualised learning experiences, or improve student assessment (Ray & Saeed, 2018). However, it is less clear how much the value of Big Data in higher education has been fully realised over the 2011–2021 period.
A literature review indicated that each of these uses had been realised. As a point case, Waheed and colleagues (Waheed et al., 2020) focused on using Big Data to support learning. They demonstrated that a neural network model containing data from the virtual learning environment could predict students at risk of failing a course. On the other hand, Cooper et al. (2016) used Big Data to identify if courses have accessibility issues, demonstrating its use to support administration. Looking at individual papers may provide insights into a particular use of each of the scenarios proposed but not a comprehensive overview, as they are limited to demonstrating application to a single case study. Therefore, systematic reviews are beneficial for obtaining an overview of the application of Big Data in higher education.
Notably, current systematic reviews of Big Data in higher education focus on how learning analytics supports study success (Ifenthaler & Yau, 2020), the effectiveness of interventions on student outcomes such as retention, engagement and performance (Foster & Francis, 2020) and the effectiveness of learning analytics in addressing student dropout rates (De Oliveira et al., 2021). The relatively narrow focus of the existing literature is a drawback, as the systematic reviews focus on a single use of Big Data in higher education. Perhaps two exceptions are Baig et al. (2020), who examined the trends in 40 published papers on Big Data in education as well as research themes addressed in this domain, and Alkhalil et al. (2021), who conducted a systematic mapping study on the use of Big Data in higher education. However, Baig et al.’s (2020) review focused on general education, without considering the specific characteristics of higher education settings. Similarly, Alkhalil et al. (2021) mapping article does not provide a summary and synthesis of the application of Big Data in higher education. As a result, there is limited research providing a broader overview of the available literature on the role of Big Data and associated analytics in higher education.
Further, it seems that studies focusing on Big Data are predominantly concerned with system performance, such as the development of predictive algorithms (Ifenthaler & Yau, 2020) or student satisfaction with using a dashboard (Ramaswami et al., 2019) but less on the application of those algorithms or the usage of the dashboard for the betterment of students’ learning outcomes. Moreover, the available reviews predominantly focus on the potential benefits of learning while neglecting the benefits for teaching and administration, leaving the question of whether the latter applications are lacking or if those conducting the reviews have paid more attention to the benefits of learning.
Furthermore, it remains unclear what challenges are faced when Big Data and analytics are used in higher education. For example, technical issues, ethical considerations, and practical limitations have posed significant obstacles to the widespread adoption of Big Data in higher education (Daniel, 2019; Klein et al., 2019).
In this article, we report on the outcome of a systematic review of the application of Big Data in higher education that covers published work from 2011 to 2022, providing a comprehensive picture, identifying gaps and suggesting directions for future research. Our work opens up a valuable dialogue for policymakers interested in incorporating Big Data analytics into their operational and strategic initiatives.
1.1 Framing the review
The systematic review examines the literature on using Big Data in higher education in 2011–2022. We were particularly interested in research that showcased some benefits, improvements or otherwise contributed to decision-making or better student outcomes. The following questions guided the systematic review:
-
1
What are Big Data's and related analytics' existing uses in higher education?
-
2
To what extent does applying Big Data and analytics support learning, teaching or administrative decision-making in higher education?
-
3
What are the existing challenges of applying Big Data in higher education?
2 Method
Prior to conducting the systematic review (a type of descriptive research), we performed a broad search ("big data" AND "Education") to familiarise ourselves with the scope of the literature and core keywords and to develop the exclusion criteria. Upon identifying the main keywords, we constructed our query (( ( "learning analytics" OR "big data" OR "data mining" OR "dashboard" OR "academic analytics") AND ( "higher education" OR "tertiary education" OR "HEI" OR "University" OR "College" OR "Faculty") AND ( "intervention" OR "implementation" OR "case study" OR "application") AND ( "improve" OR "enhance" OR "decision making"))). We searched the title, abstract and keywords in SCOPUS, Web of Science and IEEE Xplore. Web of Science was chosen for its multidisciplinarity, and because it is the leading citation search database (Li et al., 2018), SCOPUS is the largest abstract database (Schotten et al., 2017), and IEEE as the database containing computer science papers.
The search (December 2021) resulted in 1,072 entries; however, upon removing the duplicates, there were 851 entries. Articles not in English, review articles and editorials were excluded from the search. Also, we limited the search to the following categories: "Education", "Educational research", "Computer Science OR Information Systems", "Computer Science Artificial Intelligence", "Computer Science Interdisciplinary applications", "Education Scientific disciplines", and "Telecommunications" (in Web of Science), as well as to "Computer Science" and "Social Sciences" (in Scopus). The screening of the articles underwent two stages. In the initial stage, the first author read the titles of the article to determine whether they are relevant to the study research questions. In the second stage, the abstracts were read to determine if the articles would be retained for analysis. If no decision could be made based on the abstract, the full text was screened too. The first author read and summarised all included studies. We excluded papers (1) whose context was not higher education, (2) that focused on attitudes, beliefs or opinions about Big Data. Our exclusions also extended to (3) discussion/conceptual/review papers, (4) papers where Big Data was not the main focus, (5) papers that dealt with teaching of Big Data, (6) papers merely focused on the performance of algorithms (7) papers dealing with architecture, (8) papers with incomprehensible abstracts (9) papers whose full text was not available and, (10) retracted articles because of nonsensical content. The search procedure and retention of articles for the final review are depicted in Fig. 1. The summary of the reviewed studies is given in Table 1 in the online supplementary materials.
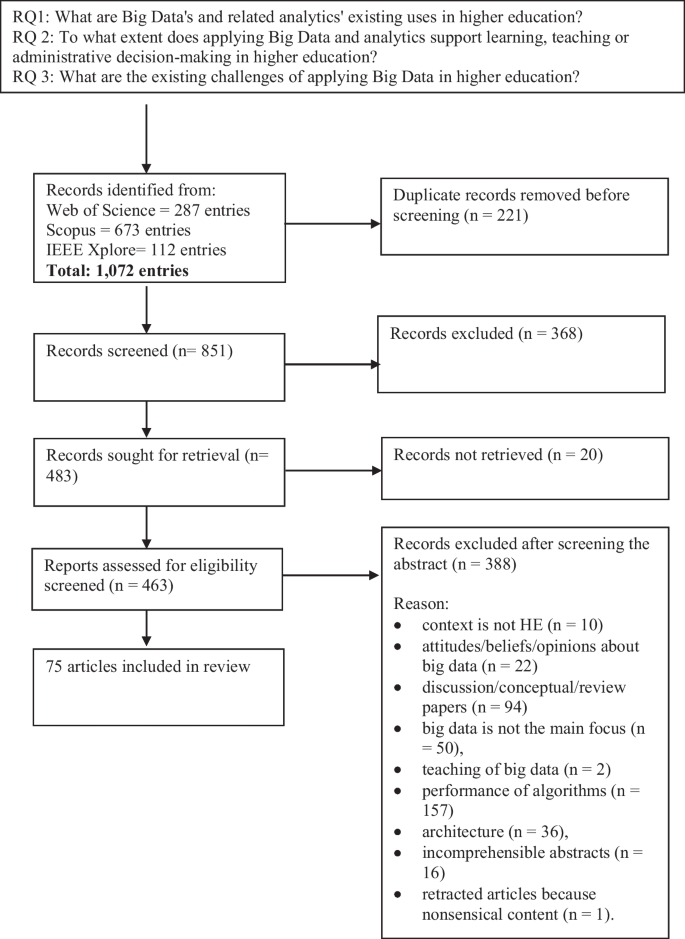
Flowchart for the paper selection process
In this review, we did not perform a formal quality or risk of bias assessment as our focus was primarily on mapping the types and areas of Big Data applications in higher education, aligning with this study's descriptive and exploratory nature. The review was not registered. Online first (ahead of print) articles were also included in the review.
3 Results and discussion
In presenting the findings, we were guided by the tripartite approach (Daniel & Harland, 2017), which suggests systematic review studies should be described, synthesised and critically evaluated to provide new insights for further research.
3.1 Description of the studies
We used descriptive statistics to summarise the findings of the review. Figure 2 presents the number of published articles per year. As shown from the figures, the number of articles published per year shows an upward trend, implying that the interest in research into the role of Big Data in higher education continues to grow globally.

Number of published papers per year
The majority of the papers were from the US (f = 14), followed by papers co-authored with scholars affiliated with universities in different countries (f = 8), Spain (f = 7), the UK (f = 6), China (f = 5), Indonesia, Finland and Australia (all had a frequency of f = 3), Türkiye, Singapore, Japan, Italy, India and Ecuador ( all had a frequency of f = 2), and Vietnam, Sweden, South Korea, Philippines, Ireland, Iran, Greece, Czechia, Chile, Canada and Belgium (all had a frequency of f = 1).
3.2 Synthesis of the studies
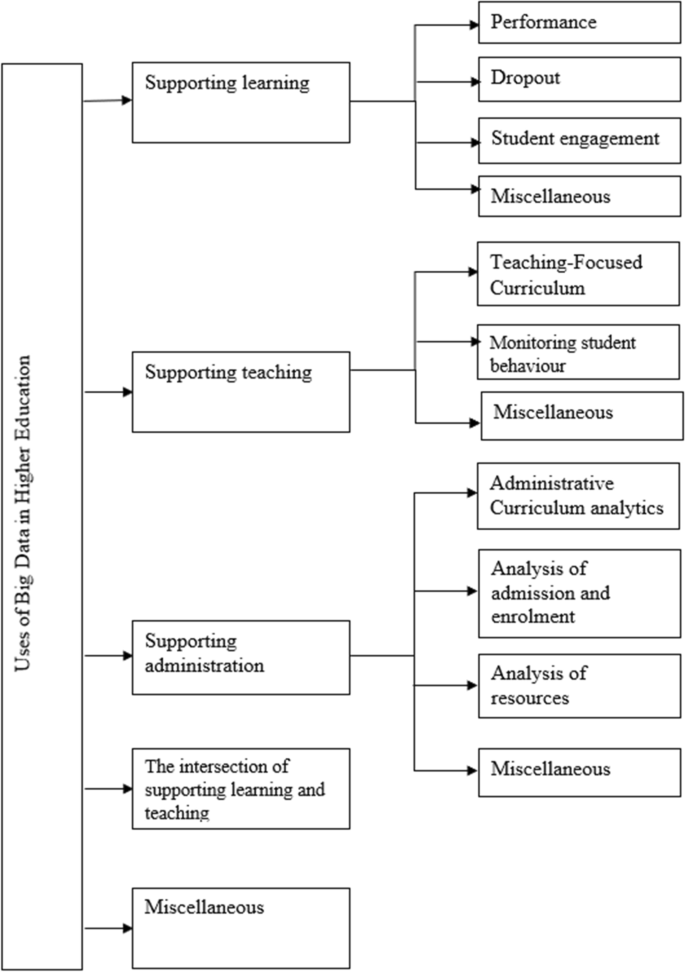
In synthesising the findings, we grouped the publications into three main use categories: Big Data's role in supporting learning, teaching, and administration (Daniel, 2015). As will be seen later, some could not be classified into either of these, and we included additional categories (see Fig. 3).
Graphical representation of the uses of Big Data in higher education
3.2.1 Supporting learning
Performance
At the time of the review, most published studies focused on supporting students' learning or various aspects of it. One of those aspects is the discourse of Big Data as it relates to predicting student performance. For example, Castells et al. (2020) and Perez and Gonzalez (2016) presented a tool that predicts students' performance, while Prieto et al. (2020) presented two case studies related to the development of a data visualisation tool that analyses student performance and facilitates conversations between students and councillors. Furthermore, Gutiérrez et al. (2020) presented a learning analytics dashboard that uses a multilevel clustering algorithm to predict a student's success in an academic programme and then depicts that chance along with information on the quality of the prediction. Other studies reported using learning analytics to generate student dashboards (Ramaswami et al., 2019); dashboards display an individual's activity or performance and compare it to the average in the class or use an explainable LM algorithm (Afzaal et al., 2021). Researchers have also used students’ data to identify the factors behind the predicted performance in quizzes and assignments and provide information on how the prediction could be improved by listing activities to be performed (e.g. watching a video) (Azcona et al., 2017).
In addition to the development of dashboards, researchers (Lonn et al., 2015) also endeavoured to discover the relationship between advisors’ use of learning analytics early warning system, which used information from a learning management system to provide weekly updates about student engagement and performance to advisors, and their students’ performance during a summer bridge program. Also, researchers used on-campus geolocation data to identify study groups and examine the performance among group members (Azcona et al., 2017) or examined the link between learning input (the frequency of playing videos) and performance (Ji & Han, 2019). Similarly, others discussed the associations between performance, submission time and the number of submissions, how work at night or weekends impacts performance, or how different group work patterns affect performance (Apiola et al., 2019).
Other uses of Big Data included the prediction of whether students will graduate within four years (He et al., 2018), examining the relationship between performance and digital footprint, identifying engagement patterns as an early predictor of performance, and correlating performance at an early stage and overall performance (Summers et al., 2021). The research examined the effect of intervention in the form of guidance and recommendations (prepared by the teacher and based on learning analytics) on students' academic self-efficacy and problem-solving skills (Karaoglan Yilmaz, 2022) as well as developing tools (Broos et al., 2018) that provides feedback about the performance on a positioning test (abilities to solve math problems). Studies reported the effect of learning analytics intervention on student performance in a blended course (Gong et al., 2018; Zhang et al., 2020), applied uplift modelling to demonstrate that offering tutorials to students with the most considerable likelihood to be retained as a result of the tutorials, boosts the effects of such retention efforts (Olaya et al., 2020).
Dropout
Researchers were interested in students dropping out both late and early. For example, Salazar-Fernandez et al. (2019) analysed the educational trajectories of 414 students in courses with high failure rates to identify similarities and differences between students. In particular, they looked at factors such as gender, income and entry math skills that could explain the different trajectories and failure rates. On the other hand, Dodge et al. (2015), Figueroa-Cañas and Sancho-Vinuesa (2021), and Linden & Webster (2019) trialled an intervention aimed at minimising the number of students who are unlikely to succeed earlier on in their academic programme. Similarly, Herodotou et al. (2020) demonstrated how PLA (predictive learning analytics) could inform the practice of the student support team who contacted the students identified as having a low probability of completing their studies. To identify causes of academic failure, Nkhoma et al. (2020) analysed 968 letters (written by students in a business school) using natural language processing (at the university in question, students who satisfy the criteria to be classified as "at risk" are asked to explain their situation in a letter and work with an advisor on a study plan). Frequencies of the most common words and word pairs were extracted, enabling the researchers to identify the most common reasons. To gain more insights from the data and provide context for the keywords by modelling the relationship between them, the researchers used visualisation based on semantic network analysis and topic modelling to validate the findings. Five significant reasons were identified: learning skills, assessment, time management, courses and family issues. Géryk and Popelínský (2014) presented an interactive visual analytics tool EDAIME that explores academic analytics and examines whether changes in the fields of study are related to retention.
Student engagement
Most studies focused on student engagement reported either a pattern of engagement with the learning resources (Nkomo & Nat, 2021) or the results of an intervention aimed at increasing student engagement (e.g., Lawrence et al., 2019; Lu et al., 2017). For example, Karaoglan Yilmaz and Yilmaz (2022) provided students in the experimental group (N = 33) with personalised metacognitive feedback (based on learning analytics containing info on the weekly learning management system use) and personalised recommendations and compared their engagement to that of the control group. Similarly, Cobos and Ruiz‐Garcia (2021) provided intervention in the form of feedback about students' progress, as well as suggestions for improvement of performance, to examine whether an intervention can change the engagement of students enrolled in a MOOC (massive open online course) as well as the perception about their persistence, intention to complete and pass the course, and performance. Álvarez-Méndez et al. (2020) extracted Moodle log files (N = 33,776) for 121 students and analysed them to examine their interactions with the LMS resources.
Another, more unusual utilisation of Big Data in understanding engagement was observed by (Cheong et al., 2018). They presented the results of piloting an integrated Telegram Application and web-based forum that uses natural language processing and text mining to provide thoughtfulness scores on students' questions and answers as they write them with the idea that students might gain insight into how the document is developed and that their contribution to it may foster metacognitive skills. McNely et al. (2012) presented a visualisation tool (Uatu) that provides real-time engagement metrics on co-authorship and collaborative writing. Wang et al. (2021) were interested in what features could be derived from the logged interactions data of the problem-solving process during a simulation and whether the extracted features could predict success or failure in problem-solving.
Miscellaneous
Other uses of Big Data for supporting student learning can be seen in the work of Althbiti et al. (2021), who introduced PAARS (Personalised Academic Advisory Recommender System), an automated recommender system for courses that helps students with course selection. The students can input their research area or learning objectives, and the system provides a list of recommended courses based on content-based filtering algorithms and ensemble learning algorithms. Another example of miscellaneous use is Park and Jo (2015), who developed a learning analytics dashboard called LAPA (Learning Analytics for Prediction & Action), which supports students learning by informing them of their online behaviour.
3.2.2 Supporting teaching
Teaching-focused curriculum analytics
Dawson and Hubball (2014) developed and implemented a curriculum analytics tool that visualises the connections between courses in a curriculum network. The tool can analyse individual student learning pathways and identify dominant student pathways or curriculum pathways that impede/promote timely completion. Similarly, Hilliger et al. (2020) present a tool that generates reports of attained competencies at the course and program levels. In a different paper, Barb and Kilicay-Ergin (2020) evaluate the curriculum coherence of the Information Science programme by identifying academic overlaps and gaps using ontologies and natural language processing.
Monitoring student behaviour
Other uses include examining if students engage with the learning materials as intended. For example, Nagi (2019), Alachiotis et al. (2019), Ayub et al. (2017), and Llopis-Albert and Rubio (2021) extracted learning analytics from the learning management system to examine if students were engaging with the assigned hands-on activities (e.g., participation in quizzes, visits to the platform), while Harindranathan and Folkestad (2019) examined whether student behaviour in terms of quiz taking was aligned with the intention of the instructional design by extracting and analysing Canvas quiz log data. Similarly, Baralis et al. (2017) set out to find out whether the planned objectives of the educational video service, such as appreciation (number of accessed courses), effectiveness (as reflected in the correlation between use and performance) and flexibility, were reflected in the users’ behaviour. In addition to examining the use of video recordings, Sarsfield and Conway (2018) also looked at potential differences between subgroups of students and modules in terms of usage. To examine if there are differences in learners in the use of practical vs theoretical resources, Braccini et al. (2021) looked at 2,000,000 records while reviewing the visible (i.e. how many times a user replied to a post by a different user) and invisible interaction (i.e. how many times a user read a message by another user) of students, Hernández-García et al. (2016) extracted and analysed data from the LMS (~ 114,756 records).
Miscellaneous
Examples of miscellaneous use include Beasley et al. (2021), who analysed peer review text from two visualisation courses (~ 4,687 reviews in total) using sentiment analysis and Gottipati et al. (2017), who present a learning analytics tool that analyses qualitative data by extracting the sentiments of the feedback that students leave at the end of the course.
To capture the effectiveness of peer instruction compared to traditional teaching, Kuromiya et al. (2020) chose the number of access to Moodle content, Moodle quizzes, Moodle forum and Moodle resources as engagement indicators. They compared these indicators for periods when three teachers held traditional lectures vs peer instruction (intervention period).
3.2.3 Supporting administration
Administrative curriculum analytics
Regarding supporting administration, one common use of Big Data is the examination of curriculum analytics. Armatas et al. (2022) developed a programme review tool to conduct learning analytics associated with the performance of a programme. The tool’s forms of analysis include network analysis, grades analysis (e.g., information about how complex a subject is), and prediction of award GPA (grade point average). Similarly, Cooper et al. (2016) use Big Data to identify accessibility deficits in courses by recording the percentage of students (2009–2013) who declared and did not declare a disability and comparing the odds ratio for completing each module and thus were able to pinpoint several modules that may have accessibility issues.
Analysis of admission and enrolment
The use of Big Data for tracking admission is reported in the work of Khudzaeva et al. (2018), who used clustering techniques to group the high schools based on the GPA of students so that they could change the quotas for admission according to the results (e.g. increase quotas for school that produce students who have high GPA, and reduce for those with low). Another example is Burkhardt et al. (2016). They conducted retrospective data analysis of the admission and enrolment data. They produced a dashboard using Visual Basic and Excel to allow decision-makers to input student factors (e.g., financial aid offers) and obtain output as predicted enrolment.
Analysis of resources
Big Data was also used to study the available resources at an institutional level. For example, Alrehaili et al. (2021) present the Higher Education Activities and Processes Automation Framework (HEAPAF) and higher education ontology. This framework can be used to extract data from different resources. The authors use it to analyse, find, and rank the right resources for teaching a course. Likewise, to examine the collaborative relationship between authors and determine experts in particular fields through social network analysis (Elisabeth et al., 2019), the authors downloaded the metadata of published articles from Scopus, which contained the authors’ names, keywords, affiliations and funding. They examined author-author links, author-keywords, and author affiliations by creating a graph of the author network, which showed the connectedness between authors and the most central (famous) authors in a network. Anastasios et al. (2011) present a tool that evaluates the research performance of a university and the achievement of a research policy using multiple indicators. The tool provides graphical visualisation (e.g., network analysis) on four indicators: scientific publications, collaboration with other higher education institutions, and collaboration with industry and research sectors. Scholars (Srinivas & Rajendran, 2019) also report on SWOT (strengths, opportunities, weaknesses and threats) analysis with the help of text analysis of students' online reviews (N = 24,390) collected from a university review website. The authors used topic modelling (to automatically identify predominantly discussed topics and categorise each sentence in the appropriate topic), sentiment analysis (to detect the affect associated with each sentence), and SWOT analysis using the topic-based opinion summaries to identify strengths and weaknesses. They compared the topic opinion summaries concerning their university to those of other universities to identify threats and opportunities.
Miscellaneous
Other studies report administrative use of Big Data more broadly on the university campus. For example, Du et al. (2019) uncovered student recreation centre usage patterns by using historical data from swipe cards and user profile data. They developed a web app that predicts visit volume. At the same time, Xia and Liu (2018) used library data of 18,294 students and staff about the books borrowed in 2017. They examined the relationship between readers and book categories to inform decision-making and give recommendations (e.g., books that are frequently borrowed together to be located near each other). Chi et al. (2012) developed SAS (smart alumni system) to connect alumni and students, which incorporates a social networking style mentoring system and uses data mining to discover user relationships. Alumni who have expressed interest in mentoring and guiding students on their career path are matched with students based on interests, occupation or the city where they live. Big Data has also been applied to examine the effect of training on the use of the academic management system and how enhanced usage of the system is reflected in the performance of staff and faculty (Joy & Nambirajan, 2021).
Other uses include Rad et al. (2011), who endeavoured to cluster and rank university majors in Iran. The authors identified 177 university majors from a list solicited from the relevant ministry, and eight main specialisation groups were defined. Then 64 experts were asked to compare the university majors' influence on these eight specialisation groups and the importance of each specialisation group for present-day Iran. Ten clusters were derived using k-means clustering.
3.2.4 The intersection of supporting learning and teaching
Some studies could not be categorised into supporting learning or teaching. Thus we created a separate category representing the intersection of supporting teaching and learning. A paper that fits into this category is Villamañe et al. (2016), who present RubricVis, a tool that provides visually enriched feedback for rubric assessment. The tool can present information as a radar graph; students can see their weak and strong areas, compare their performance to their peers in the group, and follow their progress. Teachers can observe a student's performance or a group of students, track their progress, or compare the performance of different groups.
A further example is Romero et al. (2013), who analysed the quiz results of 104 students and developed association rules. The quiz was changed, and the course was modified based on the results. The results of the students taking the original quiz were compared to those of two other groups taking the modified quiz. The updates in the quiz resulted in a better score, indicating that improvement in the course also improved performance.
Nguyen et al. (2018) examined the extent to which the students’ timing of engagement and instructors' learning design match, as well as how performance relates to study patterns (i.e. engagement), while Essa and Ayad (2012) present a tool (S3) that offers a 1) synoptic view of students' progress as well as visualisation and identification of students at risk; 2) comparison to another learner, as well as 3) sociogram showing patterns of collaborations.
Taniguchi et al. (2017) aimed to study the impression topics hidden in students' journals by extracting weekly keywords commonly mentioned in the journals and students' impressions regarding those keywords. Students (~ 100) in an "Information Science" course were instructed to write weekly reflective entries after class (total N of entries = 1,664). The weekly topics were frequently mentioned when students were writing about something problematic about them.
To profile students enrolled in a MOOC on an IELTS preparation course, Ocaña et al. (2019) obtained the data of 22,164 students via the EdX platform and applied the k means algorithm to attain five clusters: strong starters, weak finishers, more content, less assessment; more assessment, less content; very high engagement, moderate performance; high engagement, high performance. Laakso et al. (2018) present ViLLE, a tool that automatically assesses exercises and provides insights to the teacher.
3.2.5 Miscellaneous
This section summarises the application of Big Data in higher education, which could not be neatly classified into support for learning, teaching or administration, or the intersection of two or more. McCulloch et al. (2021) created a visualisation tool and web-based visual analytics dashboard for empowering autistic students to communicate their experiences and manage their activities. The visualisation highlights students' physiological status (e.g. stressed vs unstressed) and marks locations related to high stress (using geolocations and Fitbit data), nudging them to consider stress management techniques. The tool also visualises sleep quality (timing and duration of each sleeping phase).
To identify the discourse in the social media footprint left by students on unofficial Facebook pages of 41 private and public higher education institutions in the Ilcos Region in the Philippines, Aviles and Esquivel (2019) used sentiment analysis to determine the polarity of the posts and comments (N = 3,000). A web-based application classified the posts into five categories (academics, social engagement, emotions, finances, policies and health). A word cloud of the most frequent words was produced. The majority of the posts were positive and related to social engagement. Similarly, to analyse student feedback from Twitter API and web applications using sentiment analysis Sivakumar and Reddy (2017) extracted tweets on engineering education and then calculated their emotion and polarity.
To examine the affective response evoked by viewing one’s learning analytics information, Joseph-Richard et al. (2021) asked 42 students to indicate their emotional reactions using a questionnaire while they watched their learning analytics. Students reacted to watching their learning analytics with diverse emotions. Viewing one’s own PLA did not necessarily lead to increased motivation but also led to fear, scepticism, and doubt.
To analyse student agency, 130 computer programming students completed a questionnaire measuring 11 dimensions of agency, and, based on the answers, they were clustered into one of four profiles (Jääskelä et al., 2021).
4 Critique
4.1 What are Big Data's and related analytics' existing uses in higher education?
The review reveals that the current application of Big Data and analytics in higher education is varied and spans the three spheres of supporting learning, teaching and administration. The majority of studies, however, reflected efforts to support learning, with fewer supporting teaching and administration. This trend suggests that the application of Big Data and analytics is recognised as a potentially powerful tool to enhance student learning outcomes, which aligns with previous research on the application of Big Data in education (Ifenthaler & Yau, 2020). Although most studies focused on exploring strategies to support student learning, the issues addressed predominantly assess students' performance, predict dropout rates and propose intervention strategies. Some studies employed sentiment analysis and the development of metacognitive skills.
In contrast, fewer studies focused on the role of Big Data in enhancing administrative issues. The few studies that reported using Big Data in decision-making related to administrative matters included curriculum analysis, addressing equity issues in representation and access to learning, admission processes, resources allocation, collaborative relationships or library usage, and conducting a SWOT analysis and social network analysis. This dearth of exploration might be due to factors such as more visible and immediate benefits in learning outcomes or potential skill gaps among administrative staff and aligns with Alkhalil et al.'s (2021) observation that current research on BD in higher education is still at an immature stage, which suggests the potential for further exploration in administrative decision-making. Leveraging Big Data in administrative functions presents immense opportunities for strategic planning, operational efficiency, and promoting equity in higher education institutions. By harnessing the predictive power and insightful analytics of Big Data, administrative decisions can be more data-driven and effective. This further underscores the importance of future research into administrative uses of Big Data. Such research would contribute to our understanding of the scope of Big Data applications in higher education and help identify and address potential barriers to implementation (Daniel, 2015).
4.1.1 Theoretical implications
Some studies could not be classified because they overlap between supporting teaching and supporting learning. It is good to remember that in practice, it is difficult to draw a line where the dimension of support for teaching ends and learning support begins. Ultimately, all teaching activity is aimed at supporting learning.
In comparing with the past studies, it is evident that our findings are consistent with previous findings (e.g., Aytaç & Bilge, 2020; Baig et al., 2020; Ifenthaler & Yau, 2020). However, a unique aspect we noticed is the emergence of Big Data applications to support stakeholder well-being, which has been less emphasised in earlier research. This observation opens up a new perspective on the potential of Big Data in education. Thus, we propose a three-dimensional model consisting of supporting the teaching and learning process, administration and supporting the well-being of actors in higher education. Thus, the model proposed by Daniel (2015) could be refined and updated to reflect the findings.
4.2 To what extent does applying Big Data and analytics support learning, teaching or administrative decision-making in higher education?
As discussed above, although we identified studies spanning the three applications, most focused on supporting students' learning. Moreover, even the studies focused on students have more to do with the data aspect than the learning aspect, as also identified by other studies (Ifenthaler & Yau, 2020). Thus, it seems that the potential of Big Data in higher education is underutilised.
4.3 What are the existing challenges of applying Big Data in higher education?
4.3.1 Ethical considerations are swept under the carpet
Few reviewed studies (e.g., Burkhardt et al., 2016; Joseph-Richard et al., 2021; Sarsfield & Conway, 2018) explicitly mentioned ethical considerations or if the study had ethics approval. This trend of low concern for ethical issues is in line with other studies that review 252 papers on learning analytics and found that only 18% mention ethics (Viberg et al., 2018). Yet, in the current climate of increasing discussions about data privacy and ownership (Ifenthaler & Tracey, 2016; Jones et al., 2020; Lawson et al., 2016) in educational technology research, such questions deserve deeper reflection and are likely to pose challenges for future research.
4.3.2 The focus is on the technology, not the stakeholder
As some other review studies noted (e.g., Ifenthaler & Yau, 2020), most publications focus on system performance and are more concerned with analytics than learning. This observation also aligns with other authors' views (Gašević et al., 2015; Roberts et al., 2017). Thus, the potential of Big Data and analytics is not adequately realised. For example, although Ocaña et al. (2019) discuss how profiling can identify at-risk students and improve course design and delivery, they do not take the profiling in their study one step further to implement this potential. Similarly, Ayub et al. (2017) state that the association rules obtained could be used to improve the learning management system but do not elaborate on how it could be achieved. Instead, they offer some generic advice, such as the introduction of gamification in the LMS, but it is unclear how those recommendations follow the association rules.
Further, as the findings by Joseph-Richard et al. (2021) suggest, the implementation of predictive learning analytics needs to be conducted with the student's well-being in mind, as some may experience nudging as nagging (Lawrence et al., 2019) and may not want to know their prediction (Afzaal et al., 2021) or may have privacy concerns (Laakso et al., 2018). Furthermore, the predictions may be confusing, especially if students do not know how the predictions are arrived at (Gutiérrez et al., 2020).
4.3.3 Eagerness to demonstrate the effectiveness
In some instances, the quality of evidence for a given claim needs to be more robust (Ferguson & Clow, 2017), as the studies examining intervention effectiveness do not always report the results of statistical tests. For example, Lawrence et al. (2019) report "increases in at-risk students engaging with their courses" (p. 53), but the researchers provide no statistics to back this claim. Likewise, in another cohort study with the intervention, 10 out of 35 took the final exam, and in the group without intervention, 4 out of 36 (Figueroa-Cañas & Sancho-Vinuesa, 2021), yet no formal statistical tests were reported. Hence, the effect remains unclear (i.e., are the descriptive differences due to chance, or do they represent a meaningful effect).
Similarly, Cobos and Ruiz‐Garcia (2021) report a "considerable imbalance" in the success rate between the control and experimental groups but have not provided the appropriate statistics. The conclusions drawn and the evidence to back them remain unclear even if statistical tests are performed. This is so because the applied statistical test is inappropriate for answering the research question. For example, Afzaal et al. (2021) conducted two separate paired samples t-tests to test if the students who used the dashboard between quizzes 1 and 2 performed better at the time two than those who did not. However, in this situation, a more appropriate approach would have been mixed ANOVA, with time one and time two performance used as a within-subjects factor and group as a between-subjects factor, as the increase in one group could be statistically insignificant from the increase in the other group.
Sample size considerations or post hoc discussions of achieved power are rarely mentioned. Still, in some instances, the sample size, and thus the subsequent power to detect an effect, is relatively small. For example, Zhang et al. (2020) had 49 participants divided into experimental and control groups. Similarly, Gong et al. (2018) examined the effectiveness of an intervention using 31 participants in total.
4.3.4 Data/tools-related limitations
The data used in the predictive models, or for data mining, is limited to the one available in the learning management system, and other "offline" variables are not considered (Nguyen et al., 2018). Further, multiple tests are conducted on the same data set without making significance level adjustments to deal with type 1 error inflation, which in some cases (e.g., Álvarez-Méndez et al., 2020) could result in non-significant findings. The overreliance on p-value, disregarding effect size, may be further misleading (Nuzzo, 2014). Pre-processing the data is time-consuming (Harindranathan & Folkestad, 2019). In some cases, the results do not provide insights beyond the specific context (Sarsfield & Conway, 2018; Nkomo & Nat, 2021; Ji & Han, 2019). The need for some tools is unclear, or users do not see their attractiveness (e.g., Cheong et al., 2018). The diagrams produced by some tools can be overwhelming (Dawson & Hubball, 2014) and complex (McCulloch et al., 2021), making them difficult to understand, and the interventions based on learning analytics may have limited or no impact (Dodge et al., 2015; Park & Jo, 2015). Some of these challenges are overcome in those cases where the dashboards offer an interpretation or call to action. Still, even in those cases, we do not understand the long-term impact of "negative" predictions on students' well-being.
4.3.5 Lack of theory
Further, as others have noted (Foster & Francis, 2020), the explanatory mechanisms or theory behind the interventions and the subsequent change are lacking. In cases where a theory drives the intervention, for example, increasing metacognitive skills, the results are not as expected. Thus, researchers must be vigilant for any dangers that educational technology may become an education hazard. Such risk is, for example, possible if researchers applying Big Data in higher education try to adapt the stakeholders to the available technology instead of adapting the available technology to the needs of the stakeholders. Are, for example, the multiple dashboards reviewed in this paper improving some outcome, or are students using them for no particular purpose? Can the negative predictions about performance become self-fulfilling prophecies (Archer & Prinsloo, 2020; Parkes et al., 2020)? Such questions have not been the focus of interest in the papers.
The papers implementing an intervention often lack scientific rigour, and the long-term outcomes of such interventions regarding motivation or well-being are unknown. Although the ultimate aim of Big Data and analytics is to inform decision-making (Lonn et al., 2012), a limited number of the articles reviewed achieved this aim.
5 Limitations and conclusions
Big Data and analytics are arguably two critical research paradigms that have emerged in an era where society rapidly generates data in large volumes. As an emerging paradigm, working with Big Data and analytics requires the knowledge of the 'fourth tradition' (Daniel, 2017). According to Daniel (2017), this fourth tradition is an empirical data-intensive scientific approach underpinned by the principles of knowledge discovery through data mining and visualisation. The fourth tradition necessitates the development of predictive and actionable analytics to solve complex societal problems. For over a decade, predictive and actionable analytics have been viewed as promising mechanisms for addressing challenges the higher education sector faces in the twenty-first century. The systematic review presented in the article closely examined published literature on the role of Big Data and associated analytics. As our goal was to gain a broad overview of the application of Big Data in higher education in the stated review period, we did not control the quality of the reviewed papers.
Furthermore, the search for articles was limited to only three databases. There is always the possibility that the inclusion or exclusion of keywords would have led to a different set of papers. Nonetheless, we believe the included keywords reflect the sufficient breadth of use of Big Data in higher education.
Despite these limitations, this systematic review offers a broad overview of the uses of Big Data in higher education. The review findings revealed that Big Data and analytics are predominantly used to support learning and, to a lesser extent, teaching and administration, and this is broadly consistent with other studies (Aytaç & Bilge, 2020; Baig et al., 2020). However, we observed some varied uses in supporting the latter. We also identified a set of studies focused on helping student well-being. Thus, we proposed refinement of the model postulated by Daniel (2015) to include supporting the teaching and learning process, administration, and the well-being of students and staff. Future studies could expand on the well-being aspect. Further, studies examining the effect of interventions based on big data should use more rigorous statistical tests to make a convincing argument for their effectiveness. In addition, studies utilising Big Data should be based on a theoretical perspective and be targeted towards solving an existing problem in practice.
Data availability
The data is available at https://osf.io/2eq7k/?view_only=1100a797b33b4d5f98072db99d3b9325.
References
The references used in the systematic review are marked with *
Abbas, F., Afzaal, H., Farooque, A. A., & Tang, S. (2020). Crop yield prediction through proximal sensing and machine learning algorithms. Agronomy, 10(7), 1046. https://doi.org/10.3390/agronomy10071046
*Afzaal, M., Nouri, J., Zia, A., Papapetrou, P., Fors, U., Wu, Y., Li, X., & Weegar, R. (2021). Explainable AI for data-driven feedback and intelligent action recommendations to support students self-regulation [Original Research]. Frontiers in Artificial Intelligence, 4. https://doi.org/10.3389/frai.2021.723447
*Alachiotis, N., Verykios, V., & Stavropoulos, E. (2019). Analysing learners behavior and resources effectiveness in a distance learning course: a case study of the Hellenic Open University. Journal of Information Science Theory and Practice 7, 2019, 06-20. https://doi.org/10.1633/JISTaP.2019.7.3.1
Alani, M. M. (2021). Big data in cybersecurity: A survey of applications and future trends. Journal of Reliable Intelligent Environments, 7(2), 85–114. https://doi.org/10.1007/s40860-020-00120-3
Alkhalil, A., Abdallah, M. A. E., Alogali, A., & Aljaloud, A. (2021). Applying Big Data analytics in higher education. International Journal of Information and Communication Technology Education, 17(3), 29–51. https://doi.org/10.4018/ijicte.20210701.oa3
*Alrehaili, N. A., Aslam, M. A., Alahmadi, D. H., Alrehaili, D. A., Asif, M., & Arshad Malik, M. S. (2021). Ontology-based smart system to automate higher education activities. Complexity, 2021, 1-20. https://doi.org/10.1155/2021/5588381
*Althbiti, A., Algarni, S., Alghamdi, T., & Ma, X. (2021). A Personalised Academic advisory recommender system (PAARS): a case study. Proceedings 4th International Conference on Information and Computer Technologies, 270–278. https://doi.org/10.1109/ICICT52872.2021.00051
*Álvarez-Méndez, A., Carrera, M., Barrios, J., Llatas, C., & Vázquez, P. (2020). Application of data mining in Moodle platform for the analysis of the academic performance of a compulsory subject in university students. Proceedings 14th International Technology, Education and Development Conference, 984–992. https://doi.org/10.21125/inted.2020.0355
*Anastasios, T., Sgouropoulou, C., Xydas, I., Terraz, O., & Miaoulis, G. (2011). Academic research policy-making and evaluation using graph visualisation. 15th Panhellenic Conference on Informatics, https://doi.org/10.1109/PCI.2011.38
*Apiola, M., Lokkila, E., & Laakso, M.-J. (2019). Digital learning approaches in an intermediate-level computer science course. The International Journal of Information and Learning Technology, 36(5), 467-484. https://doi.org/10.1108/ijilt-06-2018-0079
Arbia, G. (2021). Statistics New Empiricism and Society in the Era of Big Data. Springer. https://doi.org/10.1007/978-3-030-73030-7
Archer, E., & Prinsloo, P. (2020). Speaking the unspoken in learning analytics: Troubling the defaults. Assessment & Evaluation in Higher Education, 45(6), 888–900. https://doi.org/10.1080/02602938.2019.1694863
*Armatas, C., Kwong, T., Chun, C., Spratt, C., Chan, D., & Kwan, J. (2022). Learning analytics for programme review: evidence, analysis, and action to improve student learning outcomes. Technology, Knowledge and Learning, 27(2), 461-478. https://doi.org/10.1007/s10758-021-09559-6
Attaran, M., Stark, J., & Stotler, D. (2018). Opportunities and challenges for big data analytics in US higher education: A conceptual model for implementation. Industry and Higher Education, 32(3), 169–182. https://doi.org/10.1177/0950422218770937
Aviles, J., & Esquivel, R. (2019). Mining social media data of philippine higher education institutions using naive bayes classifier algorithm. SSRN Electronic Journal. https://doi.org/10.2139/ssrn.3379025
Aytaç, Z., & Bilge, H. Ş. (2020). Big data analytics in higher education: A systematic review. Journal of Internet Applications and Management, 11(2), 81–99.
*Ayub, M., Toba, H., Wijanto, M., & Yong, S. (2017). Modelling students’ activities in programming subjects through educational data mining. Global Journal of Engineering Education, 19, 249-255
*Azcona, D., Corrigan, O., Scanlon, P., & Smeaton, A. F. (2017). Innovative Learning Analytics Research at a Data-Driven HEI. Proceedings of the 3rd International Conference on Higher Education Advances, 435–443. https://doi.org/10.4995/HEAd17.2017.5245
Baig, M. I., Shuib, L., & Yadegaridehkordi, E. (2020). Big data in education: A state of the art, limitations, and future research directions. International Journal of Educational Technology in Higher Education, 17(1), 44. https://doi.org/10.1186/s41239-020-00223-0
*Baralis, E., Cagliero, L., Farinetti, L., Mezzalama, M., & Venuto, E. (2017). Experimental validation of a massive educational service in a blended learning environment. IEEE 41st Annual Computer Software and Applications Conference (COMPSAC), 1, 381 - 390. https://doi.org/10.1109/COMPSAC.2017.123
Barb, A. S., & Kilicay-Ergin, N. (2020). Applications of natural language techniques to enhance curricular coherence. Procedia Computer Science, 168, 88–96. https://doi.org/10.1016/j.procs.2020.02.263
Beasley, Z. J., Friedman, A., & Rosen, P. (2021). Through the looking glass: insights into visualization pedagogy through sentiment analysis of peer review text. IEEE Computer Graphics and Applications, 41(6), 59–70. https://doi.org/10.1109/mcg.2021.3115387
*Braccini, A. M., Limongelli, C., Sciarrone, F., & Temperini, M. (2021). Business intelligence for teaching analytics: a case study. Springer Proceedings in Complexity, 341–351. https://doi.org/10.1007/978-3-030-62066-0_26
*Broos, T., Verbert, K., Langie, G., Soom, C., & De Laet, T. (2018). Multi-institutional positioning test feedback dashboard for aspiring students: lessons learnt from a case study in Flanders. 8th International Conference on Learning Analytics and Knowledge.8th International Conference on Learning Analytics and Knowledge, LAK 2018, 51–55. https://doi.org/10.1145/3170358.3170419
*Burkhardt, J. C., DesJardins, S. L., Teener, C. A., Gay, S. E., & Santen, S. A. (2016). Enrollment Management in Medical School Admissions: A Novel Evidence-Based Approach at One Institution. Academic Medicine, 91(11), 1561-1567. https://doi.org/10.1097/acm.0000000000001188
*Castells, J., Doust, M. P., Galárraga, L., Méndez, G. G., Ortiz-Rojas, M., & Jiménez, A. (2020). A student-oriented tool to support course selection in academic counselling sessions. In M.-M. P.J., K. C.D., T. Y.-S., G. D., V. K., P.-S. M., P.-S. M., H. I., Z.-P. MA, O.-R. M., & S. E. (Eds.), 2020 Workshop on Adoption, Adaptation and Pilots of Learning Analytics in Under-Represented Regions, LAUR 2020, 2704, 48–57. CEUR-WS
Chaurasia, S. S., & Frieda Rosin, A. (2017). From Big Data to Big Impact: Analytics for teaching and learning in higher education. Industrial and Commercial Training, 49(7/8), 321–328. https://doi.org/10.1108/ict-10-2016-0069
*Cheong, M. L. F., Chen, J. Y. C., & Dai, B. T. (2018). Integrated Telegram and Web-based Forum with Automatic Assessment of Questions and Answers for Collaborative Learning. IEEE International Conference on Teaching, Assessment, and Learning for Engineering, TALE 2018, 9-16.
*Chi, H., Jones, E. L., & Grandham, L. P. (2012). Enhancing Mentoring Between Alumni and Students via Smart Alumni System. 12th Annual International Conference on Computational Science, ICCS 2012, 9, 1390–1399. https://doi.org/10.1016/j.procs.2012.04.153
*Cobos, R., & Ruiz‐Garcia, J. C. (2021). Improving learner engagement in MOOCs using a learning intervention system: A research study in engineering education. Computer Applications in Engineering Education, 29(4), 733-749. https://doi.org/10.1002/cae.22316
*Cooper, M., Ferguson, R., & Wolff, A. (2016). What can analytics contribute to accessibility in e-learning systems and to disabled students' learning? Proceedings of the Sixth International Conference on Learning Analytics & Knowledge, 99–103. https://doi.org/10.1145/2883851.2883946
Daniel, B. (2015). Big Data and analytics in higher education: opportunities and challenges. British Journal of Educational Technology, 46(5), 904–920. https://doi.org/10.1111/bjet.12230
Daniel, B. K. (2017). Big Data in Higher Education: The Big Picture. In Big Data and Learning Analytics in Higher Education: Current Theory and Practice. (pp. 19–28). Springer International Publishing. https://doi.org/10.1007/978-3-319-06520-5_3
Daniel, B. K. (2019). Big Data and data science: A critical review of issues for educational research. British Journal of Educational Technology, 50(1), 101–113. https://doi.org/10.1111/bjet.12595
Daniel, B. K., & Harland, T. (2017). Higher education research methodology: a step-by-step guide to the research process. Routledge. https://doi.org/10.4324/9781315149783
*Dawson, S., & Hubball, H. (2014). Curriculum analytics: application of social network analysis for improving strategic curriculum decision-making in a research-intensive university. Teaching & Learning Inquiry: The ISSOTL Journal, 2(2), 59-74. https://doi.org/10.2979/teachlearninqu.2.2.59
De Oliveira, C. F., Sobral, S. R., Ferreira, M. J., & Moreira, F. (2021). How does learning analytics contribute to prevent students’ dropout in higher education: a systematic literature review. Big Data and Cognitive Computing, 5(4), 64. https://doi.org/10.3390/bdcc5040064
Dodge, B., Whitmer, J., & Frazee, J. P. (2015). Improving undergraduate student achievement in large blended courses through data-driven interventions. Proceedings of the fifth international conference on learning analytics and knowledge. Poughkeepsie, New York. https://doi.org/10.1145/2723576.2723657
Drivas, I. C., Sakas, D. P., Giannakopoulos, G. A., & Kyriaki-Manessi, D. (2020). Big data analytics for search engine optimization. Big Data and Cognitive Computing, 4(2), 5. https://doi.org/10.3390/bdcc4020005
*Du, Y., Gebremedhin, A. H., & Taylor, M. E. (2019). Analysis of University Fitness Center Data Uncovers Interesting Patterns, Enables Prediction. IEEE Transactions on Knowledge and Data Engineering, 31(8), 1478-1490. https://doi.org/10.1109/tkde.2018.2863705
*Elisabeth, D., Rokhman, M. F., Harahap, N. C., Hakim, S. A., & Sensuse, D. I. (2019). Discovering scientific collaboration activities using social network analysis. a case study: faculty of computer science universitas Indonesia. 11th International Conference on Information Technology and Electrical Engineering, ICITEE 2019. https://doi.org/10.1109/ICITEED.2019.8929957
Erevelles, S., Fukawa, N., & Swayne, L. (2016). Big Data consumer analytics and the transformation of marketing. Journal of Business Research, 69(2), 897–904. https://doi.org/10.1016/j.jbusres.2015.07.001
*Essa, A., & Ayad, H. (2012). Improving student success using predictive models and data visualisations. Research in Learning Technology, 20, 58-70. https://doi.org/10.3402/rlt.v20i0.19191
Ferguson, R., & Clow, D. (2017). Where is the evidence? A call to action for learning analytics. Proceedings of the Seventh International Learning Analytics & Knowledge Conference, 56–65. https://doi.org/10.1145/3027385.3027396
*Figueroa-Cañas, J., & Sancho-Vinuesa, T. (2021). Changing the recent past to reduce ongoing dropout: an early learning analytics intervention for an online statistics course. Open Learning: The Journal of Open, Distance and e-Learning, 1–18. https://doi.org/10.1080/02680513.2021.1971963
Foster, C., & Francis, P. (2020). A systematic review on the deployment and effectiveness of data analytics in higher education to improve student outcomes. Assessment & Evaluation in Higher Education, 45(6), 822–841. https://doi.org/10.1080/02602938.2019.1696945
Gašević, D., Dawson, S., & Siemens, G. (2015). Let’s not forget: Learning analytics are about learning. TechTrends, 59(1), 64–71. https://doi.org/10.1007/s11528-014-0822-x
*Géryk, J., & Popelínský, L. (2014). Visual Analytics for increasing efficiency of higher education institutions. In W. Abramowicz & A. Kokkinaki (Eds.), Business Information Systems Workshops. BIS 2014. Lecture Notes in Business Information Processing (Vol. 183, pp. 117–127). Springer International Publishing. https://doi.org/10.1007/978-3-319-11460-6_11
*Gong, L., Liu, Y., & Zhao, W. (2018). Using learning analytics to promote student engagement and achievement in blended learning. ICEBT '18: Proceedings of the 2018 2nd International Conference on E-Education, E-Business and E-Technology,19–24. https://doi.org/10.1145/3241748.3241760
Gottipati, S., Shankararaman, V., & Gan, S. (2017). A conceptual framework for analysing students' feedback. 47th IEEE Frontiers in Education Conference, FIE 2017, 1-8. https://doi.org/10.1109/FIE.2017.8190703
Grover, V., Chiang, R. H. L., Liang, T.-P., & Zhang, D. (2018). Creating strategic business value from big data analytics: a research framework. Journal of Management Information Systems, 35(2), 388–423. https://doi.org/10.1080/07421222.2018.1451951
Gutierrez, C. N., Kim, T., Corte, R. D., Avery, J., Goldwasser, D., Cinque, M., & Bagchi, S. (2018). Learning from the ones that got away: detecting new forms of phishing attacks. IEEE Transactions on Dependable and Secure Computing, 15(6), 988–1001. https://doi.org/10.1109/tdsc.2018.2864993
*Gutiérrez, F., Seipp, K., Ochoa, X., Chiluiza, K., De Laet, T., & Verbert, K. (2020). LADA: A learning analytics dashboard for academic advising. Computers in Human Behavior, 107, 105826. https://doi.org/10.1016/j.chb.2018.12.004
*Harindranathan, P., & Folkestad, J. (2019). Learning analytics to inform the learning design: supporting instructor’s inquiry into student learning in unsupervised technology-enhanced platforms. Online Learning, 23(3), 34–55. https://doi.org/10.24059/olj.v23i3.2057
*He, L., Levine, R. A., Bohonak, A. J., Fan, J., & Stronach, J. (2018). Predictive analytics machinery for STEM student success studies. Applied Artificial Intelligence, 32(4), 361-387. https://doi.org/10.1080/08839514.2018.1483121
*Hernández-García, Á., González-González, I., Jimenez-Zarco, A., & Chaparro-Peláez, J. (2016). Visualisations of online course interactions for social network learning analytics. International Journal of Emerging Technologies in Learning (iJET), 11(7), 6-15. https://doi.org/10.3991/ijet.v11i07.5889
*Herodotou, C., Naydenova, G., Boroowa, A., Gilmour, A., & Rienties, B. (2020). How can predictive learning analytics and motivational interventions increase student retention and enhance administrative support in distance education? Journal of Learning Analytics, 7(2), 72–83. https://doi.org/10.18608/jla.2020.72.4
*Hilliger, I., Aguirre, C., Miranda, C., Celis, S., & Pérez-Sanagustín, M. (2020). Design of a curriculum analytics tool to support continuous improvement processes in higher education. Proceedings of the Tenth International Conference on Learning Analytics & Knowledge, 181–186. https://doi.org/10.1145/3375462
Huang, D. Y., Aliapoulios, M. M., Li, V. G., Invernizzi, L., Bursztein, E., McRoberts, K., Levin, J., Levchenko, K., Snoeren, A. C., & McCoy, D. (2018). Tracking ransomware end-to-end. Proceedings - IEEE Symposium on Security and Privacy, 618–631. https://doi.org/10.1109/SP.2018.00047
Ifenthaler, D., & Tracey, M. W. (2016). Exploring the relationship of ethics and privacy in learning analytics and design: Implications for the field of educational technology. Educational Technology Research and Development, 64(5), 877–880. https://doi.org/10.1007/s11423-016-9480-3
Ifenthaler, D., & Yau, J.Y.-K. (2020). Utilising learning analytics to support study success in higher education: A systematic review. Educational Technology Research and Development, 68(4), 1961–1990. https://doi.org/10.1007/s11423-020-09788-z
*Jääskelä, P., Heilala, V., Kärkkäinen, T., & Häkkinen, P. (2021). Student agency analytics: learning analytics as a tool for analysing student agency in higher education. Behaviour & Information Technology, 40(8), 790-808. https://doi.org/10.1080/0144929x.2020.1725130
*Ji, Y., & Han, Y. (2019). Monitoring Indicators of the Flipped Classroom Learning Process based on Data Mining – Taking the Course of “Virtual Reality Technology” as an example. International Journal of Emerging Technologies in Learning (iJET), 14(3), 166-176. https://doi.org/10.3991/ijet.v14i03.10105
Jin, X., Wah, B. W., Cheng, X., & Wang, Y. (2015). Significance and challenges of big data research. Big Data Research, 2(2), 59–64. https://doi.org/10.1016/j.bdr.2015.01.006
Jo, T. (2019). Text Mining: Concepts, Implementation, and Big Data Challenge. Springer.
Jones, K. M. L., Asher, A., Goben, A., Perry, M. R., Salo, D., Briney, K. A., & Robertshaw, M. B. (2020). “We’re being tracked at all times”: Student perspectives of their privacy in relation to learning analytics in higher education. Journal of the Association for Information Science and Technology, 71(9), 1044–1059. https://doi.org/10.1002/asi.24358
*Joseph-Richard, P., Uhomoibhi, J., & Jaffrey, A. (2021). Predictive learning analytics and the creation of emotionally adaptive learning environments in higher education institutions: a study of students' affect responses. The International Journal of Information and Learning Technology, 38(2), 243-257. https://doi.org/10.1108/ijilt-05-2020-0077
*Joy, J., & Nambirajan, T. (2021). Learning analytics for academic management system enhancement: A participatory action research in an Indian context. Management in Education. https://doi.org/10.1177/08920206211037689
*Karaoglan Yilmaz, F. G. (2022). Utilising learning analytics to support students' academic self-efficacy and problem-solving skills. The Asia-Pacific Education Researcher, 31(2), 175-191. https://doi.org/10.1007/s40299-020-00548-4
*Karaoglan Yilmaz, F. G., & Yilmaz, R. (2022). Learning Analytics Intervention Improves Students’ Engagement in Online Learning. Technology, Knowledge and Learning, 27(2), 449-460. https://doi.org/10.1007/s10758-021-09547-w
*Khudzaeva, E., Mintarsih, F., Muharam, A. T., & Wirawan, C. (2018). Application of clustering method in data mining for determining SNMPTN quota invitation UIN Syarif Hidayatullah Jakarta. 6th International Conference on Cyber and IT Service Management, CITSM 2018, 1–4. https://doi.org/10.1109/CITSM.2018.8674329
Klein, C., Lester, J., Rangwala, H., & Johri, A. (2019). Technological barriers and incentives to learning analytics adoption in higher education: Insights from users. Journal of Computing in Higher Education, 31(3), 604–625. https://doi.org/10.1007/s12528-019-09210-5
*Kuromiya, H., Majumdar, R., & Ogata, H. (2020). Fostering evidence-based education with learning analytics: capturing teaching-learning cases from log data. Educational Technology & Society, 23, 1176-3647
Kushwaha, A. K., Kar, A. K., & Dwivedi, Y. K. (2021). Applications of big data in emerging management disciplines: A literature review using text mining. International Journal of Information Management Data Insights, 1(2), 100017. https://doi.org/10.1016/j.jjimei.2021.100017
*Laakso, M.-J., Kaila, E., & Rajala, T. (2018). ViLLE – collaborative education tool: Designing and utilising an exercise-based learning environment. Education and Information Technologies, 23(4), 1655–1676. https://doi.org/10.1007/s10639-017-9659-1
*Lawrence, J., Brown, A., Redmond, P., & Basson, M. (2019). Engaging the disengaged: Exploring the use of course-specific learning analytics and nudging to enhance online student engagement. Student Success, 10, 47-58. https://doi.org/10.5204/ssj.v10i2.1295
Lawson, C., Beer, C., Rossi, D., Moore, T., & Fleming, J. (2016). Identification of ‘at risk’ students using learning analytics: The ethical dilemmas of intervention strategies in a higher education institution. Educational Technology Research and Development, 64(5), 957–968. https://doi.org/10.1007/s11423-016-9459-0
Li, K., Rollins, J., & Yan, E. (2018). Web of Science use in published research and review papers 1997–2017: A selective, dynamic, cross-domain, content-based analysis. Scientometrics, 115(1), 1–20. https://doi.org/10.1007/s11192-017-2622-5
*Linden, K., & Webster, L. (2019). Back to Basics: combining analytics and early assessment with personalised contact to improve student progress. 36th International Conference of Innovation, Practice and Research in the Use of Educational Technologies in Tertiary Education: Personalised Learning. Diverse Goals. One Heart, ASCILITE 2019, 499–502. https://doi.org/10.14742/apubs.2019.319
*Llopis-Albert, C., & Rubio, F. (2021). Application of Learning Analytics to Improve Higher Education. Multidisciplinary Journal for Education, Social and Technological Sciences, 8(2), 1-18. https://doi.org/10.4995/muse.2021.16287
*Lonn, S., Aguilar, S. J., & Teasley, S. D. (2015). Investigating student motivation in the context of a learning analytics intervention during a summer bridge program. Computers in Human Behavior, 47, 90-97. https://doi.org/10.1016/j.chb.2014.07.013
Lonn, S., Krumm, A. E., Waddington, R. J., & Teasley, S. D. (2012). Bridging the gap from knowledge to action: putting analytics in the hands of academic advisors. Proceedings of the 2nd International Conference on Learning Analytics and Knowledge, 184–187. https://doi.org/10.1145/2330601
*Lu, O. H. T., Huang, J. C. H., Huang, A. Y. Q., & Yang, S. J. H. (2017). Applying learning analytics for improving students engagement and learning outcomes in an MOOCs enabled collaborative programming course. Interactive Learning Environments, 25(2), 220-234. https://doi.org/10.1080/10494820.2016.1278391
Lycett, M. (2013). ‘Datafication’: Making sense of (big) data in a complex world. European Journal of Information Systems, 22(4), 381–386. https://doi.org/10.1057/ejis.2013.10
*McCulloch, S., Gildner, J., Hoefel, B., Cervantes, G., Ahmed, S., & Sharmin, M. (2021). Visualisation as a Tool to Understand the Experience of College Students with Autism. Proceedings - 2021 IEEE 45th Annual Computers, Software, and Applications Conference, COMPSAC 2021, 438–445. https://doi.org/10.1109/COMPSAC51774.2021.00067
*McNely, B., Gestwicki, P., Hill, J., Parli-Horne, P., & Johnson, E. (2012). Learning analytics for collaborative writing: A prototype and case study 2nd International Conference on Learning Analytics and Knowledge, LAK 2012, 222–225. https://doi.org/10.1145/2330601.2330654
Monino, J.-L., & Sedkaoui, S. (2016). The Big Data Revolution. In Big Data, Open Data and Data Development (eds J.-L. Monino and S. Sedkaoui). https://doi.org/10.1002/9781119285199.ch1
Naeem, M., Jamal, T., Diaz-Martinez, J., Aziz Butt, S., Montesano, N., Imran Tariq, M., De-la-Hoz-Franco, E., De-La-Hoz-Valdiris, E., Naeem, M., Jamal, T., De-la-Hoz-Franco, E., De-La-Hoz-Valdiris, E., Butt, S. A., & Tariq, M. I. (2022). Trends and future perspective challenges in big data. Smart Innovation, Systems and Technologies, 253, 309–325. https://doi.org/10.1007/978-981-16-5036-9_30
*Nagi, K. (2019). Using Learning Analytic Tools to Enhance Quality of Hands-on-Activities in Online Technology Courses. Universal Journal of Educational Research, 7(4), 1084–1089. https://doi.org/10.13189/ujer.2019.070420
*Nguyen, Q., Huptych, M., & Rienties, B. (2018). Linking students' timing of engagement to learning design and academic performance. 8th International Conference on Learning Analytics and Knowledge, LAK 2018, 141–150. https://doi.org/10.1145/3170358.3170398
*Nkhoma, C., Dang-Pham, D., Hoang, A.-P., Nkhoma, M., Le-Hoai, T., & Thomas, S. (2020). Learning analytics techniques and visualisation with textual data for determining causes of academic failure. Behaviour & Information Technology, 39(7), 808-823. https://doi.org/10.1080/0144929x.2019.1617349
*Nkomo, L. M., & Nat, M. (2021). Student Engagement Patterns in a Blended Learning Environment: an Educational Data Mining Approach. TechTrends, 65(5), 808-817. https://doi.org/10.1007/s11528-021-00638-0
Nuzzo, R. (2014). Scientific method: statistical errors. Nature, 506(7487), 150–152. https://doi.org/10.1038/506150a
*Ocaña, M., Khosravi, H., & Bakharia, A. (2019). Profiling language learners in the big data era. 36th International Conference of Innovation, Practice and Research in the Use of Educational Technologies in Tertiary Education: Personalised Learning. Diverse Goals. One Heart, ASCILITE 2019, 237-245.
*Olaya, D., Vásquez, J., Maldonado, S., Miranda, J., & Verbeke, W. (2020). Uplift modeling for preventing student dropout in higher education. Decision Support Systems, 134, 113320. https://doi.org/10.1016/j.dss.2020.113320
*Park, Y., & Jo, I.-H. (2015). Development of the Learning Analytics Dashboard to Support Students' Learning Performance. Journal of Universal Computer Science, 21, 110-133.
Parkes, S., Benkwitz, A., Bardy, H., Myler, K., & Peters, J. (2020). Being more human: Rooting learning analytics through distance and reconnection with the values of higher education. Higher Education Research & Development, 39(1), 113–126. https://doi.org/10.1080/07294360.2019.1677569
Perez, O. A., & Gonzalez, V. E. (2016). Student dashboard for a multi-agent approach for academic advising. Computers in Education Journal, 16 (3), 73-90
*Prieto, M. Á. Z., Ortiz-Rojas, M., Ulloa, M., & Jiménez, A. (2020). Applying the LALA Framework for the adoption of a Learning Analytics tool in Latin America: Two case studies in Ecuador. In M.-M. P.J., K. C.D., T. Y.-S., G. D., V. K., P.-S. M., P.-S. M., H. I., Z.-P. MA, O.-R. M., & S. E. (Eds.), 2020 Workshop on Adoption, Adaptation and Pilots of Learning Analytics in Under-Represented Regions, LAUR 2020, 2704, 6–14). CEUR-WS
*Rad, A., Naderi, B., & Soltani, M. (2011). Clustering and ranking university majors using data mining and AHP algorithms: A case study in Iran. Expert Systems with Applications, 38(1), 755-763. https://doi.org/10.1016/j.eswa.2010.07.029
*Ramaswami, G. S., Susnjak, T., & Mathrani, A. (2019). Capitalising on learning analytics dashboard for maximising student outcomes. IEEE Asia-Pacific Conference on Computer Science and Data Engineering, CSDE, 2019, 1-6. https://doi.org/10.1109/CSDE48274.2019.9162357
Ray, S., & Saeed, M. (2018). Applications of Educational data mining and learning analytics tools in handling big data in higher education. Applications of Big Data Analytics: Trends, Issues, and Challenges, 135–160. https://doi.org/10.1007/978-3-319-76472-6_7
Rehman, A., Naz, S., & Razzak, I. (2022). Leveraging big data analytics in healthcare enhancement: Trends, challenges and opportunities. Multimedia Systems, 28(4), 1339–1371. https://doi.org/10.1007/s00530-020-00736-8
Ristevski, B., & Chen, M. (2018). Big Data Analytics in Medicine and Healthcare. Journal of Integrative Bioinformatics, 15(3). https://doi.org/10.1515/jib-2017-0030
Roberts, L. D., Howell, J. A., & Seaman, K. (2017). Give me a customizable dashboard: personalized learning analytics dashboards in higher education. Technology, Knowledge and Learning, 22(3), 317–333. https://doi.org/10.1007/s10758-017-9316-1
*Romero, C., Zafra, A., Luna, J. M., & Ventura, S. (2013). Association rule mining using genetic programming to provide feedback to instructors from multiple choice quiz data. Expert Systems, 30(2), 162-172. https://doi.org/10.1111/j.1468-0394.2012.00627.x
*Salazar-Fernandez, J. P., Sepulveda, M., & Munoz-Gama, J. (2019). Influence of student diversity on educational trajectories in engineering high-failure rate courses that lead to late dropout. 10th IEEE Global Engineering Education Conference, EDUCON 2019, 607–616). IEEE Computer Society. https://doi.org/10.1109/EDUCON.2019.8725143
*Sarsfield, M., & Conway, J. (2018). What can we learn from learning analytics? A case study based on an analysis of student use of video recordings. Research in Learning Technology, 26. https://doi.org/10.25304/rlt.v26.2087
Schotten, M., El Aisati, M. H., Meester, W. J. N., Steiginga, S., & Ross, C. A. (2017). A Brief History of Scopus: The World’s Largest Abstract and Citation Database of Scientific Literature. Research Analytics, 31–58. https://doi.org/10.1201/9781315155890-3
Singh, R. K., Agrawal, S., Sahu, A., & Kazancoglu, Y. (2021). Strategic issues of big data analytics applications for managing healthcare sector: a systematic literature review and future research agenda. The TQM Journal, ahead-of-print(ahead-of-print). https://doi.org/10.1108/tqm-02-2021-0051
*Sivakumar, M., & Reddy, U. S. (2017). Aspect-based sentiment analysis of students opinion using machine learning techniques. 2017 International Conference on Inventive Computing and Informatics, ICICI 2017, 726–731. https://doi.org/10.1109/ICICI.2017.8365231
*Srinivas, S., & Rajendran, S. (2019). Topic-based knowledge mining of online student reviews for strategic planning in universities. Computers & Industrial Engineering, 128, 974-984. https://doi.org/10.1016/j.cie.2018.06.034
*Summers, R. J., Higson, H. E., & Moores, E. (2021). Measures of engagement in the first three weeks of higher education predict subsequent activity and attainment in first-year undergraduate students: a UK case study. Assessment & Evaluation in Higher Education, 46(5), 821-836. https://doi.org/10.1080/02602938.2020.1822282
*Taniguchi, Y., Suehiro, D., Shimada, A., & Ogata, H. (2017). Revealing hidden impression topics in students' journals based on nonnegative matrix factorisation. In H. R., V. R., Kinshuk, S. DG, C. N.-S., & C. M. (Eds.), 17th IEEE International Conference on Advanced Learning Technologies, ICALT 2017 (pp. 298–300). Institute of Electrical and Electronics Engineers Inc. https://doi.org/10.1109/ICALT.2017.113
Tasmin, R., Muhammad, R. N., & Nor Aziati, A. H. (2020). Big data analytics applicability in higher learning educational system. IOP Conference Series: Materials Science and Engineering, 917(1), 012064. https://doi.org/10.1088/1757-899X/917/1/012064
Viberg, O., Hatakka, M., Bälter, O., & Mavroudi, A. (2018). The current landscape of learning analytics in higher education. Computers in Human Behavior, 89, 98–110. https://doi.org/10.1016/j.chb.2018.07.027
*Villamañe, M., Larrañaga, M., Álvarez, A., & Ferrero, B. (2016). RubricVis: enriching rubric-based formative assessment with visual learning analytics. TEEM '16: Proceedings of the Fourth International Conference on Technological Ecosystems for Enhancing Multiculturality, 363–368. https://doi.org/10.1145/3012430.3012541
Waheed, H., Hassan, S.-U., Aljohani, N. R., Hardman, J., Alelyani, S., & Nawaz, R. (2020). Predicting academic performance of students from VLE big data using deep learning models. Computers in Human Behavior, 104, 106189. https://doi.org/10.1016/j.chb.2019.106189
*Wang, K. D., Salehi, S., Arseneault, M., Nair, K., & Wieman, C. (2021). Automating the Assessment of Problem-solving Practices Using Log Data and Data Mining Techniques L@S 2021 - Proceedings of the 8th ACM Conference on Learning @ Scale, 69–76. https://doi.org/10.1145/3430895.3460127
*Xia, T., & Liu, Y. (2018). Application of improved association-rules mining algorithm in the circulation of university library. 2018 International conference on big data and artificial intelligence (pp. 60–64). https://doi.org/10.25236/icbdai.2018.010
Zhang, J.-H., Zou, L.-C., Miao, J.-J., Zhang, Y.-X., Hwang, G.-J., & Zhu, Y. (2020). An individualised intervention approach to improving university students’ learning performance and interactive behaviours in a blended learning environment. Interactive Learning Environments, 28(2), 231-245. https://doi.org/10.1080/10494820.2019.1636078
Funding
Open Access funding enabled and organized by CAUL and its Member Institutions
Author information
Authors and Affiliations
Corresponding author
Ethics declarations
Competing interests
We have no competing interests to declare. We received no financial support for this review.
Additional information
Publisher's note
Springer Nature remains neutral with regard to jurisdictional claims in published maps and institutional affiliations.
Supplementary Information
Below is the link to the electronic supplementary material.
Rights and permissions
Open Access This article is licensed under a Creative Commons Attribution 4.0 International License, which permits use, sharing, adaptation, distribution and reproduction in any medium or format, as long as you give appropriate credit to the original author(s) and the source, provide a link to the Creative Commons licence, and indicate if changes were made. The images or other third party material in this article are included in the article's Creative Commons licence, unless indicated otherwise in a credit line to the material. If material is not included in the article's Creative Commons licence and your intended use is not permitted by statutory regulation or exceeds the permitted use, you will need to obtain permission directly from the copyright holder. To view a copy of this licence, visit http://creativecommons.org/licenses/by/4.0/.
About this article

Cite this article
Stojanov, A., Daniel, B.K. A decade of research into the application of big data and analytics in higher education: A systematic review of the literature. Educ Inf Technol 29, 5807–5831 (2024). https://doi.org/10.1007/s10639-023-12033-8
Received:
Accepted:
Published:
Issue Date:
DOI: https://doi.org/10.1007/s10639-023-12033-8