
Abstract
Purpose
Dyslipidemia is a major health concern associated with an increased risk of cardiovascular mortality. Long-term fasting (LF) has been shown to improve plasma lipid profile. We performed an in-depth investigation of lipoprotein composition.
Methods
This observational study included 40 volunteers (50% men, aged 32–65 years), who underwent a medically supervised fast of 14 days (250 kcal/day). Changes in lipid and lipoprotein levels, as well as in lipoprotein subclasses and particles, were measured by ultracentrifugation and nuclear magnetic resonance (NMR) at baseline, and after 7 and 14 fasting days.
Results
The largest changes were found after 14 fasting days. There were significant reductions in triglycerides (TG, − 0.35 ± 0.1 mmol/L), very low-density lipoprotein (VLDL)-TG (− 0.46 ± 0.08 mmol/L), VLDL-cholesterol (VLDL-C, − 0.16 ± 0.03 mmol/L) and low-density lipoprotein (LDL)-C (− 0.72 ± 0.14 mmol/L). Analysis of LDL subclasses showed a significant decrease in LDL1-C (− 0.16 ± 0.05 mmol/L), LDL2-C (− 0.30 ± 0.06 mmol/L) and LDL3-C (− 0.27 ± 0.05 mmol/L). NMR spectroscopy showed a significant reduction in large VLDL particles (− 5.18 ± 1.26 nmol/L), as well as large (− 244.13 ± 39.45 nmol/L) and small LDL particles (− 38.45 ± 44.04 nmol/L). A significant decrease in high-density lipoprotein (HDL)-C (− 0.16 ± 0.04 mmol/L) was observed. By contrast, the concentration in large HDL particles was significantly raised. Apolipoprotein A1 decreased significantly whereas apolipoprotein B, lipoprotein(a), fibrinogen and high-sensitivity C-reactive protein were unchanged.
Conclusion
Our results suggest that LF improves lipoprotein levels and lipoprotein subclasses and ameliorates the lipoprotein-associated atherogenic risk profile, suggesting a reduction in the cardiovascular risk linked to dyslipidemia.
Trial Registration
Study registration number: DRKS-ID: DRKS00010111 Date of registration: 03/06/2016 “retrospectively registered”.
Introduction
The voluntary abstinence or strong limitation of caloric intake for a limited period of time, also known as fasting, has gained popularity in the last decade to prevent and treat age-related diseases. Long-term fasting (LF) of 2 to 21 days or more [1], intermittent fasting (IF) [2], and nutritional strategies like calorie restriction, have been shown to reduce risk factors for cardiovascular disease (CVD), such as dyslipidemia, body mass index (BMI), abdominal circumference, hypertension, and insulin resistance [3,4,5,6]. LF with a supplementation of 250 kcal per day is well tolerated physically and emotionally [1]. During LF, a metabolic switch from the use of food-derived glucose to lipids and ketones (G-to-K) occurs 10–16 h after the last meal [7]. This leads to global biochemical changes in lipid metabolism with known health benefits [7]. Earlier studies indicated a reduction in total cholesterol (TC), triglycerides (TG), low-density lipoprotein cholesterol (LDL-C), and to a lesser extent, a rise of high-density lipoprotein cholesterol (HDL-C) [8]. However, lipoprotein composition was never investigated in detail. Studies on alternate-day fasting in obese and non-obese subjects reported modest TC, LDL-C, and TG reductions, with a modest shift towards larger LDL particles and a reduction in small-sized LDL [9]. In metabolic syndrome patients, IF with a 10-h time-restricted eating led to decrease the atherogenic profile [10]. Other dietary approaches like the Dietary Approach to Stop Hypertension (DASH) and Mediterranean diets have shown comparable results [11, 12]
A rapid decrease of TG is a main feature of fasting in humans after cessation of food intake [8]. Since the fasting protocol used in the present study provides a supplementation of 250 kcal containing zero fat, we hypothesised that chylomicrons disappear and that a massive remodelling in lipoproteins is triggered [8]. In this scenario, both epidemiological and genetic studies have reported the possible role of TG as a causal risk factor in atherosclerotic cardiovascular disease (ASCVD) [13]. Very low-density lipoprotein (VLDL) particles are heterogeneous in composition and size, the larger being VLDL1 particles (enriched in TG) and the smaller VLDL2 particles (containing less TG) [14]. Lipoprotein lipase acts on VLDL to hydrolyse core TG and convert particles to LDL (via IDL) as the terminal product of lipolysis [15]. Cleavage of TG by lipoprotein lipase (LPL) liberates free fatty acids, partly converted in the liver to the ketones β-hydroxybutyrate and acetoacetate [16]. Ketone bodies are an important source of energy for most body cells during fasting [1, 8, 17], leading to a fully compensated acidosis, and exerting an anorectic activity [18].
Low carbohydrate/high-fat restrictive nutritional strategies improve atherogenic dyslipidemia in metabolic syndrome patients regardless of weight loss [19] suggesting that, in analogy, fasting metabolism, relying essentially on endogenous lipids, could have a comparable effect. LDL is considered to be the major and causal driving force in the development of ASCVD [20]. LDL particles may be produced via two pathways, either by extensive intravascular remodelling of hepatic VLDL or to a lesser extent by de novo liver secretion. The former pathway typically predominates [21]. LDL are a continuum of particles distributed over densities ranging from 1.019 to 1.063 g/ml, further sub-classified into large buoyant LDL1, intermediate LDL2 and small dense LDL3 (sdLDL) [22]. The sdLDL particles are characterized by a low lipid/protein ratio and small particle size, both favouring an enhanced transcytosis across the arterial endothelium triggering atheroma formation [23, 24]. HDL changes are of special interest, since HDL are recognized as a protective factor against arterial disease. Small variations in their levels may lead to a change in risk [25].
The aim of the present study was to document how LF, carried out according to the program of the Buchinger Wilhelmi clinics (BWC), changes lipoprotein subclass distribution in humans. For this purpose, two methods were applied to analyze lipoprotein subclasses: the separation of lipoprotein subclasses by density gradient ultracentrifugation, and the measurement of lipoprotein particle concentration and particle size by NMR spectroscopy. The protocol includes a 14 day fasting period together with a multidisciplinary program including daily physical activity and relaxation under medical supervision. A supplementation of 200–250 kcal in the form of juices and vegetable soups is given daily [8]. The safety of this peer-reviewed fasting protocol has been documented in numerous studies [8, 26,27,28].
Patients and methods
Ethics
This prospective, observational study was approved by the medical council of Baden-Württemberg and the Ethics Committee of the Charité-University Medical Center, Berlin (application number: EA4/054/15) on 5 May 2015. The study protocol was registered on 3 June 2016 in the German Clinical Trials Register (DRKS-ID: DRKS00010111). The study took place between August 2018 and March 2019 at the BWC in Überlingen (Germany), a specialised centre for fasting therapy. The study was conducted in accordance with the principles of the Declaration of Helsinki. All participants gave their written informed consent.
Participants
Forty volunteers (20 men and 20 women), aged 30–65 years accepted to participate in this observational study. The subjects had to undergo a fasting program of at least 14 days, including various fasting durations ranging from 13 to 26 days at the BWC. They were recruited out of the regular pool of patients. Exclusion criteria were: lipid lowering drugs, diabetes under medication, existing contraindications of fasting like anorexia nervosa, advanced kidney, liver, or cerebrovascular insufficiency, dementia and other debilitating cognitive disease, pregnancy or lactation. Moreover, subjects were not enrolled when an adequate linguistic communication was not possible in German, English or French or when the subjects participated in another clinical trial.
Fasting program
All participants followed the fasting program of the BWC in accordance with peer-reviewed guidelines [29], supervised by nurses and specialized physicians on a daily basis. Before the beginning of the fast, subjects underwent a transition day comprising a standardized 600 kcal vegetarian mono-diet. The fasting program was conducted as previously described in detail [8]. All subjects were requested to drink 2–3 L of water or non-caloric herbal teas with an optional portion of 20 g honey every day. Moreover, they received freshly squeezed fruit juice (250 ml) at midday and a vegetable soup (250 ml) in the evening, leading to an average total daily calorie intake of 200–250 kcal and 25–35 g of carbohydrates. The breaking of fast was conducted after the third measurement on day 14. The food was slowly reintroduced on an ovo-lacto-vegetarian basis during a period of four days in which the calorie intake increased from 800 to 1600 kcal/day. The whole program was directed by certified professionals.
Data collection
Demographic and clinical information were collected after standardized protocols of the BWC. By means of the Research Electronic Data Capture (REDCap) tool different source data were abstracted and centrally matched in a secure, web-based software platform [30]. Plausibility controls like range checks were conducted automatically during data entry.
Clinical parameters
Body weight was measured every morning between 7:00 and 9:00 am, while subjects wore light clothing (Seca 704, Seca, Hamburg, Germany). Body height was determined with Seca 285 (Seca). At the beginning and at the end of the fast, waist circumference was measured with a measuring tape placed mid-way between the lowest rib and the iliac crest (Openmindz GmbH, Heidelberg, Germany). Blood pressure and heart rate were determined at each time point once at the non-dominant arm in the sitting position after a pause using an upper arm blood pressure monitor (Boso Carat professional, BOSCH + SOHN GmbH u. Co. KG, Jungingen, Germany).
Categorization of the disease status at baseline
Obesity was reported when BMI was ≥ 30 kg/m2. Hyperlipidemia was diagnosed when LDL-C levels were ≥ 4.14 mmol/L and hypertriglyceridemia when TG levels were ≥ 1.70 mmol/L. Hypertension was diagnosed either when blood pressure (BP) values were ≥ 140/ ≥ 90 mmHg measured at the beginning of the procedure or a pre-existing disease was documented in the medical report. Type 2 diabetes was diagnosed with HbA1c levels ≥ 6.5% (> 42 mmol/mol) or according to the personal doctor’s diagnosis.
Self-reported data
Physical activity was self-rated by the participants as a mean value indicated as hours per week before and at the end of fasting. The consumption of alcohol was documented as glasses of beer (0.3 l), wine (0.2 l) or spirits (0.02 l) per week and summed up to the amount of drinks per week.
Safety assessments
Possible adverse events were continuously monitored and documented in an adverse event report form.
Laboratory examinations
Blood samples were collected in the morning between 7:30 and 9:30 am at baseline, after 7 and 14 fasting days by trained medical–technical assistants. The baseline blood draw took place at the beginning of the stay at BWC either on the transition day or the first fasting day. The second blood draw was collected 7 days after the baseline blood draw. Likewise, the third sample was collected 14 days afterwards. Serum tubes (S-Monovette, 9 ml Z-Gel) were centrifuged at 3290 g (5000 rpm) for 10 min at room temperature. TC, TG, glucose, HbA1c, high-sensitivity C-reactive protein (hs-CRP) and fibrinogen were measured directly in fresh blood samples. For lipid profiles, density gradient ultracentrifugation, and NMR spectroscopy, samples were stored in aliquots at − 70 °C. All analyses have been performed within twelve months from blood collection.
Clinical chemistry parameters
Iodixanol was supplied as 60% w/v solution (OptiPrepTM) by Axis-Shield PLC (Dundee, UK). OptiSealTM tubes (3.2 ml) were supplied by Beckman Coulter (Krefeld, Germany). Triacylglycerol, Cholesterol, LDL-Cholesterol, HDL-Cholesterol, apoB, apoA1 and lipoprotein(a) assays, calibrators and serum lipid controls were purchased from Roche (Mannheim, Germany). For lipoprotein(a), the measuring range was 7–240 nmol/L (Tina-quant® Lipoprotein (a) Gen. 2, Roche). All lipid measurements were performed on the Cobas C501 from Roche. Inter- and intra-assay coefficients of variation for lipoprotein(a) are shown in Table S5. Non-HDL-C was calculated as the difference between TC and HDL-C. Glucose was measured on the Siemens ADVIA 2400. HbA1c was determined with the Tosoh G8 HPLC Analyzer. Hs-CRP was measured on the BN II Siemens nephelometric analyser. For fibrinogen, the ACL TOP (Instrumentation Laboratory) was used.
Density gradient ultracentrifugation of lipoprotein subclasses
The procedure for the separation of lipoprotein subclasses using iodixanol originally described by Graham et al. [31, 32] was adapted as follows. 1 ml of serum, 1.24 ml Hepes buffer saline (HBS) buffer (10 mM HEPES; 0.8% NaCl; pH7.4), and 0.54 ml OptiPrepTM (60% iodixanol) were transferred into a Beckman OptiSealTM tube (3.2 ml) and thoroughly mixed by gentle, repeated over-head rotation. The mixture was carefully overlayed with distilled water to fill the tube. The tubes were housed in a Beckman TLN100 rotor and centrifuged at 400,000 g for 3 h at 15 °C with acceleration program 9 and deceleration program 9 in a Beckman Optima E-max benchtop ultracentrifuge. Gradients were collected using a Beckman gradient unloader, which pierces the tube bottom, a Watson–Marlow 520S/R precision peristaltic pump, and a Gilson (Villiers, France) fraction collector. A total of 20 fractions, each 0.16 ml, were collected by continuously pumping the gradient from the bottom of the tube to the fraction collector numbering the fractions from top (fraction 1) to bottom (fraction 20). The fractions of the gradient were pooled to obtain the following lipoprotein fractions: VLDL (fractions 1–2; iodixanol density range = 1.000–1.010 g/ml), IDL (fractions 3–4; iodixanol density range = 1.010–1.014 g/ml), LDL1 (fractions 5–8; iodixanol density range = 1.014–1.027 g/ml), LDL2 (fractions 9–11; iodixanol density range = 1.027–1.037 g/ml), LDL3 (fractions 12–13; iodixanol density range = 1.037–1.057 g/ml), HDL2 (fractions 14–17; iodixanol density range = 1.057–1.106 g/ml), and HDL3 (fractions 18–20; iodixanol density range = 1.106–1.181 g/ml). The numbering of the LDL subclasses depends on the methodology and does not match the numbering of other methods. The term "small, dense LDL" is usually used for the LDL subclass with the highest density range and the smallest diameter of the method used. In each of the lipoprotein fractions TG, TC, LDL-cholesterol, and HDL-cholesterol were measured on the Cobas c501 (Roche) with the reagent kits from Roche.
NMR spectroscopy for analysis of lipoprotein subclasses
Lipoproteins from samples stored at − 80 °C were analyzed by NMR spectroscopy at Numares AG (Regensburg, Germany) using the AXINON LipoFIT-S100 test system according to the manufacturer's protocol. NMR spectra were recorded at a temperature of 310 K ± 0.4 K on a shielded 600 MHz Bruker Avance II + spectrometer in a fully automated process. Lipoprotein analysis was conducted via deconvolution of the broad methyl group signal at about 0.9–0.8 ppm. In this process, lipoprotein subclasses are reflected by a fixed number of predefined bell shaped (e.g. Gaussian or Lorentzian) base functions, each of which has a constant position and defined width. A least squares algorithm was used to find optimal parameters for the linear combination of base functions that minimize the deviation from the measured signal. The concentrations of lipoprotein particles and cholesterol in lipoprotein subclasses, as well as the average particle size, were calculated based on the integrals attributable to specific base functions and underwent statistical evaluation. All the measured lipid parameters are given: concentration of large VLDL particles (large VLDL-p), of all LDL particles (LDL-p), of large LDL particles (large LDL-p), of small LDL particles (small LDL-p), of all HDL particles (HDL-p), of large HDL particles (large HDL-p), of small HDL particles (small HDL-p); mean sizes of VLDL particles (VLDL-s), of LDL-p (LDL-s) and of HDL-p (HDL-s).
Statistics
We estimated the statistical power based on the effect size for the difference in sdLDL levels observed in a previous, exploratory, pilot study with 16 individuals undergoing LF according to the same fasting protocol as presented in this study. The enrolled five men and eleven women were aged between 44 and 69 years. The pilot study was conducted within the scope of the described observational trial. In contrast to the present study, the measured fasting duration was variable and ranged between 5 and 14 days.
Effect sizes were Cohen’s d values calculated with the R package rstatix (version 0.6.0). They were used to calculate the statistical power with R package WebPower (version 0.5.20) in R version 4.0.0. A power of 0.92 is achieved with a sample size of 20 individuals to detect a change in sdLDL levels (Cohen’s d = 0.7) with a paired t test (alpha = 0.05).
The baseline characteristics of the patients grouped by gender were compared using the chi-squared or Fisher’s exact test for categorical variables and the t test for continuous variables. For the categorical variables, we reported frequencies and percentages, and the quantitative data are expressed as the mean ± standard deviation. The primary end point was set as the change in sdLDL. We applied multivariable linear mixed models for repeated measures adjusted for age and sex with unstructured covariance structure to model within-subject errors. Multiple comparison adjustment for heterogeneous variance between groups was applied. For variables that were not normally distributed, geometric means were calculated from the log-transformed variable (base e). The overall p value of the models (p), is indicated along pairwise statistical differences between the three time points as adjusted p values (adj-p).
We also used partial least squares discriminant analysis (PLS-DA) methods to evaluate which lipoprotein contributes the most to the effects of the fast on lipid profiles. The R package ropls version 1.20.0 was used. Prior to analysis, experimental variables were centered and unit-variance scaled. Since PLS-DA methods are prone to overfitting, we assessed the significance of our classification using permutation tests (permuted 1000 times).
All statistical analyses were performed with SAS software (version 9.4; SAS Institute Inc., Cary, North Carolina, USA). A two-sided p value of 0.05 was considered as statistically significant.
Results
Subject characteristics
Between August 2018 and March 2019, 156 subjects were screened for eligibility of which 44 subjects were enrolled (Fig. 1). Three individuals were excluded from analysis due to minor non-compliance and one was excluded for incorrect blood processing.
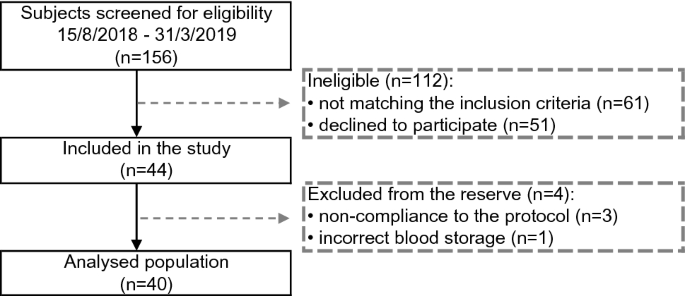
Flow chart of the selection procedure
The group included 40 individuals (39 Caucasians; 50% men), aged 50.7 ± 9.5 years (range 32–65 years), with a BMI of 29.8 ± 5.5 kg/m2 and WC of 97.2 ± 16.0 cm; 47.5% were obese with a BMI > 30 kg/m2. High BP was documented in 21 individuals at baseline. Total and LDL-C were in the upper range of normal [33] (TC = 5.52 ± 1.48 mmol/L and LDL-C = 3.21 ± 1.16 mmol/L) with 16 participants (40%) classifying as hyperlipidemic. HDL-C and TG were in the normal range: 1.36 ± 0.40 mmol/L and 1.45 ± 0.6 mmol/L, respectively. Eleven participants (28%) presented hypertriglyceridemia. Overall, the baseline lipid profile did not differ between men and women. Only levels of HDL-C were significantly higher in women. Conversely, TG levels in men appeared higher but did not reach statistical significance (p = 0.0677). Glycemia and glycated haemoglobin (HbA1c) were in the normal range, i.e. 5.21 ± 0.66 mmol/L and 35.1 ± 5.5 nmol/mol. Only one man had a diagnosis of type 2 diabetes (Table 1).
Impact of fasting on anthropometric measurements, lipid and non-lipid cardiovascular risk biomarkers
Fasting resulted in a significant weight loss of 4.5 ± 0.2 kg after 7 days and 7.0 ± 0.3 kg after 14 days (p < 0.0001) (Table 2 and S1 for gender differences). Waist circumference showed a mean reduction of 7.5 ± 0.4 cm at the end of fasting (p < 0.0001). Total cholesterolemia showed a slight, non-significant decrease after the first 7 days of fasting (5.32 ± 0.25 mmol/L; adj-p = 0.2459) and the decrease became significant after 14 days (from 5.52 ± 0.23 to 4.57 ± 0.27 mmol/L; adj-p < 0.0001; Table 2). Levels of plasma TGs were also reduced during the intervention, decreasing after 7 days from 1.45 ± 0.1 mmol/L to 1.15 ± 0.05 mmol/L (adj-p = 0.0065) and after 14 days to 1.1 ± 0.04 mmol/L (adj-p = 0.0025). Men had higher TG values (p = 0.0466). Levels of LDL-C and non-HDL-C showed a slight, non-significant decrease after 7 days (respectively, p = 0.9890 and p = 0.8494); this became significant after 14 days (LDL-C: adj-p < 0.0001; non-HDL-C: adj-p = 0.0002). Lipoprotein(a) levels increased after 7 days and subsequently decreased (p < 0.0001). Levels of ApoAI, higher in women at baseline (p = 0.0006), decreased significantly during fasting (p = 0.0431). ApoB levels showed a slight, non-significant increase after 7 days of fasting (adj-p = 0.0808), returning to basal after 14 days (adj-p = 0.9807). Fibrinogen and hs-CRP (Table 2) were in the normal range at baseline. A tendency to increase was observed in both parameters after 7 days, followed by a significant decrease after 14 days (Fibrinogen: p = 0.0056; hs-CRP: p = 0.0029) when values returned to baseline. Physical activity, recommended by the program, increased during fasting from 4.2 ± 0.6 h/week at baseline to 13.9 ± 1.1 h/week at the end of trial (p < 0.0001).
Lipoprotein subclasses analysis by density gradient ultracentrifugation
Since circulating lipoprotein particles vary in size, density, and lipid composition, each showing a different atherogenic pattern, we analysed the impact of long-term fasting on lipoprotein subclasses along with their cholesterol and TG contents (Table 2 and S2 for gender differences).
VLDL
A VLDL-C decrement of − 0.15 ± 0.03 mmol/L was reached 7 days after food cessation, an effect stable after 14 days of fasting (− 0.16 ± 0.03 mmol/L; p < 0.0001). The TG content of VLDL was reduced by − 0.44 ± 0.07 mmol/L and − 0.46 ± 0.08 mmol/L after 7 and 14 days (p < 0.0001), respectively.
IDL
IDL-C, the catabolic product of VLDL-C fell after 7 and 14 days of fasting by − 0.01 ± 0.01 mmol/L and − 0.03 ± 0.01 mmol/L (p = 0.0135), respectively. Only a slight, non-significant increase in IDL-TG content was found (p = 0.5778) but levels in men appeared significantly higher overall (p = 0.0409).
LDL
Two weeks of fasting led to a drop in the cholesterol content of LDL1, LDL2 and LDL3 by − 0.16 ± 0.05 mmol/L, − 0.30 ± 0.06 mmol/L, and − 0.27 ± 0.05 mmol/L, respectively (each p < 0.0001; Table 2). These changes were accompanied by significant rises in the TG content by 0.06 ± 0.01 mmol/L (LDL1), 0.04 ± 0.01 mmol/L (LDL2) and 0.02 ± 0.01 mmol/L (LDL3; each p < 0.0001).
HDL
In the whole group, HDL2-C decreased after one week by − 0.10 ± 0.04 mmol/L and remained stable up to 14 days (− 0.11 ± 0.04 mmol/L; p = 0.0261), an effect apparently driven by the higher baseline levels of women (p = 0.0006). A similar trend was found in the analysis of HDL3-C, decreasing by − 0.04 ± 0.01 mmol/L (7 days) and − 0.06 ± 0.01 mmol/L (14 days; p < 0.0001), again women had higher baseline values (p = 0.0065). No differences were found in the HDL-TG content (HDL2-TG: p = 0.2659; HDL3-TG: p = 0.3705).
Ratios that reflect the lipid content within the lipoproteins can be found in the supplementary material (Table S3).
Altogether, these results suggest that reductions in plasma cholesterol levels are driven by a reduction in cholesterol in all lipoprotein subclasses but predominantly in LDL-C. Conversely, reductions in plasma triglyceride levels are exclusively explained by reductions in VLDL-TG levels.
NMR lipoprotein particle size and concentrations
In addition to the ultracentrifugation, a NMR analysis was conducted to get further insights on particle size and concentrations (Table 3 and S4 for gender differences). Fasting did not affect mean particle sizes of LDL (LDL-s; p = 0.1657) and VLDL (VLDL-s; p = 0.5181). Instead, HDL size (HDL-s; p < 0.0001) increased, particularly in men (p = 0.005).
The concentrations in large VLDL-p decreased significantly (− 4.10 ± 1.22 nmol/L) after 7 fasting days and by − 5.18 ± 1.26 nmol/L after 14 days (p < 0.0001). Total LDL-p showed a slight, non-significant decrease after the first week of fasting (adj-p = 0.9990) but decreased significantly after 14 days (adj-p < 0.0001), with a drop in both large (− 244.13 ± 39.45 nmol/L; p < 0.0001) and small LDL-p (-38.45 ± 44.04 nmol/L; p < 0.0001). In particular, concentrations in small LDL-p differed between genders with a more pronounced decrement in men (p = 0.0047). Although the concentrations in total HDL-p decreased significantly (p < 0.0001), during fasting regardless of gender (p = 0.2193), large HDL-p increased after 7 days and after 14 days (p = 0.0419). Conversely, there was a decrease in small HDL-p during fasting in the whole population (− 8700.6 ± 867.6 nmol/L; p < 0.0001).
Furthermore, it was evaluated whether changes in LDL-p concentrations were associated with changes in apoB. Figure 2 shows a high correlation between increased LDL-p concentrations and increased apoB (p < 0.0001).

Changes in apoB were associated with changes in LDL-p concentrations at baseline, after 7 and 14 fasting days. Dot plots show the correlation for the parameters between the different time points (baseline, red; 7 fasting days, green; 14 fasting days, blue)
Relative contribution of the different lipoproteins to the lipoprotein changes observed during fasting
To dissect out the relative contribution of each lipoprotein in the differences observed during fasting, a partial least squares discriminant analysis (PLS-DA) was performed. Lipoprotein profiles at baseline or during fasting were well separated with no outliers (Fig. S1). Permutation testing showed that the difference between the two was statistically significant (pR2Y < 0.001 and pQ2 < 0.001), lipoproteins contributing most to this difference (VIP scores > 1.5) were VLDL, LDL2 and LDL1. Although the separation between different classes by NMR was statistically significant, no VIP score exceeded 1.5. Overall, this multivariate analysis suggests that the largest lipoproteins (VLDL, LDL1 and 2) were the most affected by fasting, HDL lipoproteins being the least affected.
Discussion
Nutritional strategies, such as IF, alternate-day fasting and LF (up to three weeks), have been shown to affect the CV risk markers as previously reviewed by our group [1]. Since blood lipids play a causal role in the etiology of coronary heart disease, detailed lipid-lipoprotein determinations can be used to assess risk changes in a non-invasive way. By contrast, other non-invasive vascular evaluations, such as the carotid intima media thickness, are unlikely to be affected by short or medium-term interventions [34]. A major novelty of this report is the reduction of apoB-containing lipoproteins following LF up to 14 days, with LDL3-C and VLDL-TG being the most affected and HDL the least modified.
Fasting is defined by a cessation of food intake, thus interrupting exogenous lipid intake. The transport of dietary lipids from the intestine to peripheral tissues and liver is thus presumably halted. Subsequently, neither chylomicrons nor chylomicron remnants are formed. At the same time, free fatty acids from the adipose tissue are mobilized [35]. Thus, the synthesis of VLDL may be reduced. A rapid decline in circulating VLDL-C, concomitant with a decrease in IDL-C was documented in our cohort. Not all LDL-C subclasses were reduced after 7 days of fasting, whereas significant decreases were documented after 14 fasting days. This suggests that longer periods of fasting will possibly enhance the benefits.
TC and LDL-C have been traditionally considered as single ASCVD lipid risk factors, but nowadays the role of LDL sub-fractions has gained interest [20]. SdLDLs have a prolonged residence time in the circulation with extensive inter-particle transfer via the cholesteryl ester transfer protein (CETP), increasing risk of plaque formation. Furthermore, the low affinity of sdLDL for the LDL receptors in the liver is also leading to a lower reuptake and longer residence in the circulation [22]. In the present study, we showed an early percent reduction of sdLDL after 7 days of fasting and still more after 14 days. SdLDL particles confer a greater atherogenic risk than larger, less dense LDL particles [36], being more avidly taken up by macrophages than larger, less dense LDL, being more susceptible to oxidative modification, having a greater propensity for transport into the arterial subendothelial space, and for binding potential to arterial wall proteoglycans [21]. The exposure of LDL-p to oxidative stress in endothelial cells involves the action of reactive oxygen species [37] with recruitment of several cell types, including endothelial cells, monocyte-macrophages (leading to foam cell formation), T lymphocytes, and fibroblasts [38]. In a previous study of a ten-day fast with the same program [39], LF reduced lipid peroxidation and concomitantly raised the antioxidant capacity as well as redox biomarkers, thus antagonizing LDL oxidation [39, 40]. A higher LDL-p concentration has been associated with cardiovascular disease (CVD) incidence, but since studies have not determined whether any measures of LDL sub-fractions add incremental benefit to the traditional risk factor assessment [41], the aim of the present study was to determine LDL sub-fraction changes after the LF dietary intervention and their possible impact beyond that of the traditional risk factors. As suggested by other authors, apoB-containing particles including lipoprotein(a) appear to provide a better prediction of risk versus LDL-C, since many individuals with atherogenic dyslipidemia have increased concentrations of LDL-p without a rise in LDL-C [42]. Aside from sdLDL, it is assumed that all LDL-p are atherogenic [43]. This is shown in the case of patients with familial hypercholesterolemia displaying a predominance of large, buoyant LDL particles and early atherosclerosis [44]. All measured LDL subclasses are reduced by 20% or more at the end of 14 days of fasting (Fig. 3). Since LDL1-C is less atherogenic than LDL3-C [45], LF appears to be linked to a reduced lipoprotein-associated risk profile.
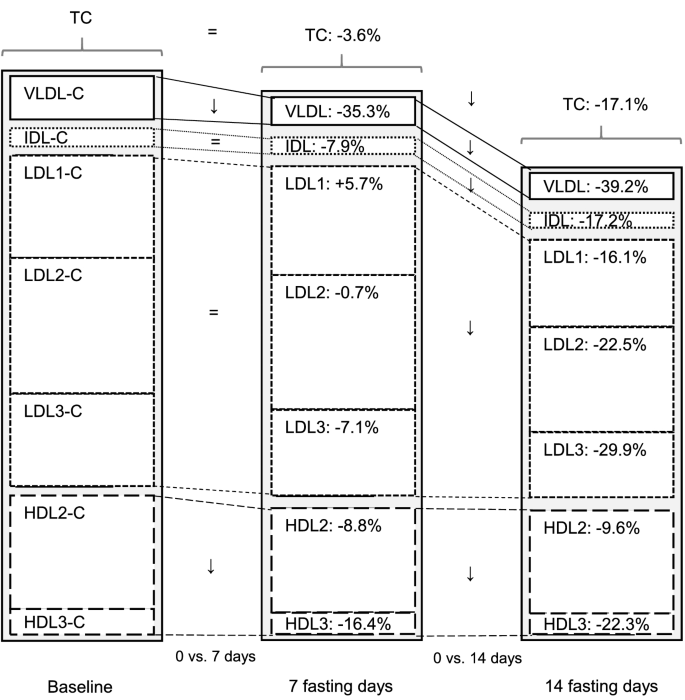
Changes of cholesterol concentration in lipoprotein subclasses before and after 7 and 14 days of fasting. Significant changes between baseline and 7 days as well as baseline and 14 days of fasting are indicated with an arrow. Non-significant changes are indicated with an equal sign
Each circulating atherogenic lipoprotein particle contains one apoB molecule, but the amount of cholesterol (especially in LDL-p) and the amount of TG (especially in VLDL-p) can vary extensively among particles. Whilst the concentration of LDL-C and TG quantifies their concentrations in circulating lipoproteins, they do not precisely quantify the concentration of atherogenic particles, being instead theoretically directly proportional to the concentrations of apoB molecules [46, 47]. In the present study, we observed a discordance between apoB and LDL-p, as earlier described by Varvel et al. [48]. This could be due to the efficiency of current apoB immunoassays that may vary with respect to particle size or shape because of conformational changes in the binding epitope of apoB as the particle shrinks or distorts [48].
Some epidemiological studies have reported that the levels of non-HDL-C, which includes cholesterol of TG-rich lipoproteins, could be a better risk predictor in individuals with hypertriglyceridemia [49]. Non-HDL-C concentrations have been strongly associated with long-term risk of atherosclerotic cardiovascular disease [50]. Most adults with elevated non–HDL-C early in life continue to have high non–HDL-C over the entire life course, leading to significantly increased CVD risk [51]. The results of the present study indicative of a large decrement in non-HDL-C are in line with strategies to improve CV risk [50].
Lipoprotein-associated CV risk, besides being dependent on LDL-C, is determined by a cluster of metabolic abnormalities, referred to as the “atherogenic lipid phenotype”, characterized by elevated fasting and post-prandial TG-rich lipoprotein levels and their remnants, increased sdLDL and decreased HDL [15, 52]. The major TG-containing lipoproteins in fasted subjects are VLDL (d < 1.006) and, to a lesser extent, IDL (d > 1.006 but < 1.019), both containing apoB-100. Since the slowly metabolized sdLDL are derived from the lipolysis of the large VLDL species [15], the observed reduction of VLDL is clinically important. VLDL remnants are direct substrate for atherosclerotic plaque development, rather than TG [53]. In patients with CVD, elevated levels of VLDL-C account for one-half of the risk of myocardial infarction [54]. Moreover, the transient rise we found in lipoprotein(a) seems in line with previous evidence reporting that reduction of saturated fat was associated with an increase in lipoprotein(a) levels, despite a decrement in LDL-C [55].
The protective effects of HDL are well known but the role of two major HDL sub-fractions (HDL2-C, HDL3-C) is unclear. Some studies suggest that HDL2-C is more atheroprotective, while HDL3-C is less atheroprotective or neutral on CV risk [56, 57], whereas other studies suggest that HDL3-C is more atheroprotective [58]. There is indication that HDL2 is atheroprotective because of a higher vasodilatory activity [59], whereas HDL3 is responsible for the major activity of HDL, i.e., tissue cholesterol removal [60]. There is also evidence that both sub-fractions correlate with reduced risk of CV events [61]. Our data showed a reduction in both HDL2 and HDL3 levels. By NMR analysis, small HDL (mainly identifiable with HDL3) showed a larger reduction whereas the larger HDL particles were significantly raised. This is in line with the observed drop in apoA1 reflecting a decrease in the precursor of HDL [62]. The small reduction of total HDL-C can be well ascribed to the apparently raised CETP activity, resulting in an increased transfer-exchange of TG for cholesterol between VLDL and HDL [63].
Several methodologies for the assessment of lipoprotein composition exist, limiting the comparability of different study results. As reported in the consensus-based recommendations from European Atherosclerosis Society (EAS) and European Federation of Clinical Chemistry and Laboratory Medicine (EFLM), there is a need to standardize and validate advanced lipoprotein tests, such as NMR- or ion mobility-based LDL- and VLDL-particle numbers and size [64]. Overall, the application of NMR measurements combined with the ultracentrifugation (i.e., the traditional method) showed complementary results in the present study. The use of high-throughput testing with NMR should be taken into consideration for future clinical laboratory testing, because ultracentrifugation is restricted by the need of manual sample preparation, hindering the routine service.
A limitation of the present study is that patients were from Caucasian ethnicity with one exception. Furthermore, we did not measure CETP activity and can thus only hypothesize that this was reduced. Considering that CETP facilitates the net movement of cholesteryl ester from HDL to VLDL and LDL in exchange for TG [65], we found that fasting reduced the cholesterol content and increased that of TG in LDL. In line with this hypothesis, a rise in the velocity of CE transfer from HDL to VLDL and LDL has been described post-prandially after fat intake [66]. Moreover, the lipoprotein lipase activity was not, measured: the insulin drop during fasting [27, 67] could reduce the insulin-dependent activity of the enzyme. When TG levels at baseline are ≥ 1.70 mmol/L, the decrease in TG levels is much more pronounced than with lower levels. Future studies should investigate individuals with and without hypertriglyceridemia. Feasibility and safety of this fasting program were documented in a large cohort [8], the follow-up, monitoring long-term lipoprotein changes can provide further important information. Finally, the coefficient of variation greater than 30% for lipoprotein(a) levels below 20 nmol/L could have affected the results found at 7 days. This could be a consequence of weight loss [68].
In conclusion, exposure to LF was followed by favourable changes in most plasma lipids, lipoprotein levels and lipoprotein subclasses (Fig. 3). In particular, the reduction of TG and of sdLDL appears to clearly indicate the potential CV benefit of this fasting intervention, to be confirmed in future follow-up studies.
Availability of data and material
The dataset analyzed during the current study is available from the corresponding author on reasonable request.
References
Wilhelmi de Toledo F, Grundler F, Sirtori CR, Ruscica M (2020) Unravelling the health effects of fasting: a long road from obesity treatment to healthy life span increase and improved cognition. Ann Med 52(5):147–161. https://doi.org/10.1080/07853890.2020.1770849
de Cabo R, Mattson MP (2019) Effects of intermittent fasting on health, aging, and disease. N Engl J Med 381(26):2541–2551. https://doi.org/10.1056/NEJMra1905136
Dong TA, Sandesara PB, Dhindsa DS, Mehta A, Arneson LC, Dollar AL, Taub PR, Sperling LS (2020) Intermittent fasting: a heart healthy dietary pattern? Am J Med 133(8):901–907. https://doi.org/10.1016/j.amjmed.2020.03.030
Horne BD, Grajower MM, Anderson JL (2020) Limited evidence for the health effects and safety of intermittent fasting among patients with type 2 diabetes. JAMA 324(4):341–342. https://doi.org/10.1001/jama.2020.3908
Corley BT, Carroll RW, Hall RM, Weatherall M, Parry-Strong A, Krebs JD (2018) Intermittent fasting in Type 2 diabetes mellitus and the risk of hypoglycaemia: a randomized controlled trial. Diabet Med 35(5):588–594. https://doi.org/10.1111/dme.13595
Carter S, Clifton PM, Keogh JB (2018) Effect of intermittent compared with continuous energy restricted diet on glycemic control in patients with type 2 diabetes: a randomized noninferiority trial. JAMA Netw Open 1(3):e180756. https://doi.org/10.1001/jamanetworkopen.2018.0756
Anton SD, Moehl K, Donahoo WT, Marosi K, Lee SA, Mainous AG III, Leeuwenburgh C, Mattson MP (2018) Flipping the metabolic switch: understanding and applying the health benefits of fasting. Obesity (Silver Spring) 26(2):254–268. https://doi.org/10.1002/oby.22065
Wilhelmi de Toledo F, Grundler F, Bergouignan A, Drinda S, Michalsen A (2019) Safety, health improvement and well-being during a 4 to 21 day fasting period in an observational study including 1422 subjects. PLoS ONE. https://doi.org/10.1371/journal.pone.0209353
Klempel MC, Kroeger CM, Varady KA (2013) Alternate day fasting increases LDL particle size independently of dietary fat content in obese humans. Eur J Clin Nutr 67(7):783–785. https://doi.org/10.1038/ejcn.2013.83
Wilkinson MJ, Manoogian ENC, Zadourian A, Lo H, Fakhouri S, Shoghi A, Wang X, Fleischer JG, Navlakha S, Panda S, Taub PR (2020) Ten-hour time-restricted eating reduces weight, blood pressure, and atherogenic lipids in patients with metabolic syndrome. Cell Metab 31(1):92-104.e105. https://doi.org/10.1016/j.cmet.2019.11.004
Filippou CD, Tsioufis CP, Thomopoulos CG, Mihas CC, Dimitriadis KS, Sotiropoulou LI, Chrysochoou CA, Nihoyannopoulos PI, Tousoulis DM (2020) Dietary approaches to stop hypertension (DASH) diet and blood pressure reduction in adults with and without hypertension: a systematic review and meta-analysis of randomized controlled trials. Adv Nutr 11(5):1150–1160. https://doi.org/10.1093/advances/nmaa041
Tuttolomondo A, Simonetta I, Daidone M, Mogavero A, Ortello A, Pinto A (2019) Metabolic and vascular effect of the mediterranean diet. Int J Mol Sci. https://doi.org/10.3390/ijms20194716
Laufs U, Parhofer KG, Ginsberg HN, Hegele RA (2020) Clinical review on triglycerides. Eur Heart J 41(1):99–109c. https://doi.org/10.1093/eurheartj/ehz785
Adiels M, Borén J, Caslake MJ, Stewart P, Soro A, Westerbacka J, Wennberg B, Olofsson SO, Packard C, Taskinen MR (2005) Overproduction of VLDL1 driven by hyperglycemia is a dominant feature of diabetic dyslipidemia. Arterioscler Thromb Vasc Biol 25(8):1697–1703. https://doi.org/10.1161/01.atv.0000172689.53992.25
Packard CJ, Boren J, Taskinen MR (2020) Causes and consequences of hypertriglyceridemia. Front Endocrinol (Lausanne) 11:252. https://doi.org/10.3389/fendo.2020.00252
Nymo S, Coutinho SR, Jørgensen J, Rehfeld JF, Truby H, Kulseng B, Martins C (2017) Timeline of changes in appetite during weight loss with a ketogenic diet. Int J Obes (Lond) 41(8):1224–1231. https://doi.org/10.1038/ijo.2017.96
Cahill G, Owen O, Morgan A (1968) The consumption of fuels during prolonged starvation. Adv Enzyme Regul 6:143–150
Sumithran P, Prendergast LA, Delbridge E, Purcell K, Shulkes A, Kriketos A, Proietto J (2013) Ketosis and appetite-mediating nutrients and hormones after weight loss. Eur J Clin Nutr 67(7):759–764. https://doi.org/10.1038/ejcn.2013.90
Hyde PN, Sapper TN, Crabtree CD, LaFountain RA, Bowling ML, Buga A, Fell B, McSwiney FT, Dickerson RM, Miller VJ, Scandling D, Simonetti OP, Phinney SD, Kraemer WJ, King SA, Krauss RM, Volek JS (2019) Dietary carbohydrate restriction improves metabolic syndrome independent of weight loss. JCI Insight. https://doi.org/10.1172/jci.insight.128308
Borén J, Chapman MJ, Krauss RM, Packard CJ, Bentzon JF, Binder CJ, Daemen MJ, Demer LL, Hegele RA, Nicholls SJ, Nordestgaard BG, Watts GF, Bruckert E, Fazio S, Ference BA, Graham I, Horton JD, Landmesser U, Laufs U, Masana L, Pasterkamp G, Raal FJ, Ray KK, Schunkert H, Taskinen MR, van de Sluis B, Wiklund O, Tokgozoglu L, Catapano AL, Ginsberg HN (2020) Low-density lipoproteins cause atherosclerotic cardiovascular disease: pathophysiological, genetic, and therapeutic insights: a consensus statement from the European atherosclerosis society consensus panel. Eur Heart J 41(24):2313–2330. https://doi.org/10.1093/eurheartj/ehz962
Berneis KK, Krauss RM (2002) Metabolic origins and clinical significance of LDL heterogeneity. J Lipid Res 43(9):1363–1379. https://doi.org/10.1194/jlr.r200004-jlr200
Chapman MJ, Orsoni A, Tan R, Mellett NA, Nguyen A, Robillard P, Giral P, Thérond P, Meikle PJ (2020) LDL subclass lipidomics in atherogenic dyslipidemia: effect of statin therapy on bioactive lipids and dense LDL. J Lipid Res 61(6):911–932
O’Neill B, Raggi P (2020) The ketogenic diet: pros and cons. Atherosclerosis 292:119–126. https://doi.org/10.1016/j.atherosclerosis.2019.11.021
Nigon F, Lesnik P, Rouis M, Chapman MJ (1991) Discrete subspecies of human low density lipoproteins are heterogeneous in their interaction with the cellular LDL receptor. J Lipid Res 32(11):1741–1753
Wilson PW, Abbott RD, Castelli WP (1988) High density lipoprotein cholesterol and mortality. The Framingham heart study. Arteriosclerosis 8(6):737–741. https://doi.org/10.1161/01.atv.8.6.737
Drinda S, Grundler F, Neumann T, Lehmann T, Steckhan N, Michalsen A, Wilhelmi de Toledo F (2019) Effects of periodic fasting on fatty liver index—a prospective observational study. Nutrients 11(11):2601. https://doi.org/10.3390/nu11112601
Mesnage R, Grundler F, Schwiertz A, Le Maho Y, Wilhelmi de Toledo F (2019) Changes in human gut microbiota composition are linked to the energy metabolic switch during 10 d of Buchinger fasting. J Nutr Sci. https://doi.org/10.1017/jns.2019.33
Grundler F, Mesnage R, Michalsen A, Wilhelmi de Toledo F (2020) Blood pressure changes in 1610 subjects with and without antihypertensive medication during long-term fasting. J Am Heart Assoc. https://doi.org/10.1161/JAHA.120.018649
Wilhelmi de Toledo F, Buchinger A, Burggrabe H, Hölz G, Kuhn C, Lischka E, Lischka N, Lützner H, May W, Ritzmann-Widderich M (2013) Fasting therapy-an expert panel update of the 2002 consensus guidelines. Complement Med Res 20(6):434–443. https://doi.org/10.1159/000357602
Harris PA, Taylor R, Minor BL, Elliott V, Fernandez M, O’Neal L, McLeod L, Delacqua G, Delacqua F, Kirby J, Duda SN (2019) The REDCap consortium: building an international community of software platform partners. J Biomed Inform. https://doi.org/10.1016/j.jbi.2019.103208
Graham J, Higgins JA, Gillott T, Taylor T, Wilkinson J, Ford T, Billington D (1996) A novel method for the rapid separation of plasma lipoproteins using self-generating gradients of iodixanol. Atherosclerosis 124(1):125–135
Graham JM, Griffin BA, Davies IG, Higgins JA (2001) Fractionation of lipoprotein subclasses in self-generated gradients of iodixanol. Atherosclerosis. Springer, pp 51–59
Mach F, Baigent C, Catapano AL, Koskinas KC, Casula M, Badimon L, Chapman MJ, De Backer GG, Delgado V, Ference BA (2020) 2019 ESC/EAS Guidelines for the management of dyslipidaemias: lipid modification to reduce cardiovascular risk: the task force for the management of dyslipidaemias of the European society of cardiology (ESC) and European atherosclerosis society (EAS). Eur Heart J 41(1):111–188
Baldassarre D, Hamsten A, Veglia F, De Faire U, Humphries SE, Smit AJ, Giral P, Kurl S, Rauramaa R, Mannarino E (2012) Measurements of carotid intima-media thickness and of interadventitia common carotid diameter improve prediction of cardiovascular events: results of the IMPROVE (carotid intima media thickness [IMT] and IMT-progression as predictors of vascular events in a high risk european population) study. J Am Coll Cardiol 60(16):1489–1499
Feingold KR, Grunfeld C (2018) Introduction to lipids and lipoproteins. In: endotext [internet]. MDText. com, Inc.; PMID:26247089
Hoogeveen RC, Gaubatz JW, Sun W, Dodge RC, Crosby JR, Jiang J, Couper D, Virani SS, Kathiresan S, Boerwinkle E, Ballantyne CM (2014) Small dense low-density lipoprotein-cholesterol concentrations predict risk for coronary heart disease: the atherosclerosis risk in communities (ARIC) study. Arterioscler Thromb Vasc Biol 34(5):1069–1077. https://doi.org/10.1161/atvbaha.114.303284
Schwenke DC, Carew TE (1989) Initiation of atherosclerotic lesions in cholesterol-fed rabbits. II. Selective retention of LDL vs. selective increases in LDL permeability in susceptible sites of arteries. Arterioscler: Off J Am Heart Assoc Inc 9(6):908–918
Goulinet S, Chapman MJ (1997) Plasma LDL and HDL subspecies are heterogenous in particle content of tocopherols and oxygenated and hydrocarbon carotenoids: relevance to oxidative resistance and atherogenesis. Arterioscler Thromb Vasc Biol 17(4):786–796
Grundler F, Mesnage R, Goutzourelas N, Tekos F, Makri S, Brack M, Kouretas D, de Toledo FW (2020) Interplay between oxidative damage, the redox status, and metabolic biomarkers during long-term fasting. Food Chem Toxicol 145:111701
Wilhelmi de Toledo F, Grundler F, Goutzourelas N, Tekos F, Vassi E, Mesnage R, Kouretas D (2020) Influence of long-term fasting on blood redox status in humans. Antioxidants. https://doi.org/10.3390/antiox9060496
Ip S, Lichtenstein AH, Chung M, Lau J, Balk EM (2009) Systematic review: association of low-density lipoprotein subfractions with cardiovascular outcomes. Ann Intern Med 150(7):474–484. https://doi.org/10.7326/0003-4819-150-7-200904070-00007
Mora S, Buring JE, Ridker PM (2014) Discordance of low-density lipoprotein (LDL) cholesterol with alternative LDL-related measures and future coronary events. Circulation 129(5):553–561
Jarauta E, Mateo-Gallego R, Gilabert R, Plana N, Junyent M, de Groot E, Cenarro A, Masana L, Ros E, Civeira F (2012) Carotid atherosclerosis and lipoprotein particle subclasses in familial hypercholesterolaemia and familial combined hyperlipidaemia. Nutr Metab Cardiovasc Dis 22(7):591–597. https://doi.org/10.1016/j.numecd.2010.10.011
Mora S, Szklo M, Otvos JD, Greenland P, Psaty BM, Goff DC Jr, O’Leary DH, Saad MF, Tsai MY, Sharrett AR (2007) LDL particle subclasses, LDL particle size, and carotid atherosclerosis in the multi-ethnic study of atherosclerosis (MESA). Atherosclerosis 192(1):211–217. https://doi.org/10.1016/j.atherosclerosis.2006.05.007
Austin MA, King MC, Vranizan KM, Krauss RM (1990) Atherogenic lipoprotein phenotype. A proposed genetic marker for coronary heart disease risk. Circulation 82(2):495–506. https://doi.org/10.1161/01.cir.82.2.495
Richardson TG, Sanderson E, Palmer TM, Ala-Korpela M, Ference BA, Davey Smith G, Holmes MV (2020) Evaluating the relationship between circulating lipoprotein lipids and apolipoproteins with risk of coronary heart disease: a multivariable Mendelian randomisation analysis. PLoS Med 17(3):e1003062. https://doi.org/10.1371/journal.pmed.1003062
Sniderman AD, Thanassoulis G, Glavinovic T, Navar AM, Pencina M, Catapano A, Ference BA (2019) Apolipoprotein B particles and cardiovascular disease: a narrative review. JAMA Cardiol 4(12):1287–1295. https://doi.org/10.1001/jamacardio.2019.3780
Varvel SA, Dayspring TD, Edmonds Y, Thiselton DL, Ghaedi L, Voros S, McConnell JP, Sasinowski M, Dall T, Warnick GR (2015) Discordance between apolipoprotein B and low-density lipoprotein particle number is associated with insulin resistance in clinical practice. J Clin Lipidol 9(2):247–255
Langsted A, Madsen CM, Nordestgaard BG (2020) Contribution of remnant cholesterol to cardiovascular risk. J Intern Med 288(1):116–127. https://doi.org/10.1111/joim.13059
Brunner FJ, Waldeyer C, Ojeda F, Salomaa V, Kee F, Sans S, Thorand B, Giampaoli S, Brambilla P, Tunstall-Pedoe H, Moitry M, Iacoviello L, Veronesi G, Grassi G, Mathiesen EB, Söderberg S, Linneberg A, Brenner H, Amouyel P, Ferrières J, Tamosiunas A, Nikitin YP, Drygas W, Melander O, Jöckel KH, Leistner DM, Shaw JE, Panagiotakos DB, Simons LA, Kavousi M, Vasan RS, Dullaart RPF, Wannamethee SG, Risérus U, Shea S, de Lemos JA, Omland T, Kuulasmaa K, Landmesser U, Blankenberg S (2019) Application of non-HDL cholesterol for population-based cardiovascular risk stratification: results from the multinational cardiovascular risk consortium. Lancet 394(10215):2173–2183. https://doi.org/10.1016/s0140-6736(19)32519-x
Pencina KM, Thanassoulis G, Wilkins JT, Vasan RS, Navar AM, Peterson ED, Pencina MJ, Sniderman AD (2019) Trajectories of non-HDL cholesterol across midlife: implications for cardiovascular prevention. J Am Coll Cardiol 74(1):70–79. https://doi.org/10.1016/j.jacc.2019.04.047
Sandesara PB, Virani SS, Fazio S, Shapiro MD (2019) The forgotten lipids: triglycerides, remnant cholesterol, and atherosclerotic cardiovascular disease risk. Endocr Rev 40(2):537–557. https://doi.org/10.1210/er.2018-00184
Davidson MH (2018) Triglyceride-rich lipoprotein cholesterol (TRL-C): the ugly stepsister of LDL-C. Eur Heart J 39(7):620–622. https://doi.org/10.1093/eurheartj/ehx741
Balling M, Afzal S, Varbo A, Langsted A, Davey Smith G, Nordestgaard BG (2020) VLDL cholesterol accounts for one-half of the risk of myocardial infarction associated with apoB-containing lipoproteins. J Am Coll Cardiol 76(23):2725–2735. https://doi.org/10.1016/j.jacc.2020.09.610
Enkhmaa B, Petersen KS, Kris-Etherton PM, Berglund L (2020) Diet and Lp(a): does dietary change modify residual cardiovascular risk conferred by Lp(a)? Nutrients. https://doi.org/10.3390/nu12072024
Lamarche B, Moorjani S, Cantin B, Dagenais GR, Lupien PJ, Després JP (1997) Associations of HDL2 and HDL3 subfractions with ischemic heart disease in men. Prospective results from the Québec cardiovascular study. Arterioscler Thromb Vasc Biol 17(6):1098–1105. https://doi.org/10.1161/01.atv.17.6.1098
Tiozzo E, Gardener H, Hudson BI, Dong C, Della-Morte D, Crisby M, Goldberg RB, Elkind MS, Cheung YK, Wright CB, Sacco RL, Desvarieux M, Rundek T (2016) Subfractions of high-density lipoprotein-cholesterol and carotid intima-media thickness: the Northern Manhattan study. Stroke 47(6):1508–1513. https://doi.org/10.1161/strokeaha.115.012009
Rye KA, Bursill CA, Lambert G, Tabet F, Barter PJ (2009) The metabolism and anti-atherogenic properties of HDL. J Lipid Res 50(Suppl):S195-200. https://doi.org/10.1194/jlr.R800034-JLR200
Perségol L, Darabi M, Dauteuille C, Lhomme M, Chantepie S, Rye KA, Therond P, Chapman MJ, Salvayre R, Nègre-Salvayre A, Lesnik P, Monier S, Kontush A (2018) Small dense HDLs display potent vasorelaxing activity, reflecting their elevated content of sphingosine-1-phosphate. J Lipid Res 59(1):25–34. https://doi.org/10.1194/jlr.M076927
Camont L, Lhomme M, Rached F, Le Goff W, Nègre-Salvayre A, Salvayre R, Calzada C, Lagarde M, Chapman MJ, Kontush A (2013) Small, dense high-density lipoprotein-3 particles are enriched in negatively charged phospholipids: relevance to cellular cholesterol efflux, antioxidative, antithrombotic, anti-inflammatory, and antiapoptotic functionalities. Arterioscler Thromb Vasc Biol 33(12):2715–2723. https://doi.org/10.1161/atvbaha.113.301468
Superko HR, Pendyala L, Williams PT, Momary KM, King SB 3rd, Garrett BC (2012) High-density lipoprotein subclasses and their relationship to cardiovascular disease. J Clin Lipidol 6(6):496–523. https://doi.org/10.1016/j.jacl.2012.03.001
Eisenberg S (1984) High density lipoprotein metabolism. J Lipid Res 25(10):1017–1058
Barter PJ, Kastelein JJ (2006) Targeting cholesteryl ester transfer protein for the prevention and management of cardiovascular disease. J Am Coll Cardiol 47(3):492–499. https://doi.org/10.1016/j.jacc.2005.09.042
Nordestgaard BG, Langlois MR, Langsted A, Chapman MJ, Aakre KM, Baum H, Borén J, Bruckert E, Catapano A, Cobbaert C, Collinson P, Descamps OS, Duff CJ, von Eckardstein A, Hammerer-Lercher A, Kamstrup PR, Kolovou G, Kronenberg F, Mora S, Pulkki K, Remaley AT, Rifai N, Ros E, Stankovic S, Stavljenic-Rukavina A, Sypniewska G, Watts GF, Wiklund O, Laitinen P (2020) Quantifying atherogenic lipoproteins for lipid-lowering strategies: consensus-based recommendations from EAS and EFLM. Atherosclerosis 294:46–61. https://doi.org/10.1016/j.atherosclerosis.2019.12.005
Morton RE, Liu Y (2020) The lipid transfer properties of CETP define the concentration and composition of plasma lipoproteins. J Lipid Res 61(8):1168–1179. https://doi.org/10.1194/jlr.RA120000691
Tall A, Sammett D, Granot E (1986) Mechanisms of enhanced cholesteryl ester transfer from high density lipoproteins to apolipoprotein B-containing lipoproteins during alimentary lipemia. J Clin Invest 77(4):1163–1172. https://doi.org/10.1172/jci112417
Li C, Sadraie B, Steckhan N, Kessler C, Stange R, Jeitler M, Michalsen A (2017) Effects of a one-week fasting therapy in patients with type-2 diabetes mellitus and metabolic syndrome—a randomized controlled explorative study. Exp Clin Endocrinol Diabetes 125(09):618–624
Berk KA, Yahya R, Verhoeven AJM, Touw J, Leijten FP, van Rossum EF, Wester VL, Lips MA, Pijl H, Timman R, Erhart G, Kronenberg F, Roeters van Lennep JE, Sijbrands EJG, Mulder MT (2017) Effect of diet-induced weight loss on lipoprotein(a) levels in obese individuals with and without type 2 diabetes. Diabetologia 60(6):989–997. https://doi.org/10.1007/s00125-017-4246-y
Acknowledgements
We thank the study patients for their participation and the physicians and nursing staff of the BWC for their cooperation. We also thank Dr Chiara Favero for independently revising the statistical analysis.
Funding
The study was financed by Amplius GmbH, Überlingen, Germany. This company is in charge of the research development for the BWC Überlingen and Marbella who are the funders. Amplius GmbH had no role in the design, analysis or writing of this article. No additional external funding was received for this study.
Author information
Authors and Affiliations
Contributions
DP, DM and FWT conceived and conceptualized the study. FG was project manager and coordinated study conduction and data collection. RM participated in the statistical analysis. MR and FG drafted the manuscript. CS as well as all authors contributed to data interpretation and the revision and editing of the final manuscript. All the authors approved the final version of the manuscript.
Corresponding author
Ethics declarations
Conflict of interest
FWT is managing director of Amplius GmbH. MR and RM are consultants of Amplius GmbH and receive financial compensation for this role. FWT and FG are employees of BWC. DP, DM and CS declare no conflict of interest.
Ethics approval
This observational study was approved by the medical council of Baden-Württemberg and the Ethics Committee of the Charité-University Medical Center, Berlin (application number: EA4/054/15). All procedures followed the ethical standards of the Declaration of Helsinki.
Consent to participate
All persons gave their written informed consent prior to their inclusion in the study.
Consent for publication
All authors will provide formal written consent after acceptance of the work.
Supplementary Information
Below is the link to the electronic supplementary material.
Rights and permissions
Open Access This article is licensed under a Creative Commons Attribution 4.0 International License, which permits use, sharing, adaptation, distribution and reproduction in any medium or format, as long as you give appropriate credit to the original author(s) and the source, provide a link to the Creative Commons licence, and indicate if changes were made. The images or other third party material in this article are included in the article's Creative Commons licence, unless indicated otherwise in a credit line to the material. If material is not included in the article's Creative Commons licence and your intended use is not permitted by statutory regulation or exceeds the permitted use, you will need to obtain permission directly from the copyright holder. To view a copy of this licence, visit http://creativecommons.org/licenses/by/4.0/.
About this article

Cite this article
Grundler, F., Plonné, D., Mesnage, R. et al. Long-term fasting improves lipoprotein-associated atherogenic risk in humans. Eur J Nutr 60, 4031–4044 (2021). https://doi.org/10.1007/s00394-021-02578-0
Received:
Accepted:
Published:
Issue Date:
DOI: https://doi.org/10.1007/s00394-021-02578-0