
Abstract
Detection of local wood inhomogeneities is important for accurate strength and stiffness prediction. In hardwood specimens, visual characteristics (e.g. knots or fibre deviation) are difficult to detect, either with a visual surface inspection or by the machine. Transversal ultrasound scan (TUS) is a non-destructive evaluation method with high potential for hardwoods. The method relies on differences in ultrasound wave propagation in perpendicular to the grain direction. The aim of this study is to estimate and analyse the capabilities of TUS for defect detection in hardwoods and prediction of mechanical property values. In the current paper, the TUS was applied to the hardwood species European ash (Fraxinus excelsior L.), Norway maple (Acer platanoides L.) and sycamore maple (Acer pseudoplatanus L.). In total, 16 boards of both specimens were completely scanned perpendicular to the grain using a laboratory scanner with dry-coupled transducers. The measurements were processed to 2D scan images of the boards, and image processing routines were applied to further feature extraction, defect detection and grading criteria calculation. In addition, as a reference for each board, all relevant visual characteristics and mechanical properties from the tensile test were measured. Using the TUS global fibre deviation, the size and the position of the knots can be detected. Knottiness correlates to the strength properties similarly or even better compared to the manual knottiness measurement. Between the global fibre angle measured using TUS and measured on the failure pattern, no correlation could be found. The ultrasound modulus of elasticity perpendicular to the grain does not show any meaningful correlation to the elastic properties parallel to the grain. In overall, TUS shows high potential for the strength grading of hardwoods.
1 Introduction
Temperate European hardwoods, such as ash, beech and oak of structural size are known for their excellent mechanical properties, which also make them attractive for structural applications (Blass et al. 2005; Ehrhart et al. 2016a, b; Kovryga et al. 2019). To utilize the advanced mechanical properties, the high variation of this naturally grown material needs to be reduced. For the strength of wood and, particularly of hardwoods, visible local wood inhomogeneities are important. The same characteristics are more difficult to detect and measure with the available techniques compared to softwood (Olsson et al. 2018; Schlotzhauer et al. 2018).
The relationship between the grading criteria and the mechanical properties, as well as application of grading methods, differ between softwoods and hardwoods. The most accurate strength prediction method, at least for softwoods, is achieved by means of machine strength grading. The grading machines can explain up to 62% of the strength variation (Bacher 2008). For hardwoods, machine grading allows only limited prediction accuracy. Models based on dynamic modulus of elasticty (MOEdyn), which is the most common criterion for the strength prediction, show R2 values between 0.18 and 0.36 (Nocetti et al. 2016; Ravenshorst 2015). Higher prediction accuracy can be achieved only if MOEdyn is combined with visually measured knottiness (Frühwald and Schickhofer 2005; Kovryga et al. 2019). Machine detection of the knottiness works less accurate for hardwoods compared to softwoods. Grading machines that use X-ray for the knot detection are limited because of the low contrast between the knots and clear wood (Giudiceandrea 2005). Other methods are currently not available for the strength grading purposes.
Fibre deviation is another important criterion for the grading of hardwoods if strength is regarded. Generally, fibre deviation can be separated into local and global fibre deviations. Changes in local fibre flow are caused by local wood inhomogeneities, such as knots, bark inclusions, or top rupture, whereas the global fibre deviations are observable over the entire length of the wood specimen. For knot-free specimens, the variation in strength values is still high as evidenced by a number of publications (e.g. Ehrhart et al. 2016a, b; Kovryga et al. 2019). For those specimens, changes particularly in local fibre direction have major impact on the strength. However, the visible fibre angle provides no reliable results for the strength prediction (Frühwald and Schickhofer 2005). The machine detection of the fibre deviation by means of different non-destructive techniques has recently been in the scope of the study. For softwoods, the multi-sensory systems, able to detect the fibre deviation by means of laser scaning (tracheid effect), are available (Olsson et al. 2013). More recent results show the potential of such measurements for hardwoods, particularly for oak (Olsson et al. 2018). Application of other NDT techniques to hardwoods, such as thermal conductivity measurement (Daval et al. 2015) and automated visual analysis of the spindle patterns (Ehrhart et al. 2018) has been on the research agenda.
The usual way to use ultrasound for strength grading is to determine the velocity of the ultrasound wave in direction longitudinal to the grain and thus MOEdyn (Sandoz 1989). Ultasound has the potential for detection of local wood inhomogeneities and thus improved strength grading. By applying ultrasound perpendicular to the grain direction, defects in wood can be detected. Transversal ultrasound scan (TUS) has been reported to detect knots, bark inclusions and other inhomogeneities in softwoods and some Northern American hardwoods in pallet parts (Kabir et al. 2002, 2003) and in structural timber (Machado et al. 2004). Ultrasound also provides information on the growth ring alignment. Propagation of the ultrasound wave differs between the radial and tangential growth ring orientations (e.g. Bucur 2006). Yaitskova and van de Kuilen (2014) provide an analytical model that links ultrasound wave propagation and growth ring orientation, so-called radial-tangential profile (RT-profile), and also highlights the possible application of TUS to the strength grading.
The aim of the present study is to analyze the potential of TUS for grading of European hardwoods, ash and maple. The definition and application of the novel grading criteria are of particular interest. The possibility to detect the major grading criteria—knots and the fibre deviation—and relate them to the mechanical properties are within the scope of the study.
2 Materials
To study the potential of ultrasound scan, a total of 79 boards of European hardwoods, namely European ash (Fraxinus excelsior L.), Norway maple (Acer platanoides L.) and sycamore maple (Acer pseudoplatanus L.), were used. Table 1 gives an overview of the selected specimens and their cross-section size. In total, 16 ash and maple boards out of the 79 boards were scanned with high resolution (5 × 5 mm), and 63 maple boards were scaned with coarse grid to evaluate the relationship between the ultrasound MOE perpendicular to the grain and tensile E0. The selected specimens are part of a larger sampling presented in Kovryga et al. (2019) for hardwoods. The material can be considered representative of the selected species grown in central Europe. The boards were selected in a way that different wood features, such as the presence of pith, knots, fibre deviations and defect-free specimens, were present in a sample.
3 Methods
3.1 Transversal ultrasound scan (TUS)
The hardwood specimens were scanned using a laboratory scanner developed at the TU Munich (Fig. 1). The measuring unit (including ultrasound transducers) is moved along the specimen in x- and y-direction within the scan area. Measuring unit is used to measure and generate longitudinally polarized ultrasound signal included Pundit Lab + with two dry-contact piezo-ceramic transducers, with a central frequency of 54 kHz from PROCEQ SA (Schwerzenbach, Switzerland). For the tested hardwoods, the wavelength corresponding to 54 kHz oscillation frequency in the direction perpendicular to the grains varies from 22 to 27 mm. The tested species (25–35 mm thickness) do not deceed the wavelength.

Mechanical structure of TUS (a) and the measuring geometry (b) (Yaitskova et al. 2015)
For each specimen, the area of 9 times the width (h) of the board was scanned by the device. 16 boards were scaned with high resolution (5 mm × 5 mm) resulting in a total of 82,800 measuring points. For the large maple sample (N = 63), the propagation of ultrasound signal was measured in 150 mm distance over the length of the board in four rows, with a space of 22.5 mm in between. In total, 28 measurement points were measured for each board. Those specimens were used to evaluate the relationship between the ultrasound MOE perpendicular to the grain and tensile MOE.
For each measuring point, different parameters of US signal—Time-of-flight (ToF), amplitude, energy, and spectral density—were calculated. For each parameter, a 2D image was generated and used to distinguish between the wood features and clear wood using image processing algorithms and optimization routines (Fig. 2). For the current analysis, only ToF is used. When the signal exceeds the threshold defined as the noise multiplied by the factor of 3, which corresponds to 15 mV, the time is registered as ToF. The threshold value was found experimentally. Based on cluster analysis, it is concluded that for 54 kHz transducer only time-of-flight provides sufficient results for the defect detection. Other parameters (such as amplitude in Fig. 2b) did not provide any additional information on the defects.

Scan images for the European ash (Fraxinus excelsior L.) specimen Nr. 263 a time-of-flight (ToF) and b amplitude in comparison to the images of the scan area acquired on all four surfaces c
3.2 Processing of ultrasound images
3.2.1 Image processing
In the current study, the feature detection includes two major targets: (1) detection of the global fibre deviation (minimum of RT-profile) and (2) detection of defects such as knots. Figure 3 visualizes major steps in processing of ultrasound signals starting with the measurement of ultrasound signal, followed by signal processing and then visualization and image processing steps required to segment the selected wood features (knots and alignment of fibres) out of the image. Each board is processed separately. For implementation of the algorithm, MATLAB R2016b and MATLAB Image Processing Toolbox R2016a (Mathworks, Natick, MA, USA) were used. The major steps are highlighted below:
-
1.
RT-profile extraction
Fig. 3 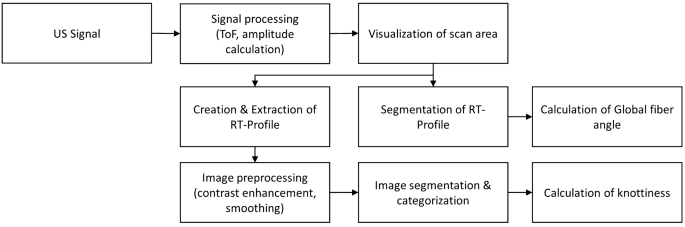
Algorithm for the processing of the ultrasound images
In the original time-of-flight (ToF) image, beside the wood features, the macroscopic growth ring orientation can be observed. The speed of ultrasound wave differs depending on the propagation direction. It is higher in radial than in tangential direction. These differences between radial and tangential orientation, named RT-profile, are shown in Fig. 2a as gradient. This alignment coincides with the position of the knots and needs to be filtered. Yaitskova and van de Kuilen (2014) suggested an analytical approach to extract the profile. However, this approach requires fitting the polynomial to each tested specimen. In the current study, the RT-profile was restored by applying the median filter with the 3 × 10 mask to the ToF image and extracting it (Eq. 1). Applying a filter over the length allowed to exclude local wood features, such as knots. A similar approach was chosen by Machado et al. (2004) to normalize the wave parameters and reduce the influence of structural features on timber pieces.
$$D\left( {x,y} \right) = { }M_{tof} \left( {x,y} \right) - F\left( {x,y} \right)$$(1)where D is a filtered image, Mtof is original image and F is a medium filter applied to it.
-
2.
Image pre-processing
Extraction of the profile increased the noise level in the image. To improve the segmentation performance, blurring using “Wiener filter” was applied to the images after RT-profile extraction. The Wiener filter provides a good solution for noisy images by adaptively tailoring itself to the local image variance. At locations with larger variance, only little smoothing is done; where the variance is little, more smoothing is performed. The mask of 3 × 10 pixels was chosen for the filtering. This means that the filter was applied in 10 pixels over the length of the board and 3 pixels along the width.
-
3.
Segmentation
Segmentation is the process of object extraction out of the image. Various algorithms, such as threshold techniques, texture-based algorithms, and wavelet-based techniques, are available. Algorithms are suitable to some specific use cases. Threshold techniques are the most common and frequently used techniques for low noise levels. For the current study, segmentation was done using global threshold value. A binary map is created by the global thresholding technique. By exceeding a certain threshold value, pixels are assigned to defects or to the clear wood. The map is created as follows:
$$B_{{tof}} \left( {x,y} \right) = \left\{ {\begin{array}{*{20}l} 1 \hfill & {if\,D\left( {x,y} \right) \ge T,defect} \hfill \\ 0 \hfill & {if\,D\left( {x,y} \right) < {\text{ }}T,clearwood} \hfill \\ \end{array} } \right.$$(2)Threshold (T) is a threshold value calculated for each single board as follows:
$$T = \mu \pm s$$(3)where µ is the mean value and s standard deviation of values in filtered image D (presented in Eq. 1).
-
4.
Classification
Classification is an important step to assign the object to the specific defect type based on the features of the segmented region. The boards included mostly knots and drying cracks in knots. No cracks were observed within the boards. Due to the low number of defect classes (clear wood vs knots) and only limited number of boards, no specific classification routine has been applied. Applying classification routines such as k-NN-classifier (k-nearest neighbor) or neural networks might improve the classification result, but would require larger data sets.

3.2.2 Detection of RT-profile
Each measurement of the ultrasound wave between the sender and receiver integrates both the macroscopic profile and the effect of wood features. Such overlapping may lead to unreliable defect detection and classification, as well as some difficulties in profile detection.
Different solutions were tested for the RT-profile detection. One possibility to detect the RT-profile is to calculate the minima of the ToF at each single crosscut over the length of the test sample. Here, for some crosscuts, instead of the minimum of the RT-profile, the wood inhomogeneities were detected. In addition, image processing techniques and, in particular, edge detection algorithm were tested for the fibre alignment detection. Edge detection uses discontinuities in brightness to detect the boundaries of the object. Such contrast is observable at the minima of the RT-profile. However, the presence of knots and in some cases low contrast did not allow for the continuous and consistent fibre alignment identification.
The best solution was to detect the RT-profile by calculating the weighted minimum of ToF at a given point over the length of the board. The weight assured that abrupt changes in RT-profile do not occur. The minimum of RT-profile in position x is calculated using below equation:
The weights W at the length coordinate x are calculated using Eq. (5).
where \(P_{x - 1}\) position of the minimum of the RT-profile in previous x position and z-distance between the RT-profile and board edge.
The calculation procedure is performed stepwise from the beginning of the board to the end. The selected approach ensures a continuous path of the RT-profile within the board. Figure 4 shows exemplarily the minima of the detected RT-profile over the length of the board.

Minimum of the RT profile representing the fibre for the European ash (Fraxinus excelsior L.) specimen 263
The grain angle is calculated as follows:
where \(\delta\) is window size used for the calculation of the fibre angle and \(\Delta y\) is the distance between the minimum and maximum coordinates of the RT-profile over the width of the specimen (along the y-axis) between the beginning (Px) and the end of the window (Px + \(\delta )\). Window size was set to 150 mm.
3.2.3 MOE perpendicular to the grain
Modulus of elasticity perpendicular to the grain (Eus,90) was also calculated and was done based on the information on the density and the ultrasound velocity, as shown in Eq. (7):
3.3 Reference measurements
For the validation of the TUS results, the visual quality of boards was assessed by measuring size and location of knots (d > 5 mm), cracks and fibre deviation. To quantify the knottiness, the tKAR (total Knottiness Area Ratio) parameter was used. tKAR is calculated as area of knots appearing in a 150 mm large window, projected on the cross sectional area. The overlapping areas are counted once. The fibre deviation was determined on the failure pattern after the destructive test had been performed. After conditioning of the samples under the reference conditions 20 °C and 65% relative humidity, each scanned board was tested in tension parallel to the grain according to EN 408 (2010). Thus, tensile strength and stiffness were also determined. Fibre deviation is defined as an angle with the longitudinal axis of the sawn piece and is measured in % (grain angle). The angle was measured on the surface of the larger side of the board.
4 Results and discussion
Ultrasound transversal to the grain scan allows the detection of characteristics relevant for the strength of hardwoods. As already mentioned, knots and global fibre deviation can be detected and extracted from the ultrasound scan images. The results and some pre-processing steps are illustrated in Fig. 5 for ash specimen. Knots can be visualized in ultrasound scan images. Furthermore, the global fibre deviation can be observed and detected. The visibility of the fibre deviation is referred to the differences in the ultrasound wave propagation in radial and tangential direction. The knot detection does not always work smoothly.

Ultrasound scan of the European ash (Fraxinus excelsior L.) specimen no. 263 with a original ToF image; b ToF image with extracted RT-profile; c segmented objects in image; d knottiness profile; e reference image
4.1 Knottiness
The knottiness from the ultrasound image shows a high correlation to the visually measured knottiness (r = 0.791, Table 2). The scatter shows a positive relationship between KAR values from TUS measurement and tKAR for which a clear trend line can be registered (Fig. 6). It also appears that for one specimen the knottiness was detected, although no knots were visually observable within the specimen. By studying the test specimen carefully, pith was detected on the surface of the board with a groove that has led to an increase in time-of-flight value because of the missing contact between the surface and transducer. Applying classification routine would allow to avoid such misclassification and/or to classify such features separately. The selected approach would allow applying the classification to the detected object and not to the single measurement. This spatial information would allow for increasing the accuracy.

Scatter plot between knottiness parameter KARus estimated from the ultrasound scan and the manually measured knottiness tKAR
The relationship between the knottiness parameters and tensile strength is shown in Fig. 7. For both TUS knottiness and manually measured knottiness tKAR, the tensile strength decreases with an increase in knottiness values. The prediction accuracy is in both cases high (R2 > 0.5). TUS knottiness shows significantly higher R2 values compared to the tKAR. The residuals scatter less around the regression line in case of the TUS knottiness compared to the visually determined knottiness. The results should be taken indicative only, as only a limited number of specimens were scanned.

Relationship between a knottiness measured using ultrasound device and tensile strength and b manually measured knottiness (tKAR) and tensile strength for European ash (Fraxinus excelsior L.) and maple (Acer spp.)
4.2 Global fibre deviation detection
Fibre deviation is an important grading parameter for hardwoods. As previously shown, the ultrasound is able to detect the minimum of the so-called RT-profile that indicates the alignment of fibres in the board. The ultrasound wave propagates in radial direction faster than in tangential direction. Figure 8 shows the relationship between fibre deviation measured using ultrasound and the fibre deviation detected manually by observing the failure pattern. The relationship is linear between the two measurement methods. For most of the specimens, the fibre angle ranged between 3 and 10%. For two boards greater fibre deviation was indicated using both methods. The small sample allows only indicative conclusions. The difference between the two measurements arises from the nature of the measurement. In case of ultrasound, the fibre angel measurement is an integral over the depth of the board.

Relationship between grain angle determined from the ultrasound image and the grain angle after the failure
Relationship between fibre angle and tensile strength is similar for both measurements. A clear decrease in tensile strength for increasing fibre angle can be observed (Fig. 9). However, there is no significant correlation between the fibre angle (measured using TUS device and measured manually on the failure pattern) and strength (Table 2). For fibre deviations of 10% and lower, the residuals scatter largely around the regression line. In case of low fibre angles, other criteria, such as knots or local fibre deviations limit the mechanical properties. Local aberrations of fibres are not detected using ultrasound, as the detection is based on the RT-profile. In case of local fibre deviation, other methods, such as thermal conductivity measurement, might be more attractive.

Relationship between a grain angle measured using ultrasound device and tensile strength and b manually measured grain angle after failure and tensile strength for European ash (Fraxinus excelsior L.) and maple (Acer spp.)
4.3 Modulus of elasticity perpendicular to the grain
The relationship between ultrasound MOE perpendicular to the grain and tensile MOE longitudinal to the grain was observed on the small (ash and maple) and on the large dataset (maple only). For a small sample scanned over the free length of the board in tension test, no relationship between MOEdyn perpendicular to the grain and mechanical properties (strength, stiffness) could be found. For the larger data set, measured with the coarse grid, the ultrasound parameters—ultrasonic MOE perpendicular to the grain (Eus,90)/the velocity of ultrasound wave (vus)—show low to medium correlation to the tensile strength (Table 3). The maximum value shows the best correlation to tensile strength. Density improves the correlation of ultrasound velocity only slightly. Between Eus,90,max and E0 (Fig. 10), no correlation can be found. The negative correlation and especially higher correlation of max. value of ultrasound velocity/ ultrasound MOE perpendicular to the grain can be explained as the values rather represent the local defects. The max. value of ultrasound velocity coincides with the presence of knots (if any are present in a board), as the velocity in sound knots is greater compared to the clear wood.

Relationship between the ultrasound MOE perpendicular to the grain and E0 for maple (Acer spp.) specimens (N = 63)
5 Conclusion
The current study examined the opportunities of ultrasound for defect detection in the hardwood species ash and maple. Ultrasound is able to detect the strength-reducing characteristics, fibre deviation, the knot position and its size. In particular, the knottiness parameter shows high compliance with the manually measured knottiness. High correlation between knottiness and strength values could also be achieved. Fibre deviation is an important parameter, especially for the knot-free hardwood specimens. For a sample with knot and knot-free specimens tested in the current study, no correlation between global fibre deviation (visually determined and using ultrasound) and strength could be found as presented in Frühwald and Schickhofer (2005). MOE perpendicular to the grain shows no relationship to the tensile MOE properties parallel to the grain. Because of the small sample sizes in this study, further tests on larger samples are required. Further investigations are necessary, not only regarding the different wood species but also regarding the technical aspects of meeting industrial requirements.
References
Bacher M (2008) Comparison of different machine strength grading principles. In: Proceedings of COST E53 conference, Delft, The Netherlands, 29–30 October, pp 183–193
Blass HJ, Denzler, JK, Frese M, Glos P, Linsenmann P (2005) Biege-festigkeit von Brettschichtholz aus Buche (Bending strength of beech glulam). Karlsruhe: Univ.-Verl. (Karlsruher Berichte zum Ingenieurholzbau, Bd. 1)
Bucur V (2006) Acoustics of wood. Springer Series in Wood Science, 2nd edn. Springer, Berlin
Daval V, Pot G, Belkacemi M, Meriaudeau F, Collet R (2015) Automatic measurement of wood fiber orientation and knot detection using an optical system based on heating conduction. Opt Express 23(26):33529–33539. https://doi.org/10.1364/OE.23.033529
Ehrhart T, Fink G, Steiger R, Frangi A (2016a) Strength grading of European beech lamellas for the production of GLT & CLT. Paper 49-5-1. In: Proceedings of the 49th INTER & CIB meeting, Graz, Austria
Ehrhart T, Fink G, Steiger R, Frangi A (2016b) Experimental investigation of tensile strength and stiffness indicators regarding European beech timber. In: Proceedings of the world conference on timber engineering 2016 (WCTE 2016), Vienna, Austria, 22–25 August
Ehrhart T, Steiger R, Frangi A (2018) A non-contact method for the determination of fibre direction of European beech wood (Fagus sylvatica L.). Eur J Wood Prod 76(3):925–935. https://doi.org/10.1007/s00107-017-1279-3
EN 408 (2010) Timber structures: structural timber and glued laminated timber—determination of some physical and mechanical properties. CEN European Committee for Standardization, Brussels
Frühwald K, Schickhofer G (2005) Strength grading of hardwoods. In: Proceedings of the 14th international symposium on nondestructive testing of wood, Hannover, Germany, 2–4 May, pp 198–210
Giudiceandrea F (2005) Stress grading lumber by a combination of vibration stress waves and Xray scanning. In: 11th international conference on scanning technology and process optimization in the wood industry (ScanTech 2005), Wood Machining Institute, Walnut Creek, California, pp 99–108
Kabir MF, Schmoldt DL, Schafer ME (2002) Time domain ultrasonic signal characterization for defects in thin unsurfaced hardwood lumber. Wood Fiber Sci 34(1):165–182
Kabir MF, Schmoldt DL, Araman PA, Schafer ME, Lee S-M (2003) Classifying defects in pallet stringers by ultrasonic scanning. Wood Fiber Sci 35(3):341–350
Kovryga A, Schlotzhauer P, Stapel P, Militz H, van de Kuilen J-WG (2019) Visual and machine strength grading of European ash and maple for glulam application. Holzforschung. https://doi.org/10.1515/hf-2018-0142
Machado J, Sardinha R, Cruz H (2004) Feasibility of automatic detection of knots in maritime pine timber by acousto-ultrasonic scanning. Wood Sci Technol. https://doi.org/10.1007/s00226-004-0224-x
Nocetti M, Brunetti M, Bacher M (2016) Efficiency of the machine grading of chestnut structural timber: prediction of strength classes by dry and wet measurements. Mater Struct 49(11):4439–4450. https://doi.org/10.1617/s11527-016-0799-3
Olsson A, Oscarsson J, Serrano E, Källsner B, Johansson M, Enquist B (2013) Prediction of timber bending strength and in-member cross-sectional stiffness variation on the basis of local wood fibre orientation. Eur J Wood Prod 71(3):319–333. https://doi.org/10.1007/s00107-013-0684-5
Olsson A, Pot G, Viguier J, Faydi Y, Oscarsson J (2018) Performance of strength grading methods based on fibre orientation and axial resonance frequency applied to Norway spruce (Picea abies L.), Douglas fir (Pseudotsuga menziesii (Mirb.) Franco.) and European oak (Quercus petraea (Matt.) Liebl/Quercus robur L.). Ann For Sci 75(4):33529. https://doi.org/10.1007/s13595-018-0781-z
Ravenshorst GJP (2015) Species independent strength grading of structural timber. Technische Universiteit Delft, Delft
Sandoz JL (1989) Grading of construction timeber by ultrasound. Wood Sci Technol 23(1):95–108. https://doi.org/10.1007/BF00350611
Schlotzhauer P, Wilhelms F, Lux C, Bollmus S (2018) Comparison of three systems for automatic grain angle determination on European hardwood for construction use. Eur J Wood Prod 40:118. https://doi.org/10.1007/s00107-018-1286-z
Yaitskova N, van de Kuilen JW (2014) Time-of-flight modeling of transversal ultrasonic scan of wood. J Acoust Soc Am 135(6):3409–3415. https://doi.org/10.1121/1.4873519
Yaitskova N, Nadkernychnyy Y, Franjga R, Monroy Gonzalez Plata R (2015) TUS: a breadboard for development of new wood grading algorithms using ultrasound. https://www.researchgate.net/publication/272664728_TUS_a_breadboard_for_development_of_new_wood_grading_algorithms_using_ultrasound
Acknowledgements
Open Access funding provided by Projekt DEAL. This research was supported by the German Federal Ministry of Food and Agriculture (BMEL), Grant no.: 22011913.
Author information
Authors and Affiliations
Corresponding author
Additional information
Publisher's Note
Springer Nature remains neutral with regard to jurisdictional claims in published maps and institutional affiliations.
Rights and permissions
Open Access This article is licensed under a Creative Commons Attribution 4.0 International License, which permits use, sharing, adaptation, distribution and reproduction in any medium or format, as long as you give appropriate credit to the original author(s) and the source, provide a link to the Creative Commons licence, and indicate if changes were made. The images or other third party material in this article are included in the article's Creative Commons licence, unless indicated otherwise in a credit line to the material. If material is not included in the article's Creative Commons licence and your intended use is not permitted by statutory regulation or exceeds the permitted use, you will need to obtain permission directly from the copyright holder. To view a copy of this licence, visit http://creativecommons.org/licenses/by/4.0/.
About this article

Cite this article
Kovryga, A., Khaloian Sarnaghi, A. & van de Kuilen, J.W.G. Strength grading of hardwoods using transversal ultrasound. Eur. J. Wood Prod. 78, 951–960 (2020). https://doi.org/10.1007/s00107-020-01573-2
Received:
Published:
Issue Date:
DOI: https://doi.org/10.1007/s00107-020-01573-2