
Abstract
Thirty-three compounds belonging to the sympatholytics and sympathomimetics were analyzed during the study. The biological activity data for the parameters of binding affinity to the α1- and α2-adrenergic receptors together with parameters of the logarithm of the partition coefficient n-octanol/water (log P) were performed using a semi-empirical calculations methods for isolated molecules (in vacuo) and for the molecules placed in an aqueous environment. Additionally, the chromatographic retention data were used as extra dependent variables of the structural parameters for a part of the considered compounds. Finally, all those groups of parameters were analyzed using MLR, PCA, and FA methods for the classification of studied compounds according to their chemical structures and pharmacological activity to the adrenoceptors.
Introduction
Stimulants of α1- and α2-adrenergic receptors belong to the sympathomimetics stimulating sympathetic autonomic nervous system. Depending on the receptor that is stimulated, various physiological effects such as contractions of vascular smooth muscle, spasm of sphincter, mydriasis, etc. are observed (Schmitz et al., 1981; Robinson and Hudson, 1998; Fitzpatrick et al., 2004).
Sympathomimetic natural neurotransmitter, noradrenaline, resulting from the amino acid—tyrosine. Because noradrenaline is an unstable compound (which is prone to oxidation) and further is pointless cause all of the physiological effects for which noradrenaline is responsible. Man has developed a number of synthetic stimulants which have a selective effect with respect to the physiological receptor α1 and α2, in particular postsynaptic. On the other hand, the agents that block α1 and α2-adrenergic receptors (selectively or not) belong to the sympatholytics (adrenolytics), i.e., agents inhibiting the sympathetic nervous system: imidazoline derivatives (phentolamine, tolazoline) block both types of α receptors, derivatives of piperazinchinazolin (prazosin, doxazosin, terazosin) block selectively α1 receptors, ergot alkaloids block predominantly α2 receptors, and yohimbine blocks selectively α2 receptors. Blocking agents of α-adrenergic receptors are most commonly used as cardiovascular drugs: α1-blockers as antihypertensive drugs, α2-blockers as hypertensive ones; ergot alkaloids have a contractive effect on the uterus, but their hydrogenated derivatives are devoid of this activity, improving peripheral blood. Non-specific α-blockers accelerate the heart rate, dilate peripheral vessels, increasing the contractility of intestines and secretory activity of gastric mucosal (Schmitz et al., 1981; Robinson and Hudson, 1998; Fitzpatrick et al., 2004).
Over time, agonists and antagonists of adrenoceptors have become the subject of a number of works in the field of molecular modeling, lipophilicity, and structure–activity as well as 3D QSAR (Eric et al., 2004; Balogh et al., 2007, 2009; Nikolic et al., 2008; Zhao et al., 2011; Yadav et al., 2013).
Timmermans and co-workers have published interesting series of papers about agonists and antagonists of adrenoceptors in order to characterization and classification of selected molecules (Timmermans et al., 1981, 1984; Timmermans and Van Zwieten, 1982). In one of these papers (Timmermans et al., 1984), the authors have considered hypotensive and hypertensive activity relationships of α-adrenomimetics and experimentally determined logarithm of the n-octanol/water partition coefficient, log P, and also experimentally determined binding affinity to α1 and α2 receptors. Obtained by the authors, relationships according to the activity and logarithm of the partition coefficient were unsatisfactory. More preferably shown themselves to be the relationships in term of binding affinity (R > 0.9). For α-adrenolytics, authors presented relationships according to indexes of α1/α2 adrenoceptor antagonist selectivity in vivo and indexes of α1/α2 adrenoceptor antagonist of pre and postsynaptic selectivity in vivo considering selectivity indexes of binding of α1/α2 adrenoreceptor to the corresponding ones (R > 0.9).
The objective of the presented study was to analyze the biological activity data (Timmermans et al., 1984), the parameters of binding affinity to the α1 and α2 receptors together with parameters of the logarithm of the partition coefficient n-octanol/water (log P) using semi-empirical calculations methods (Bączek, 2006; Bodzioch et al., 2010) for isolated molecules (in vacuo) and the for the molecules placed in an aqueous environment. In addition, for a part of the consideration, compounds were available chromatographic retention data (Nasal et al., 1997), which were used as the dependent variables of the structural parameters.
The aim of this study was to demonstrate the characteristics of both common and differentiating the analyzed compounds in terms of physicochemical and pharmacological effects.
Experimental procedure
Molecules
The following compounds were selected for testing according to reference (Timmermans et al., 1984):
-
α-adrenergic antagonists (AN): prazosin, phentolamine, dihydroergotamine, clozapine, corynanthine, azapetine, yohimbine, piperoxan, tolazoline, mianserin, rauwolscine;
-
α-adrenergic agonists (AG): lofexidine, clonidine, naphazoline, tiamenidine, xylazine, tramazoline, xylometazoline, tetryzoline, methoxamine, phenylephrine, amidephrine, cirazoline, guanabenz, oxymetazoline, and eight compounds of an experimental structures, marked as symbols: DPI, Sgd 101/75, DP-5-ADTN, DP-7-ADTN, DP-5,6-ADTN, DP-6,7-ADTN, St 587, and M-7 (Fig. 1).
Fig. 1 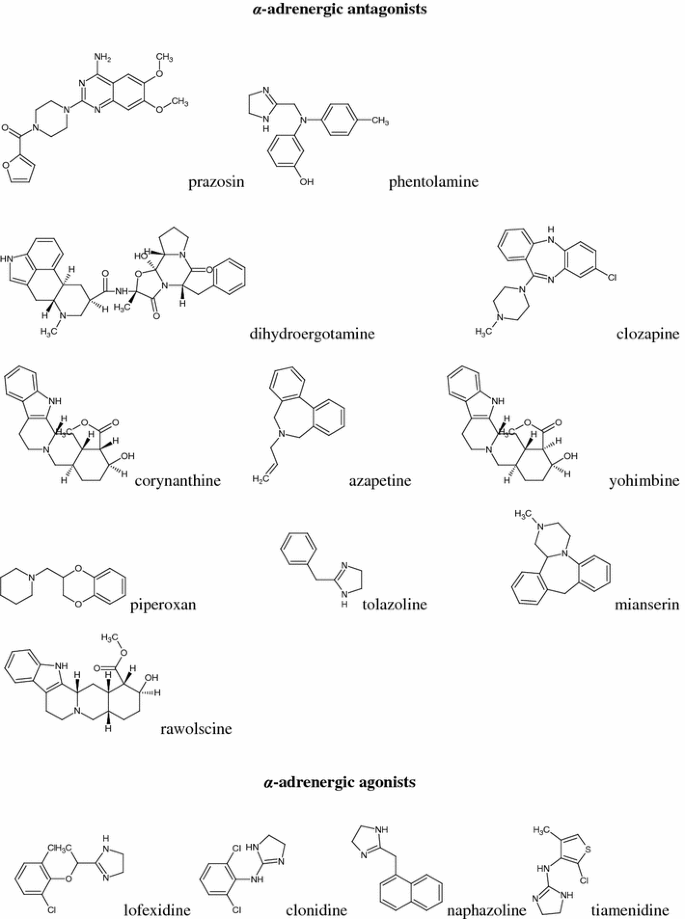

Structural formulas of compounds studied


Biological activity data
The study used the literature-quoted data of biological activity (Timmermans et al., 1984), are presented in Table 1S. The activity of α-adrenergic agonists—antihypertensive activity was derived from the stimulation of central α2-adrenoceptors, pC25. The authors expressed data for pC25 in μmol/kg. The values of pC25 were available for lofexidine, clonidine, naphazoline, tiamenidine, xylazine, tramazoline, xylometazoline, and tetryzoline.
For the α-adrenergic, antagonists were used:
-
antagonistic activity against phenylephrine induced via α1-adrenoceptors vasoconstriction in rats, pA2 post (α1)—in vivo,
-
antagonistic activity of phenylephrine- or norepinephrine-induced stenosis of isolated rabbit pulmonary artery through α1-adrenereceptors post, pA2 post (α1)—in vitro.
Activities expressed as pA2 were derived from the equation (Timmermans et al., 1984):
Chromatographic and lipophilicity data
The values of the logarithm of partition coefficient, log P, were derived from the paper by Timmermans et al. (1984), and they are refer to compounds: lofexidine, clonidine, naphazoline, tiamenidine, xylazine, tramazoline, xylometazoline, tetryzoline, cirazoline, St-587, and oxymetazoline (Table 2S).
Chromatographic data were derived from the article by Nasal et al. (1997), and they are refer to compounds: lofexidine, clonidine, naphazoline, tiamenidine, xylometazoline, tetryzoline, cirazoline, oxymetazoline, prazosin, phentolamine, and tolazoline (Table 2S). These are the values of the logarithms of retention factors determined on Chiral AGP (log k AGP), immobilized artificial membranes IAM.PC.MG (log K IAM) and also the logarithm values of lipophilicity coefficients determined by the policratic method on Suplex pKb-100, pH 7.4 (log k w7.4Su), Spheri RP-18, pH 2.5 (log k w2.5Sp), and Aluspher RP select B, pH 7.3 (log k w7.3Al).
Molecular descriptors
The non-empirical structural indicators, i.e., quantum-chemical indicators, were calculated in the study. The PCM (Polarizable Continuum Model) method (Tomasi and Persico, 1994; Tomasi et al., 2005; Caricato and Scalmani, 2011) would be prefer in the ab initio calculations for the all tested compounds as we previously presented (Bober et al., 2012a, b), but the size of some analyzed molecules (e.g., alkaloids of α-adrenergic antagonists with the number of atoms above 50) complicated or even prevented the use of ab initio methods under these consideration on a standard class PC. The only choice was to use a semi-empirical method for the whole group of analyzed compounds by placing one by one molecule in the environment of water molecules. The structure of the tested compounds was studied by molecular modeling using HyperChem Release 8.0 (Hypercube Inc., Gainesville, FL, USA) software. The geometry of the molecule was initially optimized by molecular mechanics MM+ and then using the semiempirical method RM1 (HyperChem® Computational Chemistry, 1996). After completing the optimization a single point calculation was performed. The molecule was placed in a periodic box, which dimensions was selected in such a way that program has placed within around 40 water molecules, and the optimization of the geometry was repeated in an environment of water molecules by RM1. Among the quantum-chemical indices were considered: total energy (TE), binding energy (BE), electron energy (EE), heat of formation (HF) energy, highest occupied molecular orbital (E_HOMO), the energy of the lowest unoccupied molecular orbital (E_LUMO), and the difference between HOMO and LUMO energy defined as the energy gap (EG). Moreover, the following values were used: the largest positive charge on the electron atoms (MAX_POS), the largest negative charge on the electron atoms (MAX_NEG), the difference between the largest positive and negative charge (DELTA_Q), the total dipole moment (TDM), the mean polarizability (MPOL), and energy values for the most long-term transition of electron EL (for which a power oscillator >0). Values of TE expressed in atomic energy units a.u. or Hartree (1 Hartree = 2625.552 kJ mol−1, or 627.552 kcal mol−1 or 27.2116 eV), energies of HOMO, LUMO, and gap energy expressed in eV (counted above values of a.u. to eV), electron spatial extent in eBohr−3 (Bohr = 0.5292 × 10⁻¹⁰ m = 0.5292 Å). The values of electron density and electron charges on the atoms are in units of elementary charge (\({e^-}\)), the dipole moment is expressed in Debye (D), and the average polarizability in Bohr−3 (Bohr = 0.5292 × 10⁻¹⁰ m = 0.5292 Å). Using QSAR module (QSAR Properties Module) of HyperChem 8.0 other non-empirical parameters were calculated—parameter values dependent on the geometry of the molecule: the surface of the molecule accessible to the solvent (SA), expressed in Å2, the volume of the particle (V) in Å3, and the hydration energy (HE), in kcal mol−1 for both type of structures optimized by RM1 in vacuo and in the surrounding water molecules.
However, the smaller size structure of α-adrenergic agonists was additionally studied using the molecular modeling software Gaussian 03 W (v03, Gaussian Inc., Wallingford, CT, USA). The geometry of the molecules was optimized using Hartree–Fock restricted 6-31G (d, p) also known as 6-31G** (http://www.gaussian.com/). The quantum-chemical indices considered from that calculations were as follows: electronic spatial extent (ESE)—defined as the area including the volume around the particles beyond which the electron density is less than 0.001 eBohr−3 describing the sensitivity of the molecule to the electric field, TE, EHOMO, ELUMO, EG, MAX_POS, MAX_NEG, DELTA_Q, TDM, and finally the isotropic polarizability (IPOL) expressed in eBohr−3.
Statistical analysis
The retention data and the data of biological activity of the compounds studied were related to their structural indicators under stepwise, progressive, and multiparametric regression analysis (multiple regression) and calculated with the use of Statistica 10 (v10, StatSoft, Tulsa, OK, USA, 2011) installed on a personal computer. As a preliminary principal component analysis (PCA) and factor analysis (FA) were performed to make the initial classification of compounds under the consideration.
Results and discussion
The numerical values of 16 structural parameters derived from the quantum-chemical calculations in vacuo for all 33 considered compounds are shown in Table 3S and derived from the quantum-chemical calculations in the aquatic environment for all 33 considered compounds are presented in Table 4S. The numerical values of the 10 structural parameters derived from quantum-chemical calculations in vacuo for 22 considered compounds (α-adrenergic agonists) obtained by the PCM (Polarizable Continuum Model) method are shown in Table 5S.
After the PCA and FA for a set of in vacuo calculations found that the greatest impact on the first factor had the mean polarizability (MPOL) and the molecular volume of the particle (V), followed by particle surface area (SA), EE, BE, and finally TE and HF. Additionally, it was confirmed by cross-validation method that the above-mentioned three types of energy (TE, BE, EE) are correlated. The second factor was clearly influenced by the difference between the largest positive and negative charge (ΔQ), the largest positive charge on the atom (MAX_POS) and the largest negative charge on the atom (MAX_NEG), followed by the energy of the lowest unoccupied molecular orbital (E_LUMO).
Comparing Figs. 2 and 3 from PCA and FA analyses, it can be seen that between the graphs of the distribution of points corresponding to individual cases relative to each other is very similar, if not identical. It is possible to extract two sets (clusters), including single points for α-adrenoceptor agonists (numbers of compounds 1–22)—II and α-adrenoceptor antagonists (23–33)—I. Furthermore, some of the antagonists: azapetine (28), piperoxane (30), tolazoline (31), and mianserine (32) are compounds having a non-specific effects on α-receptors, so it is possible that they may be partially mixed with a set of agonists, in presented work, they were marked with circle on Figs. 2, 3, 4, and 5 and pointed to the cluster with other antagonists.

Three-dimensional scatter plots of the loadings of the first three factors (PC1—42,74 %, PC2—24,47 %, PC3—12,16 %) obtained by PCA of structural parameters derived from the quantum-chemical calculations in vacuo for all 33 considered compounds; where: I—α-adrenergic antagonists (AN) and II—α-adrenergic agonists (AG)

Two-dimensional scatter plots of the loadings of the first two factors (FA1—42,74 %, FA2—24,47 %) obtained by FA of structural parameters derived from the quantum-chemical calculations in vacuo for all 33 considered compounds; where I—α-adrenergic antagonists (AN) and II—α-adrenergic agonists (AG)

Three-dimensional scatter plots of the loadings of the first three factors (PC1—42,59 %, PC2—25,49 %, PC3—10,90 %) obtained by PCA of structural parameters derived from the quantum-chemical calculations in the aquatic environment for all 33 considered compounds; where I—α-adrenergic antagonists (AN) and II—α-adrenergic agonists (AG)

Two-dimensional scatter plots of the loadings of the first two factors (FA1—42,59 %, FA2—25,49 %) obtained by FA of structural parameters derived from the quantum-chemical calculations in the aquatic environment for all 33 considered compounds; where I—α-adrenergic antagonists (AN) and II—α-adrenergic agonists (AG)
In the next step, PCA and FA were performed for the same set of calculation in an aqueous medium. Comparing the obtained results, it was noted that the application of structural parameters calculated in terms of hydration has made no noticeable changes. Points corresponding to both variables and statistical cases were slightly shifted, however, the distribution of points unchanged and it was similar to the one presented in the discussion for the analysis of molecules calculated in vacuo (Figs. 4, 5).
It is difficult to determine whether the model based on the placing of the molecule in the present periodic box surrounded by water molecules with the creation of hydrogen bonds and the geometry optimization of the model is worse or better than the PCM, which consists in placing the particles presented in the environment, such as the dielectric constant of the solvent. On the other hand, using PCM model additional parameters are calculated characterizing the system, but also very important is a total number of cases that can be clearly presented.
The log k, chromatographic relationships for the structures of α-adrenergic agonists and some antagonists optimized in vacuo and in the aquatic environment as the results of muliregression analysis are presented in Table 1. For the structures of α-adrenergic agonists optimized in vacuo with the PCM method is presented in Table 2, and finally the activity relationships for the structures of α-adrenergic agonists and antagonists optimized in vacuo and in aquatic environment are presented in Table 3.
According on the chromatographic relationships for the structures of α-adrenergic agonists and some antagonists optimized in vacuo, they are characterized by the values of the regression coefficients R > 0.9. Relatively strong dependencies were obtained also for the columns serving as a models of biological systems (IAM, AGP), R ~ 0.94 and ~0.9, respectively. Among the analyzed independent variables the most frequent appears BE and as the further parameter TE for the Spheri column, R ~ 0.96. Additionally, for the AGP, molecular volume (V) appears in column.
Between the chromatographic relationships for the structures of α-adrenergic agonists and some antagonists optimized in aquatic environment, similar dependencies were observed. Furthermore, for the Suplex column, a second parameter appears the TDM with R ~ 0.98.
On the other hand, analyzing the relationships for the structures of only α-adrenergic agonists, n = 8, optimized in vacuo by PCM method in all cases the values of the regression coefficients R > 0.93 with only one independent variable. The most frequent parameter appeared isotropic polarizability (IPOL), R ~ 0.94 for the IAM column and R ~ 0.95 for the Spheri column. However, for the Suplex and Aluspher columns appeared electronic spatial extent (ESE), with R ~ 0.97 and ~0.93, respectively.
Analyzing the dependencies of α-adrenergic agonists and log P two independent variables appeared only as a statistically significant parameters in vacuo: MAX_NEG and TDM, with the regression coefficient, R ~ 0.9, that could demonstrate the importance of bulkiness type parameters and associated dispersion interactions, to a lesser extent polar parameters.
For the antihypertensive activity of agonists (pC25) and a relatively not too large number of cases (n = 8), relationship with only one the independent variable—the lowest energy unoccupied molecular orbital (E_LUMO) with a regression coefficient value R ~ 0.87 in vacuo and R ~ 0.88 in the case of hydrated structures—was obtained.
For the biological activity of antagonists (n = 11), statistically significant dependencies of pA2 (α1) in vivo and in vitro activity for the both hydrated and non-hydrated molecules were obtained. In the case of in vacuo structures with pA2 (α1)in vivo as the first parameter appears HE and as the second the lowest energy unoccupied molecular orbital (E_LUMO), with R ~ 0.89, while with pA2 (α1)in vitro there is a the inverse order of the same parameters also with R ~ 0.89. On the other hand, In the case of hydrated structures with pA2 (α1)in vivo as the first parameter appears again HE and as the second the lowest energy unoccupied molecular orbital (E_LUMO), with R ~ 0.90, whereas with pA2 (α1)in vitro there is an inverse order of the same parameters also with R ~ 0.89, whereas as the first parameter appears the lowest energy unoccupied molecular orbital (E_LUMO) and as the second the HF, with R ~ 0.90.
It can be concluded that for the parameters of the binding affinity of the receptor, a major role is played by E_LUMO energy orbitals, which may indicate the nature of the interactions between the drug molecule and receptor.
It seems that the regression is mostly affected by the type of the dependent variable, and in fact the complexity of the phenomena affecting the measured value of this variable, as well as the uncertainty of measurement of the variable. The dependent variables—physicochemical parameters (such as chromatographic retention factors and hydrophobicity coefficients) probably have a smaller number of phenomena which influence its value than the biological parameters, and the uncertainty of their measurement seems to be smaller. The parameters characterizing the biological activity (authors assigned them in living organisms or living tissues) are more complex nature than the phenomenon of chromatographic retention processes, so often they may possess not so preferred statistical characteristics (i.e., accuracy and precision), which all results in a lower value of R.
Concluding remarks
Based on the above discussion the following conclusions can be drawn.
Out of the considered 16 molecular parameters (quantum-chemical and QSAR), the greatest impact on the spatial distribution (and classification) have the average polarizability and molecular volume, followed by particle surface area and three type of energies electron, binding and total. On the other hand, it appears with smallest impact: the difference between the largest positive and negative charge, the largest positive charge on the atom, and the largest negative charge on the atom.
The greatest impact on the values of chromatographic retention has BE and sometimes TE or TDM; instead of PCM method it informs us about equally important influence of isotropic polarizability and electronic spatial extent.
Between the relationships together with the chromatographic parameters appear high values of the regression coefficient (R > 0.95), sometimes even with one independent variable—BE, which assumes the existence of dependency of a function type.
Not found, the significant effect of hydration (the calculation method for the structure of hydrated “periodic box”) for the statistical analysis (PCA, FA and MLR) in comparison to the results of the analysis for the structure optimized in vacuo.
Analyzing the relationships resulting from the correlation with parameters of biological activity, the most frequent dependence is that with the value of lowest energy unoccupied molecular orbital probably playing a crucial role as a result of the agonistic and antagonistic activity on the α-adrenergic receptors. It seems to converge with the results on similar structures and effect on adrenoceptors (Eric et al., 2004; Nikolic et al., 2008) suggesting the meaning of HOMO energy orbitals. The importance of LUMO and HOMO energy orbitals for analyzed parameters characterizing the biological activity to α1 and α2 receptors indicates the importance of the electron-donor–acceptor interaction within the drug–receptor interactions.
References
Bączek T (2006) Chemometric evaluation of relationships between retention and physicochemical parameters in terms of multidimensional liquid chromatography of peptides. J Sep Sci 29:547–554
Balogh B, Jojart B, Wagner Z, Kovacs P, Mate G, Gyires K, Zadori Z, Falkay G, Marki A, Viskolcz B (2007) 3D QSAR models for α2a-adrenoceptor agonists. Neurochem Int 51:268–276
Balogh B, Szilagyi A, Gyires K, Bylund DB, Matyus P (2009) Molecular modelling of subtypes (α2A, α2B and α2C) of α2-adrenoceptors: a comparative study. Neurochem Int 55:355–361
Bober L, Kawczak P, Bączek T (2012a) Pharmacological classification and activity evaluation of furan and thiophene amide derivatives applying semi-empirical ab initio molecular modeling methods. Int J Mol Sci 13:6665–6678
Bober L, Kawczak P, Bączek T (2012b) QSAR analysis of compounds exhibiting general anesthetics’ properties. Lett Drug Des Discov 9:595–603
Bodzioch K, Durand A, Kaliszan R, Bączek T, Vander Heyden Y (2010) Advanced QSRR modeling of peptides behavior in RPLC. Talanta 81:1711–1718
Caricato M, Scalmani G (2011) On the importance of the orbital relaxation in ground-state coupled cluster calculations in solution with the polarizable continuum model of salvation. J Chem Theory Comput 7:4012–4018
Eric S, Solmajer T, Zupan J, Novic M, Oblak M, Agbaba D (2004) Quantitative structure–activity relationships of α1 adrenergic antagonists. J Mol Model 10:139–150
Fitzpatrick D, Purves D, Augustine G (2004) Neuroscience, 3rd edn. Sunderland, Massachusetts
HyperChem® Computational Chemistry (1996) Part 1: Practical guide. Part 2: Theory and methods. Hypercube Inc., Waterloo
Nasal A, Buciński A, Bober L, Kaliszan R (1997) Prediction of pharmacological classification by means of chromatographic parameters processed by principal component analysis. Int J Pharm 159:43–55
Nikolic K, Filipic S, Agbaba D (2008) QSAR study of imidazoline antihypertensive drugs. Bioorg Med Chem 16:7134–7140
Official Gaussian Website. http://www.gaussian.com/. Accessed 1 April 2014
Robinson E, Hudson A (1998) Adrenoceptor pharmacology. Tocris Rev 8:1–6
Schmitz JM, Graham RM, Sagalowsky A, Pettinger WA (1981) Renal α1 and α2-adrenergic receptors: biochemical and pharmacological correlations. J Pharmacol Exp Ther 219:400–406
Timmermans PBMWM, Van Zwieten PA (1982) a 2 -Adrenoceptors: classification, localization, mechanisms, and targets for drugs. J Med Chem 25:1389–1401
Timmermans PBMWMA, De Jonge A, Van Meel JCA, Slothorst-Grisdijk FP, Lam E, Van Zwieten PA (1981) Characterization of α-adrenoceptor populations. Quantitative relationships between cardiovascular effects initiated at central and peripheral α-adrenoceptors. J Med Chem 24:502–507
Timmermans PBMWMA, De Jonge A, Thoolen MJMC, Wilffert B, Batink H, Van Zwieten PA (1984) Quantitative relationships between α-adrenergic activity and binding affinity of α-adrenoceptor agonists and antagonists. J Med Chem 27:495–503
Tomasi J, Persico M (1994) Molecular interactions in solution: an overview of methods based on continuous distributions of the solvent. Chem Rev 94:2027–2094
Tomasi J, Mennucci B, Cammi R (2005) Quantum mechanical continuum solvation models. Chem Rev 105:2999–3093
Yadav M, Joshi S, Nayarisseri A, Jain A, Hussain A, Dubey T (2013) Global QSAR modeling of logP values of phenethylamines acting as adrenergic alpha-1 receptor agonists. Interdiscip Sci Comput Life Sci 5:150–154
Zhao X, Chen M, Huang B, Ji H, Yuan M (2011) Comparative molecular field analysis (CoMFA) and comparative molecular similarity indices analysis (CoMSIA) studies on α1A-adrenergic receptor antagonists based on pharmacophore molecular alignment. Int J Mol Sci 12:7022–7037
Conflict of interest
The authors confirm that this article content has no conflicts of interest.
Author information
Authors and Affiliations
Corresponding author
Electronic supplementary material
Below is the link to the electronic supplementary material.
Rights and permissions
Open Access This article is distributed under the terms of the Creative Commons Attribution License which permits any use, distribution, and reproduction in any medium, provided the original author(s) and the source are credited.
About this article

Cite this article
Kawczak, P., Bober, L. & Bączek, T. QSPR analysis of some agonists and antagonists of α-adrenergic receptors. Med Chem Res 24, 372–382 (2015). https://doi.org/10.1007/s00044-014-1130-x
Received:
Accepted:
Published:
Issue Date:
DOI: https://doi.org/10.1007/s00044-014-1130-x