
Abstract
Drug sensitivity testing utilizing preclinical disease models such as cancer cell lines is an important and widely used tool for drug development. Importantly, when combined with molecular data such as gene copy number variation or somatic coding mutations, associations between drug sensitivity and molecular data can be used to develop markers to guide patient therapies. The use of organoids as a preclinical cancer model has become possible following recent work demonstrating that organoid cultures can be derived from patient tumors with a high rate of success. A genetic analysis of colon cancer organoids found that these models encompassed the majority of the somatic variants present within the tumor from which it was derived, and capture much of the genetic diversity of colon cancer observed in patients. Importantly, the systematic sensitivity testing of organoid cultures to anticancer drugs identified clinical gene–drug interactions, suggestive of their potential as preclinical models for testing anticancer drug sensitivity. In this chapter, we describe how to perform medium/high-throughput drug sensitivity screens using 3D organoid cell cultures.
You have full access to this open access chapter, Download protocol PDF
Keywords:
1 Introduction
The research community currently has access to approximately 1000 experimentally tractable, genetically unique cancer cell lines. These cell lines have been instrumental in the advances made in cancer research and are an important tool during drug development, in part due to their ability to model patient responses to therapies. For example, cell lines were used for the preclinical development of the small-molecule EGFR inhibitor gefitinib, which is approved for the treatment of EGFR-mutated non-small-cell lung cancer [1, 2]. Drug sensitivity screening of cancer cell lines is routinely performed and large-scale datasets are publically available [3,4,5,6].
Despite their utility, there are shortcomings associated with traditional 2D cell lines which include (but are not limited to) their failure to reflect tissue/tumor architecture, a poor success rate of derivation, and a lack of associated patient pathological and clinical data. In addition, they likely reflect a subset of aggressive tumors emendable to growth in 2D culture, and fail to encompass the histological and molecular diversity of cancer [7,8,9]. These deficiencies hamper our ability to identify and successfully translate novel treatment strategies for patients into the clinic.
New cell line derivation technologies such as organoids [10, 11] and conditional reprogramming [12] have provided an opportunity to improve the set of available cancer models. Organoids are a long-term culture system which allow cells, both normal and diseased, to be grown in specialized 3D culture conditions that maintain the stem cell population, as well as much of the cell-type composition and tissue architecture found in vivo [10, 11, 13,14,15,16]. Cancer organoid cultures recapitulate features of the original tissue/tumor and can model clinically relevant drug responses [13, 14, 16]. Thus, it should be possible to more effectively develop new therapeutic modalities by performing drug sensitivity assays in a larger and more representative collection of cancer organoid cultures. In the future, it may be possible to individualize patient care through prospective modeling of drug sensitivity in patient-derived cancer organoids.
The utilization of organoid cultures derived from matched healthy tissue such as the liver could be useful in identifying drug toxicity. Additionally, organoids have been generated from diseased tissues other than cancer including cystic fibrosis and liver disorders such as α1-antitrypsin deficiency and Alagille syndrome, and shown to mimic disease pathology [15].
Here we describe a protocol for medium/high-throughput drug screening of human organoid cultures in 384-well plates. This is based on our experience of performing drug sensitivity screens using colorectal and esophageal cancer organoids. We provide details on assay design, protocols for the manipulation of organoid cultures, and parameters for evaluating assay quality.
2 Materials
2.1 Preparation of Organoid Media and BME-2
Prepare the following solutions.
-
1.
7.5 mg/mL BME-2 (Cultrex® Reduced Growth Factor Basement Membrane Extract, Type 2, PathClear® (Amsbio)): For each 384-well plate approximately 3 mL of 7.5 mg/mL BME-2 is required. An additional 10 mL should be added to the total volume to account for dispensing dead volume. BME-2 (~15 mg/mL) is diluted 1:1 using organoid media to ~7.5 mg/mL (see Note 1). Determine the number of 384-well plates required for your drug screen and ensure sufficient volumes of BME-2 are chilled overnight on ice (see Note 2).
-
2.
Organoid media: Prepare organoid media as described for esophagus [11], pancreas [13], and colon [11, 14]. We have provided details in Table 1 of the media used for colorectal and esophageal cancer organoid drug screening (see Note 3). The media can be stored for up to 4 weeks at 4 °C until required. Approximately 15 mL of organoid/media suspension is required per 384-well plate. An additional 10 mL should be added to the total volume to account for dispensing dead volume.
Table 1 Media components for colon and esophageal organoids -
3.
Drug screening media: Organoid media in point 2 is supplemented with 2 % BME-2 (~0.3 mg/mL). For each 100 mL, add 96 mL of media and 4 mL of 15 mg/mL BME-2.
2.2 Drug Screening Assay
-
1.
384-well flat clear bottom, opaque walls, tissue culture treated polystyrene plates (assay plate).
-
2.
384-well polypropylene Echo qualified plates (stock plate).
-
3.
384 low dead volume (LDV) Echo qualified cyclic olefin copolymer plate (source plate).
-
4.
Microscope slide.
-
5.
Phase contrast microscope.
-
6.
Cell scraper(s).
-
7.
Centrifuge.
-
8.
15 mL conical centrifuge tube(s).
-
9.
FluidX XRD-384 reagent dispenser, or alternative reagent dispenser with the ability to accurately dispense between 8 and 40 μL volume.
-
10.
Echo 555 acoustic dispenser (Labcyte), or similar liquid handling platform.
-
11.
CellTiter-Glo® 2.0 Luminescent Cell Viability Assay (Promega).
-
12.
Molecular Devices Paradigm plate reader fitted with a luminescence cartridge, or another luminescence plate reader.
-
13.
Drugs to be included in the assay, including positive control drugs.
3 Methods
Figure 1 provides an overview of the organoid drug screening process. We utilize liquid-handling robotics for our drug screening experiments to improve accuracy and reproducibility, and increase throughput. In this protocol we indicate the use of specific liquid-handling robotics but, with only minor modifications to these protocols, other equipment could be utilized. Similarly, with some modifications, these protocols could be performed using manual pipetting. Perform all procedures at room temperature unless otherwise specified.


A schematic of the organoid drug screen workflow. Drug preparation is shown in the upper panel and the screening workflow in the lower panel, together with associated protocol sections (italics)
3.1 Preparation of Drug Stocks and Drug Plates
-
1.
Design the layout of your drug plate (see Note 4 and Fig. 2).
Fig. 2 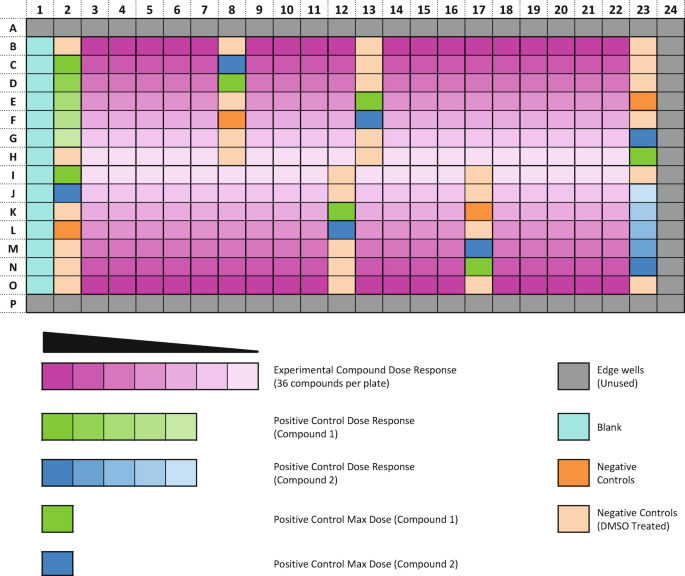
An illustration of an optimized screening plate layout. Positive and negative control wells are distributed across the plate and drug concentration curves are arranged vertically from the exterior to the interior of the plate (also see Note 4). The edge wells are not used due to edge effects
-
2.
Drugs are reconstituted in 100 % DMSO and stored frozen at −80 °C or ideally in StoragePods® (Roylan Developments) kept at room temperature, providing a moisture-free, low-oxygen environment and protection from UV damage (see Note 5).
-
3.
Master stocks of drugs are reconstituted at 1000–10,000× of the final desired maximum screening concentration.
-
4.
Following the reconstitution of the drug(s) in DMSO, the master stock drugs are cherry-picked to a 384-well polypropylene plate using a liquid-handling robot Biomek FX (Beckman Coulter). This plate is called the stock plate. If the master stock is at 1000× of the final screening concentration, a direct transfer to the stock plate can be performed. If at greater than 1000× concentration, a dilution in DMSO is performed during the transfer to the stock plate, resulting in all drugs on the stock plate being at 1000×.
-
5.
Using the stock plate we generate a source plate (384-well low dead volume (LDV) plate). The source plate contains all the drugs to be screened along with the dilution series of the drugs. Half-log dilutions are performed in DMSO and all wells are 1000× of the final desired concentration, typically containing 10 μL per well. A single source plate can be used for drugging multiple organoid screening plates and over multiple dates (see Notes 6 and 7).
-
6.
The generation of the source plate is performed using an Echo 555 acoustic dispenser.
-
7.
For storage, seal plates using adhesive plate foil seals.
-
8.
Both the stock and source drug plates can be stored in compound StoragePods® and used multiple times. If plates are stored at -80 °C we recommended you limit the number of freeze–thaw cycles.


3.2 Dispensing the Layer of BME-2 to 384-well Plates
-
1.
Program a FluidX XRD-384 reagent dispenser to dispense 8 μL. Flush the XRD-384 with ethanol, followed by sterile water and lastly organoid media.
-
2.
Prime the XRD-384 with 7.5 mg/mL BME-2 until all tubing is loaded. Once primed, dispense 8 μL of 7.5 mg/mL BME-2 media in to all wells of a 384-well flat clear bottom polypropylene plate. Ensure the BME-2 is kept chilled while dispensing.
-
3.
Centrifuge the plates at 182 × g for 1 minute to ensure the BME-2 covers the bottom of each well.
-
4.
Place the plates in a 37 °C, 5 % CO2 incubator for at least 20 min allowing the BME-2 to polymerize, forming a polymerized layer of BME-2 across the bottom of all wells (see Note 8).
3.3 Preparation of Organoid Cultures
-
1.
Organoids are routinely cultured embedded within 10–15 μL droplets of 7.5 mg/mL BME-2. We seed 15 droplets per well of a 6-well cell culture plate together with 2 mL of organoid media.
-
2.
To harvest organoids from a 6-well plate, use a cell scraper to disrupt the 7.5 mg/mL BME-2 droplets containing organoids from the bottom of the well.
-
3.
Using a 1 mL pipette, mix the disrupted organoids along with the media to initiate release of the organoids from the BME-2. This should physically disrupt the organoids but avoid breaking them down to single cells, the goal being to plate formed organoids, not single cells.
-
4.
Transfer the organoid suspension to a 15 mL centrifuge tube and centrifuge at 364 × g for 2 min.
-
5.
Aspirate the supernatant from the 15 mL falcon tube and resuspend the organoid pellet in 5 mL of drug screening media.
-
6.
As organoids are too large to be counted by an automated cell counter or a hemocytometer, dispense three 10 μL droplets of the organoid suspension on to a microscope slide and count the number of organoids in each 10 μL droplet (see Note 9). Multiply the average number of organoids per droplet by 100 to calculate the number of organoids per mL (see Note 10).
-
7.
A suspension of 15,000–20,000 organoids per mL is required for drug screening. To dispense two 384-well plates requires 35 mL of organoids prepared in drug screening media at 15,000 organoids per mL. Approximately three confluent 6-well plates are sufficient to generate the 525,000 organoids necessary.
-
8.
Program the XRD-384 to dispense 32 μL. Flush the XRD-384 as previously described in Section 3.2 with ethanol, sterile water and organoid media. Ensure the XRD-384 is primed, then dispense 32 μL of drug screening media into all wells of column 1 (media only, no organoids).
-
9.
Once completed, dispense 32 μL of the organoid suspension in to all wells with the exception of column 1 (see Note 11). This gives a total well volume of 40 μL.
-
10.
Once completed, place the plates in a 37 °C, 5 % CO2 incubator until the following day allowing the organoids to settle (see Note 12).
3.4 Drugging of Screening Plates
-
1.
Following overnight incubation, organoid plates are manually inspected using a phase-contrast microscope to check cell health prior to the addition of drugs.
-
2.
Using an Echo 555 acoustic dispenser, 40 nL of compound previously prepared at 1000× are dispensed from a source plate (described in Section 3.1) into the cell plate, to a final concentration of 1× compound and 0.1 % DMSO.
-
3.
Return plates to a 37 °C, 5 % CO2 incubator.
3.5 Cell Viability Assay
-
1.
Organoid plates can be incubated with compound/drug for up to 6 days before ending the assay. After more than 6 days, the plates are liable to be effected by evaporation and a reduction in data quality may be observed.
-
2.
Following incubation with drug, the plates are manually checked under the microscope to ensure the positive control drug(s) have effectively killed organoids, and organoids present in the negative control wells are healthy.
-
3.
To quantitate the effect of drugs on cell viability, CellTiter-Glo® 2.0 Luminescent Cell Viability Assay (Promega) can be used. CellTiter-Glo® 2.0 determines the number of viable cells in a well based on the quantification of ATP present, an indicator of metabolically viable cells. Addition of CellTiter-Glo® 2.0 leads to cell lysis and generation of a luminescent signal proportional to the amount of ATP present, and thus indirectly measures cell number.
-
4.
For each 384-well plate approximately 4 mL of CellTiter-Glo® 2.0 is required, add 10 mL to the total volume required to account for dead volume of the XRD-384.
-
5.
Prior to the addition of CellTiter-Glo® 2.0, remove plates from the incubator and allow them to equilibrate to room temperature for 10 min.
-
6.
Program the XRD-384 to dispense 10 μL. Following the flushing of the machine as described in Section 3.2, prime the machine with CellTiter-Glo®2.0 and dispense 10 μL to all wells of the 384-well plate(s) (see Note 13).
-
7.
Incubate the plates at room temperature for 20 min before reading plate luminescence using a Paradigm plate reader (Molecular Devices) (see Note 14).
3.6 Data Quality Checks and Downstream Analysis
-
1.
Quality control metrics are calculated for each plate prior to further analysis:
-
(a)
Coefficient of variation (CV): The CV of the negative control wells determines the variation in the luminescence of the negative control wells on each plate. It is calculated by dividing the standard deviation of the luminescence of the negative controls wells by their mean luminescence. For an organoid drug screen, CV values of less than 0.22 are acceptable.
-
(b)
Z-factor: The Z-factor (also known as Z-prime) is commonly used in high-throughput screens and measures the assay dynamic range and data variation using both the positive and negative controls [17]. The calculation determines if the effect observed between the positive and negative controls is large enough to make comparisons with drugs of unknown effect. The Z-factor can be calculated using each of the positive control drugs present on the drug plate (see Note 4d). Organoid plates with a Z-factor of 0.4 or greater are generally of good quality. This threshold is slightly lower than we would typically use for a cancer cell line (Z-factor >0.5) due to the increased technical complexity of screening 3D organoid cultures.
-
(c)
DMSO effect: The ratio between the negative control wells containing DMSO and those without DMSO is calculated. This is to ensure that the concentration of DMSO present in the drugged wells (0.1 % DMSO) does not have a significant effect on cell viability. A ratio of between 0.8 and 1.2 is required.
-
(a)
-
2.
Following completion of the above quality metrics, the data can be normalized or the raw intensity data can be used for curve-fitting.
-
(a)
Data normalization.
Normalization is completed using the following calculation:
$$ \kern3.8em \left(\mathrm{Raw}\ \mathrm{intensity}\ \mathrm{signal}-\mathrm{Mean}\ \mathrm{of}\ \mathrm{positive}\ \mathrm{control}\right)/\kern6em \left(\mathrm{Mean}\ \mathrm{of}\ \mathrm{negative}\ \mathrm{control}-\mathrm{Mean}\ \mathrm{positive}\ \mathrm{control}\right) $$For drugs where the concentrations selected have generated a dose–response curve, measurements such as the IC50 (half-maximal inhibitory concentrations) and AUC (area under the curve) can be calculated to assess and compare sensitivity.
-
(b)
Curve-fitting.
Commercial software packages such as GraphPad Prism and Microsoft Office Excel can also be used to analyze the data generated from the drug screen assay. Curve-fitting algorithms for modeling drug response are also available [18].
-
(a)
4 Notes
-
1.
Basement membranes are specialized extracellular matrixes in tissues that form an interface between a number of cell types and the adjacent stroma. The basement membrane supports cells and also plays a role in tissue organization. BME-2 is a soluble basement membrane purified from Engelbreth-Holm-Swarm (EHS) tumor. The major components of BME-2 are laminin, collagen IV, entactin, and heparin sulfate proteoglycan.
-
2.
Always keep BME-2 on ice, even when diluted with media, it will begin to polymerize at temperatures above 10 °C and will rapidly polymerize between 22 °C and 35 °C.
-
3.
The Y-27632 compound is not required to be added to the media to prevent anoikis, as the organoids are dispensed fully formed and not as single cells for drug screening.
-
4.
When designing a plate layout to assess the drug sensitivity of multiple drugs, adhering to the following guidelines will increase the likelihood of generating usable, quality data, as well as providing sufficient data to calculate quality control metrics (discussed in Section 3.6).
Guidelines and decisions to be made:
-
(a)
Avoid using the outside wells of a 384 well-plate. These wells are liable to edge effects and thus the data generated in these wells is often unreliable.
-
(b)
Distribute the negative control wells across the 384 well-plate. This allows you to detect areas of the plate that may have been affected by edge effects, thermal gradients, or other artifacts such as dispensing errors, and which may affect downstream interpretation of results. Dedicate approximately 25 wells as negative control wells.
-
(c)
Decide on the number of drug concentrations per dose-response. Using a greater number of concentrations per dose-response generally results in a more accurate measurement of drug sensitivity. However, there is a compromise between the number of concentrations assayed and the number of drugs which can be screened on a plate. We find that a 7-point dose–response curve using a half-log fold dilution, covering a 1000-fold concentration range, allows for the generation of an informative dose–response curve with sufficient data from which the IC50 and AUC can be calculated.
-
(d)
Distribute the positive control wells across the 384 well-plate. Dedicate at least six wells as positive control wells. If possible include more than one positive control drug because it is our experience that some cancer organoid cultures are resistant to one or more of the positive control drugs. It is also good practice to include a dose-response of a positive control drug to ensure a dose–response effect is observed. We use MG-132 at 4 μM and staurosporine at 2 μM as positive controls. If an organoid culture is insensitive to the positive control drug(s), the Z-factor can be calculated using the blank wells.
-
(a)
-
5.
If drugs are stored frozen, avoid more than 3–4 freeze–thaw cycles as drug activity can be affected from multiple cycles. Drugs can be kept long-term in StoragePods® (Roylan Developments).
-
6.
Drug dilutions are prepared in a source plate at a concentration of 1000× of the desired final screening concentration, rather than directly adding drugs from the stock to the screening plate. This is to ensure the volumes dispensed are accurate and to maintain a final DMSO concentration of 0.1 %. For example, the highest drug concentration at 1000× requires transfer of 40 nL to a well of a screening plate containing 40 μL total volume. However, less than 1 nL of this stock would be required at lower drug concentrations. Because such low volumes cannot be accurately dispensed using our robotics, we generate the dose–response curves in a source plate but using larger volumes (typically 10 μL). The source plate can then be used for drugging multiple screening plates.
-
7.
Drug concentrations are selected to fully inhibit the target of interest based on prior knowledge and reading of the literature. We generally avoid exceeding concentrations of 10 μM due to the increased likelihood of off-target drug activity at higher concentrations.
-
8.
The plates containing a layer of 7.5 mg/mL of BME-2 can be stored in a 37 °C, 5 % CO2 incubator for a number of hours but we do not recommend storing them overnight as the consistency of the BME-2 can be affected.
-
9.
The organoid suspension should be as homogeneous in size as possible to allow for even dispensing of organoids in to screening plates. During the counting of the organoids, if it appears that the organoid suspension is not homogenous in size, the suspension can be filtered using a 20 μM cell strainer prior to recounting.
-
10.
Cultures are plated as formed multicellular organoids. During the harvesting procedure, some organoids may break into smaller clumps of cells and these will reform into organoids following the overnight incubation prior to drugs being added. As there are multiple cells per organoid, we are unable to give a precise cell number per well but our work has found that 15,000–20,000 organoids per mL generates sufficient signal to measure drug response.
-
11.
Keep the organoid suspension moving when dispensing to prevent the organoids falling to the bottom of the collection tube, leading to uneven dispensing.
-
12.
For the drug screen, the organoids are dispensed on top of a layer of 7.5 mg/mL BME-2 rather than embedded in the BME-2. The end-point of the assay requires the cells to be lysed in order to measure cell viability and we have found improved cell lysis when the organoids are not embedded in BME-2, which subsequently improved data quality and consistency. We have not observed any effects on organoid growth or morphology when overlaying rather than embedding cells.
-
13.
A 1:1 dilution of CellTiter-Glo® 2.0 is recommended by the manufacturer. We use a 4:1 dilution (4 media:1 CellTiter-Glo® 2.0) and have found no improvement in data quality when using the recommended volume.
-
14.
An increased incubation time is used when assaying organoids with CellTiter-Glo® 2.0 as we have found improved cell lysis and signal.
References
Lynch TJ, Bell DW, Sordella R et al (2004) Activating mutations in the epidermal growth factor receptor underlying responsiveness of non-small-cell lung cancer to gefitinib. N Engl J Med 350:2129–2139
Paez JG, Jänne PA, Lee JC et al (2004) EGFR mutations in lung cancer: correlation with clinical response to gefitinib therapy. Science 304:1497–1500
Garnett MJ, Edelman EJ, Heidorn SJ et al (2012) Systematic identification of genomic markers of drug sensitivity in cancer cells. Nature 483:570–575
Barretina J, Caponigro G, Stransky N et al (2012) The cancer cell line encyclopedia enables predictive modelling of anticancer drug sensitivity. Nature 483:603–607
Basu A, Bodycombe NE, Cheah JH et al (2013) An interactive resource to identify cancer genetic and lineage dependencies targeted by small molecules. Cell 154:1151–1161
Seashore-Ludlow B, Rees MG, Cheah JH et al (2015) Harnessing connectivity in a large-scale small-molecule sensitivity dataset. Cancer Discov 5:1210–1223
Holliday DL, Speirs V (2011) Choosing the right cell line for breast cancer research. Breast Cancer Res 13:215
Wistuba II, Behrens C, Milchgrub S et al (1998) Comparison of features of human breast cancer cell lines and their corresponding tumors. Clin Cancer Res 4:2931–2938
Burdall SE, Hanby AM, Lansdown MR et al (2003) Breast cancer cell lines: friend or foe? Breast Cancer Res 5:89–95
Sato T, Vries RG, Snippert HJ et al (2009) Single Lgr5 stem cells build crypt-villus structures in vitro without a mesenchymal niche. Nature 459:262–265
Sato T, Stange DE, Ferrante M et al (2011) Long-term expansion of epithelial organoids from human colon, adenoma, adenocarcinoma, and Barrett’s epithelium. Gastroenterology 141:1762–1772
Liu X, Ory V, Chapman S (2012) ROCK inhibitor and feeder cells induce the conditional reprogramming of epithelial cells. Am J Pathol 180:599–607
Boj SF, Hwang CI, Baker LA et al (2015) Organoid models of human and mouse ductal pancreatic cancer. Cell 160:324–338
van de Wetering M, Francies HE, Francis JM et al (2015) Prospective derivation of a living organoid biobank of colorectal cancer patients. Cell 161:933–945
Huch M, Gehart H, van Boxtel R et al (2015) Long-term culture of genome-stable bipotent stem cells from adult human liver. Cell 160:299–312
Gao D, Vela I, Sbiner A et al (2014) Organoid cultures derived from patients with advanced prostate cancer. Cell 159:176–187
Zhang JH, Chung TD, Oldenburg KR (1999) A simple statistical parameter for use in evaluation and validation of high throughput screening assays. J Biomol Screen 4:67–73
Vis DJ, Bombardelli L, Lightfoot H et al (2016) Multilevel models improve precision and speed of IC50 estimates. Pharmacogenomics 7:691–700
Acknowledgments
We would like to thank the Wellcome Trust Sanger Institute cell line drug screening team for their help in developing these protocols and Stacey Price for critical reading of this manuscript. This work was funded with Awards from the Wellcome Trust (102696), Stand Up To Cancer (SU2C-AACR-DT1213), The Dutch Cancer Society (H1/2014-6919), and Cancer Research UK (C44943/A22536).
Author information
Authors and Affiliations
Corresponding author
Editor information
Editors and Affiliations
Rights and permissions
Open Access This chapter is licensed under the terms of the Creative Commons Attribution-NonCommercial 4.0 International License (http://creativecommons.org/licenses/by/4.0/), which permits any noncommercial use, sharing, adaptation, distribution and reproduction in any medium or format, as long as you give appropriate credit to the original author(s) and the source, provide a link to the Creative Commons license and indicate if changes were made.
The images or other third party material in this chapter are included in the chapter’s Creative Commons license, unless indicated otherwise in a credit line to the material. If material is not included in the chapter’s Creative Commons license and your intended use is not permitted by statutory regulation or exceeds the permitted use, you will need to obtain permission directly from the copyright holder.
Copyright information
© 2016 The Author(s)
About this protocol
Cite this protocol
Francies, H.E., Barthorpe, A., McLaren-Douglas, A., Barendt, W.J., Garnett, M.J. (2016). Drug Sensitivity Assays of Human Cancer Organoid Cultures. In: Turksen, K. (eds) Organoids. Methods in Molecular Biology, vol 1576. Humana, New York, NY. https://doi.org/10.1007/7651_2016_10
Download citation
DOI: https://doi.org/10.1007/7651_2016_10
Published:
Publisher Name: Humana, New York, NY
Print ISBN: 978-1-4939-7616-4
Online ISBN: 978-1-4939-7617-1
eBook Packages: Springer Protocols