


ABSTRACT
We identify 73 z ∼ 7 and 59 z ∼ 8 candidate galaxies in the reionization epoch, and use this large 26–29.4 AB mag sample of galaxies to derive very deep luminosity functions to < − 18 AB mag and the star formation rate (SFR) density at z ∼ 7 and z ∼ 8 (just 800 Myr and 650 Myr after recombination, respectively). The galaxy sample is derived using a sophisticated Lyman-break technique on the full two-year Wide Field Camera 3/infrared (WFC3/IR) and Advanced Camera for Surveys (ACS) data available over the HUDF09 (∼29.4 AB mag, 5σ), two nearby HUDF09 fields (∼29 AB mag, 5σ, 14 arcmin2), and the wider area Early Release Science (∼27.5 AB mag, 5σ, ∼40 arcmin2). The application of strict optical non-detection criteria ensures the contamination fraction is kept low (just ∼7% in the HUDF). This very low value includes a full assessment of the contamination from lower redshift sources, photometric scatter, active galactic nuclei, spurious sources, low-mass stars, and transients (e.g., supernovae). From careful modeling of the selection volumes for each of our search fields, we derive luminosity functions for galaxies at z ∼ 7 and z ∼ 8 to < − 18 AB mag. The faint-end slopes α at z ∼ 7 and z ∼ 8 are uncertain but very steep at α = −2.01 ± 0.21 and α = −1.91 ± 0.32, respectively. Such steep slopes contrast to the local α ≳ −1.4 and may even be steeper than that at z ∼ 4 where α = −1.73 ± 0.05. With such steep slopes (α ≲ −1.7) lower luminosity galaxies dominate the galaxy luminosity density during the epoch of reionization. The SFR densities derived from these new z ∼ 7 and z ∼ 8 luminosity functions are consistent with the trends found at later times (lower redshifts). We find reasonable consistency with the SFR densities implied from reported stellar mass densities being only ∼40% higher at z < 7. This suggests that (1) the stellar mass densities inferred from the Spitzer Infrared Array Camera (IRAC) photometry are reasonably accurate and (2) that the initial mass function at very high redshift may not be very different from that at later times.
Export citation and abstract BibTeX RIS
1. INTRODUCTION
One of the primary frontiers in extragalactic astronomy is observing the buildup of the galaxies in the first 1–2 billion years of the universe. With the recent installation of Wide Field Camera 3/infrared (WFC3/IR) on Hubble Space Telescope (HST), we are in position to study galaxy evolution out to z ∼ 8 (e.g., Bouwens et al. 2010b; McLure et al. 2010; Bunker et al. 2010; Finkelstein et al. 2010; Trenti et al. 2011) and even plausibly to z ∼ 10 (e.g., Bouwens et al. 2011a). Through the detection and characterization of galaxies at such high redshifts, we can place important constraints on the accretion rate of gas onto galaxies at early times, feedback effects, and perhaps even the dark matter power spectrum. These studies also provide essential inputs to reionization discussions (e.g., Bolton & Haehnelt 2007; Pawlik et al. 2009), galaxy modeling (e.g., Finlator et al. 2011; Lacey et al. 2011; Salvaterra et al. 2011; Choi & Nagamine 2010; Trenti et al. 2010), as well as our understanding of how quickly metals pollute the intergalactic medium (e.g., Ryan-Weber et al. 2009; Becker et al. 2009; Simcoe 2006).
One very useful way of characterizing the galaxy population over an extended period of cosmic time is through a careful quantification of the UV luminosity function (LF) of galaxies with redshift. The UV LF is a particularly useful tracer of the buildup of galaxies at early times, given the observed correlation of UV light with stellar mass (Stark et al. 2009; González et al. 2010; Labbé et al. 2010a, 2010b) and halo mass (e.g., Lee et al. 2006, 2009; Ouchi et al. 2005; Overzier et al. 2006; McLure et al. 2009). Comprehensive studies of both the UV LF and the differential evolution of the UV LF with cosmic time are available at z ∼ 4–5 (Yoshida et al. 2006), z ∼ 4–6 (Bouwens et al. 2007; see also Beckwith et al. 2006), z ∼ 5–6 (McLure et al. 2009), z ∼ 4–7 (Bouwens et al. 2008), and z ∼ 2–4 (Reddy et al. 2008; Reddy & Steidel 2009; see also Sawicki & Thompson 2006). The general result of these studies at z ≲ 6 has been that the volume density of galaxies evolves much more rapidly at the bright end of the UV LF than at the faint end.
Recently, as a result of the installation of the WFC3/IR camera on HST, it has been possible to extend these studies to z ≳ 6. The first ultra-deep WFC3/IR observations over the Hubble Ultra-deep Field (Beckwith et al. 2006) as part of the HUDF09 program (GO 11563; PI: Illingworth) made it possible to identify samples of ≳20 galaxies at z ∼ 7–8 (Oesch et al. 2010a; Bouwens et al. 2010b; McLure et al. 2010; Bunker et al. 2010; Yan et al. 2010; Finkelstein et al. 2010) and even out to z ∼ 8.5. These early WFC3/IR samples have already been used to derive astrophysically interesting results on the sizes and structure (Oesch et al. 2010a), UV-continuum slopes (Bouwens et al. 2010a; Finkelstein et al. 2010; Bunker et al. 2010), stellar masses (Labbé et al. 2010a, 2010b; Finkelstein et al. 2010), and specific star formation rates (sSFRs; Labbé et al. 2010b) of z ≳ 7 galaxies.
Here we significantly improve upon these early studies by taking advantage of the full two-year observations over the HUDF and two other ultra-deep WFC3/IR fields taken as part of the HUDF09 program, as well as the deep wide-area (∼40 arcmin2) WFC3/IR Early Release Science (ERS) observations (Windhorst et al. 2011). These observations allow us to significantly expand the sample of z ∼ 7 and z ∼ 8 galaxies and substantially improve LF determinations. The ultra-deep HUDF09 observations are valuable for extending the previous results to even fainter levels and adding substantial statistics—allowing for significantly improved determinations of the LF shape and its faint-end slope α. Meanwhile, the wide-area ERS observations provide important constraints on the rarer, luminous population of z ∼ 7–8 galaxies. The ERS fields reach ∼1 mag deeper than other recent wide-area surveys in the near-IR (e.g., Castellano et al. 2010a, 2010b; Hickey et al. 2010; Bouwens et al. 2010c; Ouchi et al. 2009). Analyses of shallower versions of this data set are provided by Wilkins et al. (2011), McLure et al. (2011), and Lorenzoni et al. (2011).
We begin our paper by describing the data sets we use for our z ∼ 7 and z ∼ 8 selections (Section 2). We then move on to describing our procedure for constructing catalogs, selecting our Lyman-break samples, and estimating contamination (Section 3). In Section 4, we compare our samples with those available in the literature and discuss the robustness of current Lyman-break selections. In Section 5, we use the present Lyman-break samples to quantify the LF at z ∼ 7 and z ∼ 8 and then compare our LFs with those in the literature (Section 6). In Section 7, we discuss the implications of our results for the evolution of the LF at high redshift, the SFR density and stellar mass density, and the reionization of the universe. Finally, in Section 8 we summarize our results. The appendices provide a detailed description of how we utilize the optical data to ensure our selections are as clean as possible, as well as compiling a number of other useful but secondary results and tests. Throughout this work, we find it convenient to quote results in terms of the luminosity L*z = 3 Steidel et al. (1999) derived at z ∼ 3, i.e., M1700, AB = −21.07. We will refer to the HST F435W, F606W, F775W, F850LP, F098M, F105W, F125W, and F160W bands as B435, V606, i775, z850, Y098, Y105, J125, and H160, respectively, for simplicity. We assume Ω0 = 0.3, ΩΛ = 0.7, and H0 = 70 km s−1 Mpc−1. We express all magnitudes in the AB system (Oke & Gunn 1983).
2. OBSERVATIONAL DATA
The primary data set for this analysis is the two-year ultra-deep WFC3/IR observations that were taken as part of the HUDF09 program (GO 11563; PI: Illingworth). These IR data were obtained over the HUDF and the two Advanced Camera for Surveys (ACS) HUDF05 fields. We also include results from the new wide-area WFC3/IR ERS observations over the CDF-South GOODS field (GO 11359; PI: O'Connell). A summary of the observational data we use for the present analysis is provided in Table 1. The layout of these deep WFC3/IR observations over and around the CDF-South GOODS field is illustrated in Figure 1.

Figure 1. Deep WFC3/IR data over the extended CDF-South GOODS field used to search for z ≳ 7 LBGs. The red rectangles over the HUDF, HUDF05-1 (P12), and HUDF05-2 (P34) fields (labeled HUDF09, HUDF09-1, and HUDF09-2) show the position of the three ∼4.7 arcmin2 ultra-deep WFC3/IR observations (∼29–29.5 AB mag at 5σ) that make up the HUDF09 program (Section 2.1). The upper ten rectangles show the WFC3/IR pointings that make up the ERS observations (GO 11359; PI: O'Connell) and cover ∼40 arcmin2 (Section 2.2). The dark blue regions show the position of the ultra-deep 100 +-orbit ACS/WFC data over the HUDF (Beckwith et al. 2006) and HUDF05-1/HUDF05-2 (P12, P34: Oesch et al. 2009) fields, while the blue regions show the position of the ACS observations over the GOODS fields (Giavalisco et al. 2004). The cyan region labeled P1 shows the position of the deep 111-orbit ACS observations we obtained over the HUDF09-2 WFC3/IR field while observing the HUDF09 field with the WFC3/IR camera. A convenient summary of the properties of these search fields is given in Table 1.
Download figure:
Standard image High-resolution imageTable 1. Summary of the Observational Data Used to Search for z ∼ 7 and z ∼ 8 Galaxies
| Passband | Detection Limitsa,b | PSF FWHM | Areal Coverage |
|---|---|---|---|
| (5σ) | (arcsec) | (arcmin2) | |
| HUDF09 (WFC3/IR HUDF) | |||
| B435 | 29.7 | 0.09 | 4.7 |
| V606 | 30.1 | 0.09 | 4.7 |
| i775 | 29.9 | 0.09 | 4.7 |
| z850 | 29.4 | 0.10 | 4.7 |
| Y105 | 29.6 | 0.15 | 4.7 |
| J125 | 29.9 | 0.16 | 4.7 |
| H160 | 29.9 | 0.17 | 4.7 |
| HUDF09-1 (WFC3/IR P12) | |||
| V606 | 29.0 | 0.09 | 4.7 |
| i775 | 29.0 | 0.09 | 4.7 |
| z850 | 29.0 | 0.10 | 4.7 |
| Y105 | 29.0 | 0.15 | 4.7 |
| J125 | 29.3 | 0.16 | 4.7 |
| H160 | 29.1 | 0.17 | 4.7 |
| HUDF09-2 (WFC3/IR P34) | |||
| B435c | 28.8 | 0.09 | 3.3 |
| V606c | 29.9 | 0.09 | 4.7 |
| i775c | 29.3 | 0.09 | 4.7 |
| I814c | 29.0 | 0.09 | 3.3 |
| z850c | 29.2 | 0.10 | 4.7 |
| Y105 | 29.2 | 0.15 | 4.7 |
| J125 | 29.5 | 0.16 | 4.7 |
| H160 | 29.3 | 0.17 | 4.7 |
| WFC3/IR ERS Fields (CDF-S GOODS) | |||
| B435 | 28.2 | 0.09 | 39.2 |
| V606 | 28.5 | 0.09 | 39.2 |
| i775 | 28.0 | 0.09 | 39.2 |
| z850 | 28.0 | 0.10 | 39.2 |
| Y098 | 27.9 | 0.15 | 39.2 |
| J125 | 28.4 | 0.16 | 39.2 |
| H160 | 28.1 | 0.17 | 39.2 |
Notes.
a0 35 diameter apertures.
bNo correction is made for the light outside of the 035 diameter aperture. This is in contrast to several previous WFC3/IR studies by our team (e.g., Bouwens et al. 2010a, 2010b) where our quoted depths were corrected for the missing light (which can result in a ∼0.3 mag and ∼0.5 mag correction to the quoted depths for the ACS and WFC3/IR data, respectively, but depend upon the profile assumed).
cOur reductions of the ACS data over the HUDF09-2 field include both observations taken as part of the HUDF05 (82 orbits: see the dark blue region covering the HUDF09-2 field in Figure 1) and HUDF09 (111 orbits: see the cyan "P1" region covering the HUDF09-2 field) programs. The latter observations add ∼0.15–0.4 mag to the total optical depths and are important for ensuring our Lyman-break selections are largely free of contamination to the limits of our selection (∼29 AB mag).
35 diameter apertures.
bNo correction is made for the light outside of the 035 diameter aperture. This is in contrast to several previous WFC3/IR studies by our team (e.g., Bouwens et al. 2010a, 2010b) where our quoted depths were corrected for the missing light (which can result in a ∼0.3 mag and ∼0.5 mag correction to the quoted depths for the ACS and WFC3/IR data, respectively, but depend upon the profile assumed).
cOur reductions of the ACS data over the HUDF09-2 field include both observations taken as part of the HUDF05 (82 orbits: see the dark blue region covering the HUDF09-2 field in Figure 1) and HUDF09 (111 orbits: see the cyan "P1" region covering the HUDF09-2 field) programs. The latter observations add ∼0.15–0.4 mag to the total optical depths and are important for ensuring our Lyman-break selections are largely free of contamination to the limits of our selection (∼29 AB mag).
Download table as: ASCIITypeset image
2.1. HUDF09 Observations
The full two-year WFC3/IR observations from the HUDF09 program consist of 192 orbits of ultra-deep WFC3/IR data over the HUDF09 (111 orbits), HUDF09-1 (33 orbits), and HUDF09-2 (48 orbits) fields. The observations from this program are now complete.
All 111 orbits of imaging data over the HUDF were obtained on a single ∼4.7 arcmin2 WFC3/IR pointing and were distributed over three bands: Y105 (24 orbits), J125 (34 orbits), and H160 (53 orbits). The reductions of those data are similar to those already described in Oesch et al. (2010a) and Bouwens et al. (2010b), but now include the full two years of observations of the HUDF. Great care was exercised to ensure the image registration to the optical HUDF was as accurate as possible. Not only were latest distortion solutions (10/11/2010) utilized, but each source in our WFC3/IR reductions was cross-correlated with the corresponding source in the v1.0 HUDF ACS z850-band observations (Beckwith et al. 2006). Small corrections to the distortion solution were required to obtain excellent registration (i.e., rms differences of <001) for the Y105-band data (no WFC3/IR distortion solution was explicitly derived for this filter by STScI). Pixels affected by source persistence were explicitly masked out. This masking was performed by remapping our initial reductions of the data back to the original frames, subtracting them from the original frames, co-adding these subtracted frames for all exposures within a visit, smoothing, and then flagging all pixels above a 3σ threshold. The final reduced frames were drizzled onto the v1.0 HUDF ACS reductions rebinned on a 006 pixel frame.
Our HUDF09 WFC3/IR reductions reach to 29.6, 29.9, and 29.9 AB mag (5σ: 035 diameter apertures) in the Y105, J125, and H160 bands, respectively. The optical ACS imaging over the HUDF reach to 29.7, 30.1, 29.9, and 29.4 AB mag (5σ: 035 diameter apertures) in the B435, V606, i775, and z850 bands, respectively. These depths do not include any correction for the light outside of the 035 diameter aperture and on the wings of the point-spread function (PSF), so that the depths can be readily reproduced.
The availability of the WFC3/IR observations over the HUDF09-1 (33 orbits) and HUDF09-2 (48 orbits) fields allows us to substantially extend our z ∼ 7 and z ∼ 8 samples. In both fields, the WFC3/IR observations were concentrated in single ∼4.7 arcmin2 WFC3/IR pointings and distributed across the three bands Y105, J125, and H160. In the HUDF09-1 field, 8 orbits in the Y105 band, 12 orbits in the J125 band, and 13 orbits in the H160 band were acquired. In the HUDF09-2 field, 11 orbits in the Y105 band, 18 orbits in the J125 band, and 19 orbits in the H160 band were acquired. These new observations were reduced using the same procedures as for the HUDF. The WFC3/IR observations were registered and drizzled onto the same frame as our reductions of the ACS data on the two fields rebinned on a 006 pixel frame. As with our UDF reductions, care was taken to ensure that the registration to the optical data was as accurate as possible (<001) and that even issues such as velocity aberration were properly treated. Our reductions of the WFC3/IR over the HUDF09-1 field reach to 29.0, 29.3, and 29.1 AB mag in the Y105, J125, and H160 bands, respectively. These depths are 29.1, 29.4, and 29.3 AB mag, respectively, over the HUDF09-2 field (see Table 1).
For the ACS observations over the HUDF09-1 field, we could only take advantage of those from the HUDF05 (GO10632; PI: Stiavelli) program, and so we used the publicly available v1.0 reductions of Oesch et al. (2007). For the HUDF09-2 field, on the other hand, deep ACS observations are available as a result of two programs: the HUDF05 and HUDF09 programs. The ACS observations over this field from the HUDF05 program (102 orbits in total: 9 orbits V606 band, 23 orbits i775 band, and 70 orbits z850 band) were obtained over an ∼18 month period in 2005 and 2006 at a number of different orientations, as well as a 1' shift for 20 orbits from the primary pointing. One hundred eleven additional orbits of ACS data (10 orbits B435 band, 23 orbits V606 band, 23 orbits i775 band, 16 orbits I814 band, and 39 orbits z850 band) were acquired over this field in 2009 and 2010 from our HUDF09 program.
Reductions of the recent ACS observations were conducted using the ACS GTO apsis pipeline (Blakeslee et al. 2003). Special care was required to cope with the significantly reduced charge transfer efficiency in the new post-SM4 ACS observations and to correct for row-by-row banding artifacts. Our recent ACS observations (from HUDF09) cover ∼70% of the HUDF09-2 footprint and add ∼0.15–0.5 mag to the depth of the earlier HUDF05 observations (after co-addition). Reductions of the HUDF05 ACS observations are described in Bouwens et al. (2007). The depths of the WFC3/IR and ACS observations over these two fields are given in Table 1 and reach to ≳29 AB mag (5σ).
2.2. WFC3/IR ERS Observations
The WFC3/IR ERS observations cover ∼40 arcmin2 in the upper region of the CDF-South GOODS field (Windhorst et al. 2011). These observations include 10 separate ∼4.7 arcmin2 WFC3/IR pointings (see Figure 1). Two orbits of near-IR data are obtained in the F098M, F125W, and F160W bands, for a total of six orbits per field (60 orbits in total). These near-IR observations are reduced in a very similar way to the procedure used for the WFC3/IR observations from our HUDF09 program (Oesch et al. 2010a; Bouwens et al. 2010b). To keep the size of the drizzled WFC3/IR frames manageable, we split the output mosaic into eight discrete pieces—corresponding to different segments in the ACS GOODS mosaic (i.e., S14, S24, S25, S34, S35, S43, S44, S45).9 For each segment, we first aligned the observations against the ACS data binned on a 006 pixel scale and then drizzled the data onto that frame. For the ACS data, we made use of our own reductions (Bouwens et al. 2006, 2007) of the deep GOODS ACS/WFC data over the GOODS fields (Giavalisco et al. 2004). These reductions are similar to the GOODS v2.0 reductions, but reach ∼0.1–0.3 mag deeper in the z850 band due to our inclusion of the supernovae (SNe) follow-up data (e.g., Riess et al. 2007). Our reduced WFC3/IR data reach to 27.9, 28.4, and 28.0 in the Y098, J125 and H160 bands, respectively (5σ: 035 apertures). The ACS observations reach to 28.2, 28.5, 28.0, and 28.0 in the B435, V606, i775, and z850 bands, respectively (5σ: 035 apertures). The FWHMs of the PSFs are ∼016 for the WFC3/IR data and ∼010 for the ACS/WFC data.
3. LYMAN-BREAK SELECTION
In this section, we describe our procedure for selecting star-forming galaxies at z ∼ 7 and z ∼ 8 using the observational data (Section 2). We begin by detailing our technique for constructing source catalogs (Section 3.1). We then describe our procedure for selecting galaxies at z ∼ 7 and z ∼ 8 using Lyman-break Galaxy (LBG) selection criteria in the HUDF09 (Section 3.2) and ERS (Section 3.4) fields. Section 3.3 provides a short discussion of the χ2opt criterion we use for selecting high-redshift galaxies. In Section 3.5 we discuss possible sources of contamination and attempt to quantify their importance, and in Section 3.6 we provide a brief summary of our final samples of z ∼ 7 and z ∼ 8 galaxies.
3.1. Catalog Construction
We generate separate catalogs for each of our Lyman-break selections, to obtain more optimal photometry for each selection. This is done through the use of square root of χ2 detection images (Szalay et al. 1999: similar to a co-added inverse noise-weighted image) constructed from only those bands that are expected to have flux for a given Lyman-break selection. Specifically, this image is constructed from the Y105-, J125-, and H160-band images for our z ∼ 7 HUDF09 z850-dropout selection, the J125- and H160-band images for our z ∼ 8 HUDF09 Y105-dropout selection, and from the J125- and H160-band images for our ERS z850- and Y098-dropout selections; the square root of χ2 image therefore includes all deep WFC3/IR observations redward of the break.
Object detection and photometry are performed using the SExtractor (Bertin & Arnouts 1996) software run in dual image mode. Object detection is performed off the square root of χ2 image. Colors are measured in small scalable apertures (MAG_AUTO) defined using a Kron (1980) factor of 1.2 (where the Kron radius is established from the square root of χ2 image). All of our imaging data (optical/ACS and near-IR/WFC3) are PSF-matched to the WFC3/IR F160W imaging data before making these color measurements. Fluxes in these small scalable apertures are then corrected to total magnitudes in two steps. First a correction is made for the additional flux in a larger scalable aperture (with Kron factor of 2.5). Then a correction is made for the light outside this larger scalable aperture (a 07 diameter aperture is typical) and on the wings of the PSF. The latter correction (typically 0.2 mag) is made based upon the encircled energy measured outside this aperture (for stars).10 The typical size of the total correction (including both steps) is ∼0.4–0.8 mag.
3.2. Selection Procedure (HUDF09 Fields)
Our primary z ∼ 7–8 Lyman-break samples are based upon the ultra-deep WFC3/IR observations over the three HUDF09 fields. The availability of ultra-deep three-band (Y105, J125, and H160) observations over these fields allows us to use traditional two-color LBG selection criteria to identify star-forming galaxies at z ≳ 7. Spectroscopic follow-up has shown that these criteria are generally quite robust in identifying star-forming galaxies at z ∼ 3–7 (e.g., Steidel et al. 1996, 2003; Popesso et al. 2009; Vanzella et al. 2009; Stark et al. 2010) though admittedly spectroscopic follow-up of the very faintest sources at z ⩾ 4 has been ambiguous since only those sources with Lyα emission can be confirmed.
We favor the use of LBG "dropout" selection criteria over the use of photometric redshifts for the identification of star-forming galaxies at z ∼ 7 and z ∼ 8 due to (1) the simplicity and transparency of LBG criteria, (2) the ease with which optical non-detection criteria can be engineered to optimally remove contaminants (e.g., see Appendix D), (3) the economy with which these criteria capture the available redshift information (while minimizing redshift aliasing effects), and (4) the accuracy with which it is possible to model the effective selection volumes.
The color criteria we utilize for our selection are similar to those already used by Oesch et al. (2010a) and Bouwens et al. (2010b). In detail, these criteria are


for our z ∼ 7 z850-dropout sample and

for our z ∼ 8 Y105-dropout selection, where ∧ represents the logical AND symbol. These two-color criteria are illustrated in Figures 2 and 3, respectively. The criteria were chosen to allow for a fairly complete selection of star-forming galaxies at z ∼ 7 and z ∼ 8 and so that our HUDF09 samples have a very similar redshift distribution to those galaxies selected with the ERS Y098, J125, and H160 bands (see Figure 4 and Section 3.4). They are also carefully crafted so that all star-forming galaxies at z ≳ 6.5 are included and do not fall between our z ∼ 7 and z ∼ 8 selections. To ensure that sources are real, we require that sources be detected at ≳3.5σ in the J125 band and 3σ in the Y105 or H160 bands. This is equivalent to a detection significance of 4.5σ (when combining the J125 and Y105/H160 detections).

Figure 2. z850 − Y105 vs. Y105 − J125 two-color diagram we use to identify z ∼ 7 z850 dropouts over the three ultra-deep WFC3/IR HUDF09 fields (14 arcmin2). The z − Y/Y − J colors required for our z850-dropout selection are indicated by the gray region. z850-dropout candidates identified in the HUDF09, HUDF09-1, and HUDF09-2 fields are shown with the blue solid circles, blue open squares, and blue solid squares, respectively. The error bars and lower limits are 1σ. The blue lines show the expected colors of star-forming galaxies with UV-continuum slopes β of −3 and −2, while the red lines show the expected colors of low-redshift contaminants. The colors of low-mass L,T dwarf stars (e.g., Knapp et al. 2004) are indicated by the green squares. In addition to the two-color Lyman-break selection presented, we also enforce a very strict optical non-detection criterion involving a χ2opt quantity (Section 3.3; Appendix D). Through extensive simulations, we have found that a two-color LBG selection combined with strong constraints on the optical flux allow for the robust selection of star-forming galaxies at z ∼ 7.
Download figure:
Standard image High-resolution image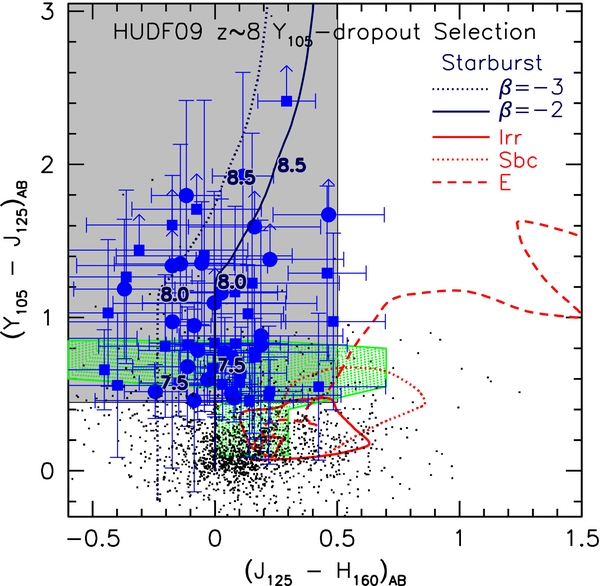
Figure 3. Y105 − J125 vs. J125 − H160 two-color diagram used to identify z ∼ 8 Y105-dropout galaxies over the three ultra-deep WFC3/IR HUDF09 fields (14 arcmin2). The Y105 − J125/J125 − H160 colors required for our Y105-dropout selection are indicated by the gray region. The other symbols and lines are as in Figure 2. The overlap of our color selection region with that occupied by L and T dwarfs is not a concern—given that an exceeding small fraction of the sources (≲2%) in our selection appear to be unresolved (see Section 3.5). In addition to the two-color Lyman-break selection presented, we also enforce a very strict optical non-detection criterion involving a χ2opt quantity (Section 3.3; Appendix D). As noted in Figure 2, our extensive simulations show that these two color criteria—combined with strict optical non-detection requirements—allow for the robust selection of z ∼ 8 galaxies.
Download figure:
Standard image High-resolution image
Figure 4. Redshift distributions predicted for our z ∼ 7 z850-dropout (solid magenta lines) and z ∼ 8 Y105-dropout (solid red lines) selections over our ultra-deep HUDF09 fields (see Section 3.2). Also shown are the redshift distributions for our z ∼ 7 z850-dropout and z ∼ 8 Y098-dropout selections over the wide-area ERS fields (Section 3.4: dotted magenta and red lines, respectively). Different WFC3/IR Y-band filters are employed for the HUDF09 fields (Y105) and for the ERS search area (Y098); the J125 and H160 filters are the same. The selection criteria are carefully chosen to allow for a better match between the HUDF09 and ERS redshift selection windows. The result is that the redshift distributions are similar at z ∼ 7 and z ∼ 8. The mean redshift for our z850-dropout selections is 6.8 and 6.7 for our HUDF09 and ERS selections, respectively. The mean redshift for our Y105/Y098-dropout selections is 8.0 and 7.8 for our HUDF09 and ERS selections, respectively.
Download figure:
Standard image High-resolution imageFor both of our z ∼ 7 z850-dropout and z ∼ 8 Y105-dropout samples, we enforce very stringent optical non-detection criteria. Not only do we reject sources detected at 2σ in a single passband or 1.5σ in more than one band, but we also compute a collective χ2opt value from all of the optical data together and eliminate sources above specific thresholds. We outline this procedure in Section 3.3.
To ensure that our selections do not suffer from significant contamination from SNe or low-mass stars (both of which have point-like profiles), we examined each of our candidate z ∼ 7–8 galaxies with the SExtractor stellarity parameter to identify those sources consistent with being point-like. The only source that we identified in our fields that was point-like and satisfied our dropout criteria was the probable SNe (03:32:34.53, −27:47:36.0) previously identified over the HUDF (Oesch et al. 2010a: see also McLure et al. 2010; Bunker et al. 2010; Yan et al. 2010). No other point-like sources were found (or removed).
We use the above criteria to search for candidate z ≳ 7 galaxies over all areas of our HUDF09 fields where the WFC3/IR observations are at least half of their maximum depth in each field (or ∼4.7 arcmin2 per field). In total, 29 z ∼ 7 z850-dropout sources and 24 z ∼ 8 Y105 dropouts were identified over our ultra-deep WFC3/IR HUDF pointing. Seventeen z ∼ 7 z850-dropout sources and 14 z ∼ 8 Y105 dropouts were found over our ultra-deep WFC3/IR HUDF09-1 pointing, while 14 z ∼ 7z850-dropout sources and 15 z ∼ 8 Y105 dropouts were found over our ultra-deep WFC3/IR HUDF09-2 pointing. As in the Oesch et al. (2010a) and Bouwens et al. (2010b) selections (see also McLure et al. 2010; Bunker et al. 2010; Yan et al. 2010; Finkelstein et al. 2010), the sources we identified have H160-band magnitudes ranging from ∼26 mag to ∼29 mag. A catalog of the z ∼ 7 z850 dropouts in the HUDF09 fields is provided in Tables 10–12 of Appendix E. A similar catalog of Y105 dropouts is provided in Tables 14–16 of Appendix E. Figures 20 and 21 of Appendix E show image cutouts of all of these candidates. Figure 5 shows the approximate surface density of these candidates as a function of magnitude in our HUDF09 search fields.

Figure 5. Surface densities found in our z ∼ 7 z850-dropout (upper left) and z ∼ 8 Y098-dropout (lower left) selections over the wide-area ERS observations (black histograms, with 1σ errors) and in our z ∼ 7 z850-dropout (upper right) and z ∼ 8 Y105-dropout (lower right) selections over our HUDF09 observations (histograms). For comparison, we show the predicted surface densities based upon the Bouwens et al. (2007, 2008) determinations of the UV LF at z ∼ 6 (cyan lines) and z ∼ 7 (magenta lines). The solid red lines are the surface densities predicted extrapolating the Bouwens et al. (2008) LF results to z ∼ 8 (based upon the fitting formula in that paper). The two H160, AB ∼ 26 Y105 dropouts seen in the lower right panel—while exceeding the predicted surface densities for z ∼ 8 star-forming galaxies—may be part of an overdensity (see Section 5.3).
Download figure:
Standard image High-resolution imageAs a result of the very limited depths of the ACS data over our fields, it was necessary to exercise considerable caution in selecting z ≳ 7 galaxies over our fields. Our conservative selection procedure resulted in our eliminating a modest number of sources from our still very large z ∼ 7 and z ∼ 8 samples. For comparison with other studies, we have included a list of these likely contaminants in Tables 18 and 19 of Appendix E.
3.3. Controlling for Contamination Using the Measured Values of χ2opt
Identifying lower redshift contaminants in our HUDF09 selections is very challenging due to the limited depths of the available optical data. This is especially true at the faintest magnitudes. We have found that the only truly effective way to identify these contaminants is to make full use of the optical data.
Accordingly, we have developed a rather sophisticated multi-step procedure to obtain tight controls on contamination. The first step is rather standard for high-redshift selections: remove all the sources detected at 2σ in a single optical band or at 1.5σ in more than one optical band. The second step is more complex, but very effective. In this second step we compute a collective χ2opt from all of the optical data as

We reject all sources with χ2opt greater than a specific value χ2lim that we establish through simulations (Appendix D). At brighter 0.5(J125, AB + H160, AB) ≲ 28.5 magnitudes, we take χ2lim equal to 5, 3, and 5 for our HUDF09, HUDF09-1, and HUDF09-2 selections, respectively, while at fainter 0.5(J125, AB + H160, AB) > 29.2 magnitudes, χ2lim is taken to be half that. At magnitudes between those limits, the limiting χ2lim is an interpolation between the two extremes. More stringent limiting values on χ2lim are adopted for the faintest sources or where the optical data are shallower; more permissive limiting values on χ2lim are adopted for brighter sources or where the optical data are deeper. Note that fi is the flux in band i in our smaller scalable apertures, σi is the uncertainty in this flux, and SGN(fi) is equal to 1 if fi > 0 and −1 if fi < 0. The filters included in the χ2opt summation are B435, V606, and i775 for the z850-dropout selection and B435, V606, i775, and z850 for the Y105-dropout selection.
These particular limits on χ2opt were chosen to minimize contamination for our Lyman-break selections while maximizing the completeness of the z ∼ 7 and z ∼ 8 sources in our samples (see Appendix D for the relevant simulations). We determine χ2opt in three different sets of apertures (035 diameter apertures, 018 diameter apertures, and scalable Kron apertures with typical and maximum radii of 02 and 04) to maximize the information we have on possible optical flux in our candidates. Larger aperture measurements are useful for flagging more extended low-redshift galaxies in the selection. Meanwhile, the smaller aperture measurements provide higher signal-to-noise ratio (S/N) measurements from the higher spatial resolution ACS data. Making measurements in such small apertures is meaningful, given that the alignment we achieve between sources in the WFC3/IR and ACS images is better than 001.
Overall, we have found that a χ2opt criterion is extremely effective at reducing the contamination rate from low-redshift galaxies that scatter into our selection. The reductions in the contamination rate are very substantial, i.e., factors of ≳2–3 over what it would be excluding only those sources detected at 2σ in one optical band or >1.5σ in ⩾2 optical bands. Finally, we emphasize that use of the χ2opt statistic and an examination of the χ2opt distribution allows us to verify that our samples are not subject to significant contamination (since contaminating sources would show up as a tail to positive χ2opt values; Section 4.2 and Appendix D.4).
3.4. Selection Procedure (ERS Fields)
To complement our ultra-deep searches for z ∼ 7–8 galaxies in the HUDF09 observations, we also take advantage of the wide-area (∼40 arcmin2) ERS observations over the upper portion of the CDF-South GOODS field (Figure 1).
Ideally we would use the same selection criteria for identifying z ∼ 7–8 galaxies over the ERS observations as we use over the three ultra-deep HUDF09 fields. This is not possible, however, since the ∼40 arcmin2 WFC3/IR ERS observations use a different Y-band filter (Y098) than in the WFC3/IR HUDF09 observations (Y105). The J125 and H160 filters remain the same. We can nevertheless do quite well in selecting galaxies over a similar redshift range and with similar properties by judiciously choosing our selection criteria (as can be seen in Figure 4).
The multi-color selection criteria we use to select galaxies at z ∼ 7 and z ∼ 8 are illustrated in Figures 6 and 7, respectively, and nominally correspond to z850-dropout and Y098-dropout selections. We base our z ∼ 7 z850-dropout selection on a z850 − J125-dropout criterion rather than a z850 − Y098-dropout criterion to extend our selection over a wider redshift range than is possible using a z850 − Y098 criterion. Dropout selections based upon the latter color criterion (e.g., as used by Wilkins et al. 2010) result in galaxies starting to drop out of the Y098 band at z ≳ 6.7. This makes it more difficult to identify the Lyman break at z ≳ 7, resulting in a redshift selection window that is artificially narrow.

Figure 6. Left: z850 − J125 vs. J125 − H160 two-color diagram we use to identify z ∼ 7 z850 dropouts over the ∼40 arcmin2 ERS observations (first part of our two-part z850-dropout criterion). Symbols and lines are the same as Figure 2. Right: z850 − J125 vs. Y098 − J125 two-color diagram used to identify z ∼ 7 z850-dropout galaxies (second part of our two-part z850-dropout criterion). Lines and symbols are as in the left panel. The colors required for our z850-dropout selection are indicated in gray. We base our z ∼ 7 z850-dropout selection on a z850 − J125-dropout criterion rather than a z850 − Y098-dropout criterion (e.g., as used by Wilkins et al. 2010) to extend our selection over a wider redshift range (see Section 3.4). In addition to the two-color Lyman-break selection presented, we also enforce a very strict optical non-detection criterion involving a χ2opt quantity (Section 3.3; Appendix D).
Download figure:
Standard image High-resolution image
Figure 7. Y098 − J125 vs. J125 − H160 two-color diagram used to identify z ∼ 8 Y098-dropout galaxies over the ∼40 arcmin2 ERS search area. Regions and lines are as in Figure 3. In addition to the two-color Lyman-break selection presented, we also enforce a very strict optical non-detection criterion involving a χ2opt quantity (Section 3.3; Appendix D).
Download figure:
Standard image High-resolution imageIn detail, we require that galaxies show a strong z850 − J125 > 0.9 break and satisfy z850 − J125 > 0.8 + 1.1(J125 − H160) and z850 − J125 > 0.4 + 1.1(Y098 − J125). The latter two criteria exclude sources with redshifts z ≲ 6.5. To bound our redshift window selection on the high end to redshifts z ≲ 7.4, we require that their Y098 − J125 colors be bluer than 1.25. In addition, sources are required to have J125 − H160 colors (redward of the break) bluer than 0.5 to exclude intrinsically red sources (which otherwise might contaminate our selection). Candidates are required to be detected at ⩾4.5σ in the J125 band and at ⩾3.5σ in the H160 band (to ensure that they correspond to real sources). A higher detection significance is required for our ERS selections than our HUDF09 selections (Section 3.2) to compensate for the fewer exposures that go into each ERS field (and hence less Gaussian noise).
For our higher z ∼ 8 Y098-dropout selections, we require that galaxies show a strong Y098 − J125 > 1.25 break and, similar to the previous z ∼ 7 z850-dropout selection, have J125 − H160 colors bluer than 0.5. As we will see later, our use of a Y098 − J125 > 1.25 criterion selects for star-forming galaxies at z ≳ 7.4 and is convenient for combining the ERS dropout samples with the HUDF09 samples (selected using a slightly different Y105 filter). Candidates are again required to be detected at ⩾4.5σ in the J125 band and 3σ in the H160 band.
To minimize the contamination from low-redshift galaxies that scatter into our dropout color windows, we utilize very stringent criteria to exclude sources that show any evidence of detection in the optical. This includes being detected at 2σ in a single optical band, 1.5σ in more than one optical band, or having an optical χ2opt value >2.5 (see Section 3.3 and Appendix D for our definition of χ2opt).
To control for potential contamination from low-mass stars or SNe—both of which have point-like profiles—we examined each of our candidate z ∼ 7 z850- or z ∼ 8 Y098-dropout galaxies with the SExtractor stellarity parameter to identify those sources consistent with being point-like. One of the sources (03:32:27.91, −27:41:04.2) in our selection had measured stellarity parameters consistent with being point-like (with stellarities >0.8 in the J125 and H160 bands). This source had a J − H∼−0.6 color—which is much bluer than typical L* galaxies at z ∼ 7 (Bouwens et al. 2010a), but consistent with the colors of a T dwarf (e.g., Knapp et al. 2004). We therefore identified this source as a probable T dwarf and removed it from our z850-dropout selection. For all other sources in our selection, the measured stellarity parameters were substantially less, with typical values ∼0.05–0.3 indicative of extended sources. From a quick inspection of Figures 20 and 21, it is clear that essentially all the sources in our samples are extended.
The above selection criteria are only applied to those regions of the WFC3/IR ERS observations over the CDF-South GOODS field where the optical and near-IR observations reach within 0.2 mag of the typical ACS GOODS field depth and ERS WFC3/IR depth, i.e., ≳3 orbits (ACS B435 band), ≳2 orbits (ACS V606 band), ≳3 orbits (ACS i775 band), ≳7 orbits (ACS z850 band), ≳2 orbits (Y105), ≳2 orbits (J125), and ≳2 orbits (H160). The total effective area is 39.2 arcmin2 (∼3 arcmin2 of the WFC3/IR ERS fields extend outside of the deep ACS GOODS data; see Figure 1).
With the above criteria, we selected 13 z ∼ 7 z850-dropout galaxies and 6 z ∼ 8 Y098-dropout galaxies. The z ∼ 7 z850-dropout candidates have magnitudes ranging from 25.8 to 27.6 AB mag, while the z ∼ 8 Y098-dropout candidates have magnitudes ranging from 26.0 to 27.2 AB mag. The properties of the sources are given in Tables 13 and 17. The surface densities of our z ∼ 7 z850 and z ∼ 8 Y098 dropouts are shown in Figure 5.
As with our HUDF09 dropout selections, we have compiled a list of other possible z ≳ 7 candidates that narrowly missed our ERS selection. These sources are given in Table 20 along with our reasons for excluding them from our samples.
3.5. Contamination
We have carefully crafted our selection criteria to optimally identify star-forming galaxies at z ∼ 7 and z ∼ 8 while minimizing contamination. However, some amount of contamination is almost inevitable, and so it is important to try to quantify the contamination rate. The five most important sources of contamination for our z ∼ 7 and z ∼ 8 selections are (1) low-mass stars, (2) SNe and other transient sources, (3) active galactic nuclei (AGNs), (4) lower redshift sources and photometric scatter, and (5) spurious sources. We consider each source of contamination in the paragraphs that follow.
3.5.1. Low-mass Stars
Low-mass stars have z850 − Y105, z850 − J125, and J125 − H160 colors very similar to that of z ∼ 7–8 galaxies, and therefore potentially contaminate our z ∼ 7 and z ∼ 8 selections. Fortunately, low-mass stars can be identified by taking advantage of the high-resolution WFC3/IR data, which permit us to determine which sources are extended and those which are not. Since essentially all of the sources seem to be extended—except for one SNe candidate in the HUDF09 (Section 3.2) and one probable T dwarf in the ERS observations (Section 3.4), it seems unlikely that our sample suffers from significant contamination from low-mass stars (i.e., ≲2%). While it is difficult to determine whether our faintest z ⩾ 7 candidates are resolved (due to their low S/N level), the fact that only 2 out of our brightest ∼50 z ⩾ 7 candidates are consistent with being point-like suggests that contamination from low-mass stars is not particularly important. Our conclusions here are similar to those of Finkelstein et al. (2010; see their Figure 5). Simple arguments based on the surface density of stars from our galaxy at high latitudes (e.g., Ryan et al. 2005) also suggest that dwarf star contamination must be small.
3.5.2. Transient Sources
Since the optical ACS HUDF and GOODS data were taken some five years earlier than the new infrared WFC3/IR data, our samples may suffer from contamination as a result of transient sources like SNe that appear in the new IR data but are absent in the old optical data. That is, they mimic high-redshift dropouts. Since essentially all known transient sources likely to show up in our searches as dropouts are unresolved, we would flag any such contaminants at the same time as we identify possible T dwarfs in the new observations. Only one such source is found in our search fields, and that is an apparent SNe over the ultra-deep HUDF09 pointing (Oesch et al. 2010a; McLure et al. 2010; Bunker et al. 2010; Yan et al. 2010), and it was indeed unresolved. The only other such source found in our selection had colors consistent with being a T dwarf (see Section 3.4). It therefore seems unlikely that our samples are subject to significant contamination from transient sources.
3.5.3. Active Galactic Nuclei (AGNs)
Another possible source of contamination for our selections could come from z ≳ 7 AGNs (e.g., Meiksin 2006). z ≳ 7 AGNs would show similarly strong Lyman break in their optical/near-IR colors and also very blue near-IR colors. However, we would also expect AGNs to be unresolved, and as we have already remarked in discussing possible contamination from low-mass stars and SNe, we only find one such source in our selection that has a profile consistent with being unresolved and which is not transient. It is interesting that obvious AGNs (those that are comparable to, or brighter than, the underlying galaxy) are not evident (i.e., ≲2%) in these z ∼ 7–8 samples.
3.5.4. Lower Redshift Sources
Are there lower redshift sources that mimic the colors of z ∼ 7 and z ∼ 8 galaxies? They would need to be small but extended faint objects that show a distinct and deep spectral break with rather blue colors at wavelengths longward of the break. It is not at all obvious what such objects would be, but one possible contaminating source might be a relatively compact, low surface brightness, very faint (and hence low mass) z ∼ 1.5–2.5 galaxy with a Balmer or 4000 Å break. Yet, whatever they might be, they are unlikely to dominate the numbers in high-redshift samples given (1) the size of the spectral breaks routinely seen in higher S/N samples and in stacked samples (e.g., Labbé et al. 2010a, 2010b; González et al. 2010) and (2) the lack of large numbers of such sources in spectroscopic samples of z ∼ 4–6 galaxies (e.g., Vanzella et al. 2009; Stark et al. 2010). Instead, they likely contribute to contamination at a low level and most often as a result of photometric scatter.
3.5.5. Lower Redshift Sources and Photometric Scatter
Perhaps the largest source of contamination for our z ∼ 7 and z ∼ 8 samples is from lower redshift galaxies that satisfy our selection criteria due to the effect of noise on their observed colors. Clearly, this is a much greater problem for sources within the faintest 1–2 magnitudes of the sample where the effect of noise is substantial, and so the contamination rate is expected to be the highest in the magnitude interval just brightward of the selection limit.
The procedure we use to estimate the importance of this effect relies upon actual sources from our observed data sets and so automatically takes into account the properties of "real" high-redshift galaxies. We estimate the number of contaminants in each of our galaxy samples by the following multi-step process. For each faint source in our search fields, we (1) randomly choose a brighter source from our three ultra-deep HUDF09 fields, and (2) then make that bright source match the faint source by scaling the flux of the brighter source and adding noise. Having done this for all of the faint sources in our real catalogs, we then have a "simulated" catalog with the same number of galaxies, magnitude distribution, and noise characteristics. We can use this catalog to test the reliability of our selections by applying the same z ∼ 7 z850-dropout and z ∼ 8 Y105/Y098-dropout selection criteria as we applied on the real data.
The brighter sources are taken from only slightly brighter magnitude ranges so they have higher S/N but are otherwise expected to be as similar as practical to the sources being tested for contamination. Thus, for our dropout samples over our three HUDF09 fields, our estimated contamination rates are made assuming that the faint photometric samples (H160, AB > 27.5) have the same color distributions as that found in the higher S/N HUDF09 26.5 < H160, AB < 28.0 subsample. For our ERS selections, our contamination estimates are based upon the higher S/N HUDF09 26.0 < H160, AB < 27.0 subsample. Noise is then added to the photometry, and our z850-dropout or Y105/Y098-dropout selection criteria are applied. Any source that is selected by our dropout criteria (after adding noise), but detected in the optical in the original high S/N observations is counted toward the total contamination level. We repeat this simulation 200× for each data set.
We find 5.0 z850 dropouts and 3.3 Y105-dropout contaminants per simulation from our three HUDF09 fields and 2.9 z850 dropouts and 2.3 Y098-dropout contaminants per simulation for our ERS observations. We present these contamination rates as a function of magnitude for each of our search fields in Table 9 of Appendix B. These simulations argue for an overall contamination rate of 8% and 6% for our z850-dropout and Y098-dropout selections, respectively, over our HUDF09 observations and 22% and 38% for our z850-dropout and Y098-dropout selections, respectively, over the ERS observations.
Our extensive testing has given us some useful insights. For example, it is striking how much lower the estimated contamination levels are in our HUDF09 selections than in our HUDF09-1/HUDF09-2 selections. The differences are typically greater than a factor of ∼3 and are the direct result of the much greater depth of the optical data over the HUDF09 (by ∼1 mag) than the HUDF09-1/HUDF09-2 selections. The present tests also show the importance of the ACS parallel observations obtained as part of the HUDF09 WFC3/IR over the HUDF09-2 field (the cyan "P1" region shown in Figure 1). Those regions with the deeper ACS data have an expected contamination rate that is 2.5 × lower than those regions without these data (see Table 9).
3.5.6. Spurious Sources
Spurious sources are unlikely to be a concern for our samples, given that our z ⩾ 7 candidate galaxies show detections in at least two bands. One of these bands is always the J125 band where a ≳3.5σ detection is required. The second band is either the Y105 or H160 band and that detection must be ≳ 3σ. Obtaining such significant detections in two independent images is extremely improbable. One simple technique for estimating the probable contamination from such sources is to look for similar ≳ 3.5σ J125-band and ≳ 3σ H160-band detections on the negative images. No such sources were found on the "negative" images.
3.5.7. Summary
Based upon the above discussion, tests, and simulations, it seems clear that the only meaningful source of contamination for the current selections are low-redshift sources that enter through photometric scatter. Overall, the estimated contamination rate is 5.0 z850 dropouts and 3.3 Y105 dropouts in our HUDF09 selections and 2.9 z850 dropouts and 2.2 Y098 dropouts in our ERS selections. This works out to an estimated contamination rate of ∼11% for our z ∼ 7 z850-dropout selection and ∼9% for our z ∼ 8 Y105/Y098-dropout selection. We therefore quote a contamination rate of ∼11% overall. As expected, most of this contamination is for the fainter sources. The estimated number of contaminants is tabulated as a function of magnitude in Table 9 of Appendix B.
3.6. Summary of Our z ∼ 7 and z ∼ 8 HUDF09+ERS Samples
In total, 73 z ∼ 7 z850-dropout candidates are identified over all of our search fields and 59 z ∼ 8 Y105/Y098-dropout candidates are found. A complete catalog of the dropouts in those samples is provided in Tables 10–17. Postage stamps of these dropout candidates are given in Figures 20 and 21.
A convenient summary of the properties of our z ∼ 7 z850- and z ∼ 8 Y105/Y098-dropout samples and our search fields is provided in Table 2. The redshift distributions derived for the samples are given in Figure 4. The mean redshift for our z850-dropout selections is 6.8 and 6.7 for our HUDF09 and ERS selections, respectively. Meanwhile, the mean redshift for our Y105/Y098-dropout selections is 8.0 and 7.8 for our HUDF09 and ERS selections, respectively.
Table 2. Summary of z ∼ 7 and z ∼ 8 Samplesa
| Sample | Area | z ∼ 7 | z ∼ 8 | ||
|---|---|---|---|---|---|
| (arcmin2) | No. | Limitsa | No. | Limitsa | |
| HUDF09 | 4.7 | 29 | J ⩽ 29.4 | 24 | H ⩽ 29.4 |
| HUDF09-1 | 4.7 | 17 | J ⩽ 29.1 | 14 | H ⩽ 29.0 |
| HUDF09-2 | 4.7 | 14 | J ⩽ 29.2 | 15 | H ⩽ 29.0 |
| ERS | 39.2 | 13 | J ⩽ 28.0 | 6 | H ⩽ 27.5 |
| Total | 53.3 | 73 | 59 | ||
Note.
aThe magnitude limit is the ∼5σ detection limit for objects in a 035 diameter aperture.
Download table as: ASCIITypeset image
4. ASSESSMENT OF CURRENT LBG SELECTIONS
4.1. Comparison with Earlier LBG Selections Over Our Search Fields
Before using the present LBG selections to make inferences about the rest-frame UV LF at z ≳ 7 and its evolution across cosmic time, it is instructive to compare these samples with previous samples over the same fields.
4.1.1. Previous z ≳ 6.5 Galaxy Selections within the HUDF09 Observations Over the HUDF
Nine catalogs of z ≳ 6.5 galaxies have already been published using the first-year ultra-deep HUDF09 WFC3/IR observations over the HUDF (Oesch et al. 2010a; Bouwens et al. 2010b; McLure et al. 2010, 2011; Bunker et al. 2010; Yan et al. 2010; Finkelstein et al. 2010; Wilkins et al. 2011; Lorenzoni et al. 2011). The z ≳ 6.5 catalogs from this paper include all 5 Y105-dropout candidates in the Bouwens et al. (2010b) HUDF09 catalog and 14 of the 16 z850-dropout candidates in the Oesch et al. (2010a) HUDF09 catalog. Two of the Oesch et al. (2010a) z850-dropout candidates are blended with nearby neighbors in the present catalog and are therefore not included here. In addition, several of the z850 dropouts in our previous catalog are now in our Y105-dropout catalogs, because we have modified our dropout criteria to better match up with the ERS filter set (see the discussion in Sections 3.2 and 3.4).
In comparison to our previous selection of z/Y-dropout candidates over the HUDF09 (Oesch et al. 2010a; Bouwens et al. 2010b, 2011a), the present sample contains 33 additional z ⩾ 7 candidates. The expanded size of our sample is the result of our use of the full two-year HUDF09 observations and our decision (1) to extend our selection to lower S/N to include fainter sources in the HUDF09 observations (as our improved tests for contamination now allow, as discussed in Section 3.5 and Appendix D) and (2) to carefully match up our z ∼ 7 z-dropout and z ∼ 8 Y-dropout criteria so that all credible z ≳ 7 sources fall into one of the two samples. Compared to previous z ≳ 6 catalogs, our dropout sample includes 21 additional candidates (see Tables 10 and 14). Essentially all of the candidates have J125-band magnitudes of ≳28.5 AB mag. The lack of completely new candidates at brighter magnitudes is not too surprising, given the large number of independent z ≳ 6.5 selections already performed on this HUDF09 data set.
4.1.2. Previous z ≳ 6.5 Galaxy Selections within the HUDF09-1/HUDF09-2 Observations
Several catalogs of z ∼ 7 z850-dropout candidates are available over the HUDF09-1 and HUDF09-2 fields (Bouwens & Illingworth 2006; Bouwens et al. 2008; Wilkins et al. 2011). The first such catalogs were generated based upon the ultra-deep NICMOS parallels to the HUDF (NICP12 and NICP34) and included two z ∼ 7 z850-dropout candidates NICPAR1-3303-4111 and NICPAR2-3308-5229. Of the two candidates, only the first (NICPAR1-3303-4111) is covered by the ultra-deep HUDF09 WFC3/IR observations. The source (originally reported at 03:33:03.81, −27:41:12.1) again makes it into our z850-dropout selection as UDF091z-03791123. Oesch et al. (2009) also utilized the ultra-deep NICMOS data in the NICP12 field for a z ∼ 7 search, but did not report any candidates.
More recently, ultra-deep WFC3/IR observations of the HUDF09-1 and HUDF09-2 fields allow for the selection of larger samples of z ∼ 7 z850 dropouts. Wilkins et al. (2011) performed exactly such a selection. Using a z850 − Y105 > 1 criterion, Wilkins et al. (2011) reported 22 candidates over the two fields to H160, AB ∼ 28.2. While eight of the candidates from Wilkins et al. (2011) make it into our selection, strikingly most of the Wilkins et al. (2011) z ∼ 7 candidates do not make it into our sample. While four of their candidates miss our selection as a result of blending with nearby sources, the most common reason their candidates miss our selection (nine cases) is as a result of their candidates showing apparent detections in the optical B435V606i775 data. For five of the Wilkins et al. (2011) candidates (P34.z.4288, P34.z.3053, P34.z.3990, P34.z.5016, and P34.z.2397), the optical detections are quite prominent, i.e., >1.5σ in >1 band. McLure et al. (2011) also flag the above sources (from Wilkins et al. 2011) as showing quite significant detections in the optical data. From the optical integration times quoted by Wilkins et al. (2011) for the HUDF09-2 field, it is not clear they take full advantage of the available ACS data.
4.1.3. Previous z ≳ 6.5 Galaxy Selections in the ERS Observations
The WFC3/IR ERS observations provide another high-quality, though much shallower, data set, so it is not surprising that catalogs of z ∼ 7 z850 dropouts already exist (Wilkins et al. 2010, 2011). Wilkins et al. (2010, 2011) consider z ∼ 7 searches over the ERS observations using a similar z850-dropout criterion to what we use here (but see Section 3.4). Wilkins et al. (2010, 2011) identified 13 z850-dropout candidates over that area. Strikingly enough, only 2 of their 13 candidates are present in our z850-dropout catalogs (see Table 13).
Most of their sample (11 sources) does not make it into our z850-dropout selection. What is the reason for this? Three of their candidates (zD3, ERS.z.26813, and zD1) miss our color selection due to their having z850 − Y098 colors that are too blue (e.g., ERS.z.26813 is given in Table 20), but seem likely to correspond to z ⩾ 6 galaxies. One other candidate (zD2) was blended with a nearby source and therefore not selected. Another (ERS.z.87326) was too faint in the H160 band to be selected. The remaining six z ∼ 7 candidates from Wilkins et al. (2010, 2011) were not included in our selection since they seem much more likely to correspond to low-redshift galaxies or stars. Five (zD5, ERS.z.45846, ERS.z.20851, ERS.z.47667, and ERS.z.80252) show significant detections in the optical (>1.5σ in ∼2–3 bands) and the sixth (ERS.z.70546; 03:32:27.91, −27:41:04.2) is almost certainly a T dwarf, given its small size (∼01 half-light radius in the WFC3/IR data), SExtractor stellarity parameter (∼0.95; strongly suggesting the source is unresolved), and extremely blue J125 − H160 color (∼ − 0.6).
4.2. Integrity of Our Lyman-break Galaxy Selections
One of the most significant challenges in constructing large samples of z ⩾ 7 galaxies to very faint magnitudes is the limited depth of the optical data. Without deep optical data, it is very difficult to discriminate between bona fide high-redshift galaxies and z ∼ 1–2 galaxies that are simply faint in the optical. How confident are we that we have identified all the contaminants in our selections (or conversely that we have not discarded a substantial number of bona fide z ⩾ 7 galaxies)?
There are two arguments that suggest the situation is largely under control. First, carefully modeling the selection efficiency for each of our dropout samples and fixing the shape of the LF, we can estimate ϕ* for the z ∼ 7 and z ∼ 8 LFs on a field-by-field basis (Section 6.2). If we were misidentifying too many low-redshift galaxies as high-redshift galaxies—or vice versa—we would expect to observe huge fluctuations in the value of ϕ* in precisely those fields with the shallowest optical data. However, we find essentially the same value of ϕ* (within 20%) for each of the three ultra-deep fields we consider (HUDF09, HUDF09-1, and HUDF09-2). This suggests that we have a reasonable handle on contamination in our samples.
Second, we can look at the extent to which our z850-dropout and Y105/Y098-dropout samples show detections in the optical data (quantified here using a χ2opt statistic). If our selections were largely composed of bona fide z ∼ 7–8 galaxies, then we would expect there to be no more sources with positive detections in the optical data than there are negative detections. Indeed, our samples show a similar number of sources with negative and positive detections. See Appendix D.4 for more details.
It is worthwhile noting that much of this discussion will likely be highly relevant to future z ⩾ 7 selections with the James Webb Space Telescope—where the lack of visible imaging of comparable depths may make the selection of z ⩾ 7 galaxies challenging.
5. CONSTRAINTS ON THE REST-FRAME UV LFs AT z ∼ 7 AND z ∼ 8
The large samples of z ∼ 7 and z ∼ 8 galaxies we identified over the wide-area ERS and ultra-deep HUDF09 fields permit us to place powerful constraints on the shape of the UV LF at z ∼ 7 and z ∼ 8. The available constraints are now much stronger than was possible using just the early WFC3/IR data over the HUDF (e.g., Oesch et al. 2010a; McLure et al. 2010).
We begin this section by establishing the UV LF at z ∼ 7 considering both a stepwise (Section 5.1) and Schechter (Section 5.2) representation. In Section 5.3, we move onto a determination of the LF at z ∼ 8.
5.1. z ∼ 7 LF: Stepwise Determinations
We first consider a stepwise determination of the UV LF at z ∼ 7. Stepwise determinations of the UV LF are valuable since they allow for a relatively model-independent determination of the shape of the LF. This ensures that our determinations are not biased to adhere to specific functional forms such as a Schechter function or power law.
Here the stepwise LF ϕk is derived using a very similar procedure to the Efstathiou et al. (1988) stepwise maximum likelihood (SWML) method. With this method, the goal is to find the shape of the LF which is most likely given the observed distribution of magnitudes in our search fields. Since only the shape of the distribution is considered in this approach (and there is no dependence on the volume density of sources), we would expect the LF to be largely insensitive to large-scale structure effects and hence more robust. Previously, we employed this procedure to derive the LFs at z ∼ 4–6 (Bouwens et al. 2007).
In detail, one can write this likelihood as

where

nobserved, i is the observed number of sources in the magnitude interval i, nexpected, j is the expected number of sources in the magnitude interval j, and Π is the product symbol. The above expression gives the likelihood that a given magnitude distribution of sources is observed given a model LF. The expected number of sources nexpected, i is computed from a model LF as

where nexpected, j is the surface density of galaxies in some search with magnitude j, ϕk is the volume density of galaxies with absolute magnitude k, and Vi, j, k is the effective volume over which galaxies in the absolute magnitude interval k are selected with a measured magnitude in the interval j. With the Vi, j, k factors, we implicitly account for the effects of photometric scatter (noise) in the measured magnitudes on the derived LFs—allowing us to account for effects like the Malmquist bias on our LF determinations. The Malmquist bias is known to boost the number of sources near the selection limit, simply as a result of the lower significance sources (≲5σ) scattering into the selection. See Appendix B of Bouwens et al. (2007; see also Bouwens et al. 2008) for a more detailed description of the above maximum likelihood procedure. We elected to use magnitude intervals of width 0.5 mag for our LF determination as a compromise between S/N (i.e., the number of sources in each interval) and resolution in luminosity.
We estimate the selection volumes Vj, k for our LBG selections using the same set of simulations described in Appendix C of this paper. This procedure is the same as used in our many previous LF studies (e.g., Bouwens et al. 2007, 2008, 2010b) and involves taking the pixel-by-pixel profiles of actual HUDF z ∼ 4 B dropouts, inserting them at random positions in the actual observations, and then attempting to select them using the same procedures as we use on the real data (including the χ2opt non-detection criterion we describe in Section 3.3 and Appendix D). The UV-continuum slopes β adopted for the z ∼ 7–8 model galaxies are chosen to match the observed color distribution (Bouwens et al. 2010a). The selection volumes Vi, j, k we derived from these simulations have a very similar form to those shown in Figure 8 of Bouwens et al. (2006) or Figure A2 of Bouwens et al. (2007). We would expect these volumes to be reasonably accurate—since we reproduce both the observed sizes of z ∼ 7–8 galaxies (Appendix A) and the UV-continuum slopes.
Due to its relative insensitivity to large-scale structure effects, the SWML procedure described above only provides us with constraints on the shape of the LF. To provide a normalization for the LF, we require that the total number of z ∼ 7–8 galaxies we predict from Equation (4) in our search fields matches those we actually find (after correcting for contamination; see Table 9 and Appendix B for details on how the precise corrections depend on search field and the luminosity of the sources).
By applying the above maximum likelihood procedure to our ERS, HUDF09, HUDF09-1, and HUDF09-2 z ∼ 7 samples, we derive the stepwise LF at z ∼ 7. The resulting LF is presented in Table 3 and Figure 8 (red circles). The z ∼ 7 LFs inferred from our z ∼ 7 ERS samples alone are shown separately (black squares) to demonstrate the consistency of our derived LFs in both the wide-area and ultra-deep data. Also included in Figure 8 are the LF determinations at z ∼ 7 from two wide-area searches (Ouchi et al. 2009; Bouwens et al. 2010c; see Table 4). These searches are important in establishing the shape of the LF at very high luminosities (≲ −21 AB mag).

Figure 8. Upper: rest-frame UV LF determination at z ∼ 7 determined from the present WFC3/IR z ∼ 7 samples (Section 5.1). The red circles, red downward arrow, and red line show our stepwise LF determination, the 1σ upper limit we have on the bright end of the LF from our WFC3/IR z ∼ 7 searches, and best-fit Schechter LF, respectively. Also included in the upper panel are the LFs derived from a wide-area Subaru Suprime-Cam search (Ouchi et al. 2009), a wide-area NICMOS+ISAAC+MOIRCS search (Bouwens et al. 2010c: see also Mannucci et al. 2007; Stanway et al. 2008; Henry et al. 2009), and a wide-area HAWK-I search (Castellano et al. 2010b). The black squares show the z ∼ 7 LF constraints from the wide-area ERS observations. These match up well with the LF constraints obtained from the deeper HUDF09 observations. The dotted red lines show the approximate asymptotic behavior (linear fit) of the z ∼ 7 LF at the bright and faint ends. Together they illustrate the existence of a likely break in the LF at −20 AB mag. Lower: 68% and 95% confidence intervals on the characteristic luminosity M* and faint-end slope α from our WFC3/IR samples (dotted black lines: Section 5.2). Stronger constraints on M* and α can be obtained by incorporating wide-area z ∼ 7 search results (solid red lines).
Download figure:
Standard image High-resolution imageTable 3. Stepwise Constraints on the Rest-frame UV LF at z ∼ 7 and z ∼ 8 (Sections 5.1 and 5.3)a
| MUV, ABc | ϕk (Mpc−3 mag−1) |
|---|---|
| z dropouts (z ∼ 7) | |
| −21.36 | <0.00002b |
| −20.80 | 0.00016 ± 0.00009 |
| −20.30 | 0.00015 ± 0.00009 |
| −19.80 | 0.00050 ± 0.00021 |
| −19.30 | 0.00104 ± 0.00035 |
| −18.80 | 0.00234 ± 0.00068 |
| −18.30 | 0.00340 ± 0.00096 |
| −17.80 | 0.00676 ± 0.00207 |
| Y dropouts (z ∼ 8) | |
| −21.55 | <0.00001b |
| −20.74 | 0.00011 ± 0.00007 |
| −20.14 | 0.00025 ± 0.00012 |
| −19.54 | 0.00039 ± 0.00017 |
| −18.94 | 0.00103 ± 0.00035 |
| −18.34 | 0.00156 ± 0.00072 |
| −17.74 | 0.00452 ± 0.00207 |
Notes. aThese stepwise LFs are also shown in Figures 8 and 9. bUpper limits here are 1σ (68% confidence). cThe effective rest-frame wavelength is ∼1600 Å for our z ∼ 7 selection and ∼1760 Å for our z ∼ 8 selection.
Download table as: ASCIITypeset image
Table 4. Other Wide-area Searches for z ≳ 7 Galaxies Considered Here
| Instrument | Area | Redshift | Volume | Refa | |
|---|---|---|---|---|---|
| (arcmin2) | Range | 〈z〉 | (Mpc3) | ||
| NICMOS+ | ∼80 | 6.3–8.5 | 7.1 | 1 × 10⁵ | |
| MOIRCS/ISAAC | 248 | 6.5–7.5 | 7.0 | 4 × 10⁵ | 1 |
| Suprime-Cam | 1568 | 6.5–7.1 | 6.8 | 7 × 10⁵ | 2 |
| HAWK-I | ∼151 | 6.5–7.5 | 6.8 | 1 × 10⁵ | 3 |
Note. aReferences: (1) Bouwens et al. 2010c; (2) Ouchi et al. 2009; (3) Castellano et al. 2010a, 2010b.
Download table as: ASCIITypeset image
5.2. z ∼ 7 LF: Representation with a Schechter Parameterization
In the present section, we consider representations of the z ∼ 7 LF with a Schechter parameterization ( ). This parameterization features an exponential cutoff at high luminosities and a power-law shape at fainter luminosities. Such a parameterization has been almost universal in characterizing the shape of the galaxy LF since it works so well. From the results of the previous section (e.g., Figure 8), it also appears to be relevant in describing the LF of z ∼ 7 galaxies.
As with our stepwise LF determinations, we use a maximum likelihood approach that considers only the shape of the LF in deriving the best-fit Schechter parameters. The approach is analogous to that developed by Sandage et al. (1979), but is formulated in terms of the apparent magnitude distribution (see Section 3.1 of Bouwens et al. 2007). The approach has the important advantage that it is almost entirely insensitive to large-scale structure effects (see Appendix C of Bouwens et al. 2007).
To perform this likelihood analysis, we start with various Schechter parameter combinations, calculate the equivalent stepwise LF ϕk's (adopting 0.1 mag bins), and then make use of Equations (2) and (4). This technique allows us to set constraints on the characteristic luminosity M* and faint-end slope α. The lower panel of Figure 8 (dotted black lines) shows the 68% and 95% confidence intervals we are able to obtain on the z ∼ 7 LF.
Inspecting this lower panel, we see that there is a large degree of freedom in the Schechter parameters M* and α allowed by our search results. The principal reason for this latitude (which occurs despite the large number of sources and large luminosity range) lies in the almost featureless power-law shape exhibited by the LF at z ∼ 7 (Figure 8, top panel). This restricts us to characteristic luminosities M* brighter than ∼ − 19.7 and approximate power-law slopes α of −2.0.
To obtain much tighter constraints on the Schechter parameters α and M*, we need to incorporate observations which allow us to resolve more distinct features in the LF (e.g., the expected break at brighter magnitudes that is not apparent in our small-area HUDF09+ERS data sets). Such constraints can be obtained by combining our WFC3/IR results with wide-area searches (e.g., Ouchi et al. 2009; Castellano et al. 2010a, 2010b; Bouwens et al. 2010c) which more effectively probe the rarer sources found at the bright end of the LF. Such searches have consistently found a distinct falloff in the volume density of z ∼ 7 sources at bright magnitudes (e.g., upper panel in Figure 8). Several of the most notable wide-area z ∼ 7 searches (Table 4) include a ∼85 + 248 arcmin2 search with NICMOS and ISAAC/MOIRCS by Bouwens et al. (2010c; see also Mannucci et al. 2007; Stanway et al. 2008; Henry et al. 2009), a ∼150 arcmin2 search with VLT HAWK-I by Castellano et al. (2010b; but see also Castellano et al. 2010a and Hickey et al. 2010), and a 1568 arcmin2 search with Subaru Suprime-Cam by Ouchi et al. (2009). The mean redshift expected for these samples is typically ∼6.8–7.0, which is comparable to that for the present WFC3/IR z850-dropout selections.
Combining the wide-area z ∼ 7 search results with those available from the ultra-deep WFC3/IR observations, we arrive at much tighter constraints on M* and α. The best results are M* = −20.14 ± 0.26 and α = −2.01 ± 0.21 and are presented in the lower panel to Figure 8 with the solid red lines. In combining the wide-area search results with the WFC3/IR results (where the overlap in identified z ∼ 7 candidates is minimal), we find it convenient to modify our LF estimation methodology so that the likelihood incorporates information on the volume density of the LF (and not simply its shape)—comparing the volume density of the sources found with what is expected from a model LF. As in our Bouwens et al. (2008) LF analysis, likelihoods are computed assuming Poissonian statistics. We verified that the 68% and 95% likelihood contours we compute for the WFC3/IR search results reproduced those calculated using the STY method.
It is trivial for us to extend the present analysis to constrain the normalization ϕ* of the Schechter function. Utilizing the wide-area and ultra-deep WFC3 search results, we find a ϕ* of 0.86+0.70−0.39 × 10⁻³ Mpc−3. Together with the best-fit values of α and M*, we conveniently include these parameters in Table 5. The effects of large-scale structure add somewhat to the uncertainties on ϕ*. Given that most of the sources which contribute to the faint counts in the LF are from the CDF-South, we estimate that the added uncertainty is 25% on ϕ*—which corresponds to the sample variance expected assuming a ∼100 arcmin2 search area (the approximate area within the CDF-South where our fields are found), a redshift selection volume of width Δz ∼ 0.8 (from Figure 4), and a bias factor of ∼5 (corresponding to halo volume densities of ∼10−3 Mpc−3). These estimates were made using the Trenti & Stiavelli (2008) cosmic variance calculator (see also Section 6.2).
Table 5. Determinations of the Best-fit Schechter Parameters for the Rest-frame UV LFs at z ∼ 7 and z ∼ 8 and at z ∼ 4, 5, 6 from Bouwens et al. (2007)
| Dropout | Redshift | M*UVa | ϕ* (10−3 | α |
|---|---|---|---|---|
| Sample | Mpc−3) | |||
| z | 6.8 | −20.14 ± 0.26 | 0.86+0.70−0.39 | −2.01 ± 0.21 |
| Yb | 8.0 | −20.10 ± 0.52 | 0.59+1.01−0.37 | −1.91 ± 0.32 |
| B | 3.8 | −20.98 ± 0.10 | 1.3 ± 0.2 | −1.73 ± 0.05 |
| V | 5.0 | −20.64 ± 0.13 | 1.0 ± 0.3 | −1.66 ± 0.09 |
| i | 5.9 | −20.24 ± 0.19 | 1.4+0.6−0.4 | −1.74 ± 0.16 |
Notes. aValues of M*UV are at 1600 Å for the Bouwens et al. (2007) z ∼ 4, z ∼ 5, and z ∼ 7 LFs, at ∼1350 Å for the Bouwens et al. (2007) z ∼ 6 LF, and at ∼1750 Å for our constraints on the z ∼ 8 LF. Since z ∼ 6–8 galaxies are blue (β ∼ −2; Stanway et al. 2005; Bouwens et al. 2006, 2009, 2010a), we expect the value of M*UV to be very similar (≲ 0.1 mag) at 1600 Å to its value quoted here. bThe derived Schechter parameters depend significantly on whether we include or exclude the two brightest (∼26 AB mag) z ∼ 8 galaxies in the HUDF09-2 field. If we exclude the two brightest galaxies (assuming they represent a rare overdensity), we derive a significantly fainter characteristic luminosity M* and larger normalization ϕ*: M* = −19.54 ± 0.56, ϕ* = 1.5+2.9−1.0 × 10⁻³ Mpc−3, and α = −1.67 ± 0.40.
Download table as: ASCIITypeset image
Of course, the volume density ϕ* in the Schechter parameterization shows a significant covariance with both the characteristic luminosity and faint-end slope α, and so there is considerable freedom in the Schechter parameters that can fit current search results. We present the likelihood contours on ϕ* and the other two Schechter parameters in Section 7.1.
5.3. z ∼ 8 LF
We now derive the LF at z ∼ 8 based upon the z ∼ 8 selections presented in Sections 3.2 and 3.4. As expected, we will find that the z ∼ 8 LF is less well determined than that at z ∼ 7, but it is still striking to find very interesting constraints from the combined HUDF09+ERS data sets.
We use the same procedure for deriving the stepwise LF and Schechter parameters at z ∼ 8 as we had earlier used at z ∼ 7. We base our LF determinations on our combined HUDF09 + ERS z ∼ 8 selections, but also fold in the null results from a shallow, ∼150 arcmin2 Y-dropout search over the CDF-South, Bremer Deep Field (BDF), and NTTDF (Castellano et al. 2010b). Finally, to account for the fact that the mean redshift of our wide-area ERS z ∼ 8 selection is Δz ∼ 0.2 lower than for our HUDF09 z ∼ 8 selection, we adjust the volume densities implied by the ERS search downward by a factor of 1.15 (which we derive from a fit to the stepwise UV LF evolution from z ∼ 6 to z ∼ 4). We use 0.6 mag intervals for the stepwise LFs at z ∼ 8 because of the fewer sources in z ∼ 8 samples.
Our results are presented in Table 3 and Figure 9 (red points and upper limits; both the HUDF09 and the ERS observations are incorporated into the red circles). Also included in this figure are our z ∼ 8 LF using only the ERS observations. Not surprisingly, given the general form of the LFs at z ∼ 4–7, the z ∼ 8 LF maintains an approximate power-law form over a ∼3 mag range (red points), with a steep faint-end slope. Brightward of −21 AB mag, the LF appears to cut off somewhat. This cutoff is clear not only in the upper limits we derive for the volume density of luminous sources (red and green downward arrows from WFC3/IR and HAWK-I searches, respectively), but also in the z ∼ 8 ERS results (black squares).

Figure 9. Upper: rest-frame UV LF at z ∼ 8 (see Section 5.3). The red circles show the stepwise LF for the WFC3/IR HUDF09+ERS z ∼ 8 sample. The red downward arrow shows the 1σ upper limit on the bright end of the LF from our WFC3/IR z ∼ 8 search. The black points show the stepwise LF at z ∼ 8 derived from the z ∼ 8 ERS search. The dashed black line shows the best-fit power-law representation while the red line is for the Schechter fit. The faint-end slope α for the z ∼ 7 LF (α = −2.01) is indicated on this figure with the dotted red line. The dotted blue line shows the approximate cutoff observed at the bright end of z ⩽ 7 LFs. The green upper limit (at −22.25 mag) is based upon a recent wide-area z ∼ 8 Y-dropout HAWK-I search (Castellano et al. 2010b). See also the caption to Figure 8. Note that the brightest points in our z ∼ 8 LF are significantly affected by the three bright sources in the HUDF09-2 field (compare the brightest red point with the black square: based upon the ERS search). Lower: 68% and 95% maximum likelihood contours on the characteristic luminosity M* and the faint-end slope α inferred for the LF at z ∼ 8.
Download figure:
Standard image High-resolution imageNonetheless, sufficiently small area has been probed at present that the bright end of the z ∼ 8 LF remains fairly uncertain, and indeed there is significant field-to-field variation across our fields. The most notable case is over the HUDF09-2 field where four bright H160, AB ⩽ 27 z ∼ 8 galaxy candidates are found, two lying within 3'' of each other (UDF092y-03781204, UDF092y-03751196) and a third H160 ∼ 27 candidate within 30'' (UDF092y-04640529; see Table 16), each of which have similar Y105 − J125 colors and presumably redshifts. As a result of such variations, the bright end of the z ∼ 8 LF is understandably still quite uncertain, with some differences between that derived from the ERS observations alone (black squares) and from the combined HUDF09 + ERS results (red circles).
Despite the still somewhat sizeable uncertainties, we can model the z ∼ 8 LF using a Schechter function and derive constraints on the relevant parameters. Formal fits yield best-fit Schechter parameters of α = −1.91 ± 0.32, M* = −20.10 ± 0.52, and ϕ* = 0.59+1.01−0.37 × 10⁻³ Mpc−3 for the z ∼ 8 LF.11 Though the significance is only modest, Schechter fits to the z ∼ 8 results (red line in Figure 9) are preferred at 2σ over fits to a power law (dashed line). The implications of such steep faint-end slopes are discussed below, but we caution against giving too much weight to these slopes at this time, given the current large uncertainties. Table 5 gives a compilation of these parameters, along with a comparison with Schechter determinations at other redshifts. The trends of the Schechter parameters with redshift are also discussed more broadly below.
6. ROBUSTNESS OF LF RESULTS
6.1. Comparison with Previous LF Determinations
6.1.1. z ∼ 7 LF
A large number of different determinations of the UV LFs at z ∼ 7 now exist (Bouwens et al. 2008; Oesch et al. 2009, 2010a; Ouchi et al. 2009; McLure et al. 2010; Castellano et al. 2010a, 2010b; Capak et al. 2011; Wilkins et al. 2011). Stepwise determinations of the LF from these studies are presented in Figure 10. The corresponding Schechter parameters are given in Table 6.

Figure 10. Rest-frame UV LF determinations for galaxies at z ∼ 7 (Section 6.1.1). Shown are the UV LF from this paper (red circles and red downward arrow) and from Bouwens et al. (2010c, open red circles), Oesch et al. (2010a, purple circles), Ouchi et al. (2009, black squares), Castellano et al. (2010b, green squares), McLure et al. (2010, blue squares), and Bouwens et al. (2008, black crosses). Constraints from Wilkins et al. (2011) are similar, but are not shown to reduce confusion. See Table 6 for a comparison of the Schechter parameters derived here for the z ∼ 7 UV LF with those found in other analyses.
Download figure:
Standard image High-resolution imageTable 6. Determinations of the Best-fit Schechter Parameters for the Rest-frame UV LFs at z ∼ 7 (Section 6.1.1; see also Figure 10)
| Reference | M*UV | ϕ* (10−3 Mpc−3) | α |
|---|---|---|---|
| This work | −20.14 ± 0.26 | 0.86+0.70−0.39 | −2.01 ± 0.21 |
| Castellano et al. (2010a) | −20.24 ± 0.45 | 0.35+0.16−0.11 | −1.71 (fixed) |
| McLure et al. (2010) | −20.04 | 0.7 | −1.71 (fixed) |
| Oesch et al. (2010a) | −19.91 ± 0.09 | 1.4 (fixed) | −1.77 ± 0.20 |
| Ouchi et al. (2009) | −20.1 ± 0.76 | 0.69+2.62−0.55 | −1.72 ± 0.65 |
| Oesch et al. (2009) | −19.77 ± 0.30 | 1.4 (fixed) | −1.74 (fixed) |
| Bouwens et al. (2008) | −19.8 ± 0.4 | 1.1+1.7−0.7 | −1.74 (fixed) |
Download table as: ASCIITypeset image
It is instructive to compare the present LF determination at z ∼ 7 with those previously available. We begin with those studies where the primary focus was on the search for luminous, rarer z ∼ 7 galaxies (e.g., Ouchi et al. 2009; Castellano et al. 2010a, 2010b; Wilkins et al. 2010; Bouwens et al. 2010c). Perhaps the simplest point of comparison is the volume density of luminous (∼ − 21 AB mag) galaxies at z ∼ 7 relative to that at z ∼ 6. Ouchi et al. (2009), Bouwens et al. (2010c), and Wilkins et al. (2010) find a factor of two decrease in the volume density of luminous (−21 AB mag) galaxies over this interval, while Castellano et al. (2010a, 2010b) find a factor of ∼3.5 decrease.12 In the present search, we find a similar factor of ∼1.8 decrease at the bright end of the LF (i.e., −20.5 AB mag).
At fainter magnitudes, our HUDF09 search fields are essentially unique in the constraints they provide on the UV LF at z ∼ 7. Nonetheless, it is useful to compare against previous work, particularly from the early ultra-deep WFC3/IR pointing. Our results at −19 AB mag are in good agreement with the UV LF of Oesch et al. (2010a), but are somewhat higher than those found by McLure et al. (2010).
Most studies find best-fit values of M* and ϕ* at z ∼ 7 that are slightly fainter and of lower density than is found at z ∼ 4–6 (Bouwens et al. 2008; Oesch et al. 2009; Ouchi et al. 2009; Oesch et al. 2010a; McLure et al. 2010; Castellano et al. 2010a, 2010b). In the present study, we find something similar. The M* we find at z ∼ 7 is fainter than the z ∼ 6 value (Bouwens et al. 2007) by ∼0.1 mag and the ϕ* we find at z ∼ 7 is lower by a factor of ∼1.8. Of course, ϕ* and M* are sufficiently degenerate at z ∼ 7 that there is a modest tradeoff between the evolution found in either parameter.
The faint-end slope to our UV LF is steep with α = −2.01 ± 0.21. Previously, it was not possible to set tight constraints on the faint-end slope. Ouchi et al. (2009) estimated a slope α of −1.72 ± 0.65 while Oesch et al. (2010a)—fixing ϕ* to 0.0014 Mpc−3—found −1.77 ± 0.20. The present values of the faint-end slope are consistent with those measured at z ∼ 4–6 where this slope was also found to be steep at α ∼ −1.7 (Bouwens et al. 2007; Oesch et al. 2007; Yoshida et al. 2006; Yan & Windhorst 2004). This new result may suggest a possible steepening toward higher redshifts z ≳ 7, but the significance is weak, i.e., ∼1.5σ. Such a steepening is expected in many theoretical models (e.g., Salvaterra et al. 2011; Trenti et al. 2010; Jaacks et al. 2011). Clearly we will require deeper data to confirm this trend.
Capak et al. (2011) have suggested that the z ∼ 7 LF may extend to substantially brighter magnitudes than have been considered by other groups. Performing follow-up spectroscopy on three very bright (H ∼ 23 mag) z ∼ 7 candidates over the COSMOS field, Capak et al. (2011) claim to have uncovered statistically significant detections of line flux. These lines could represent possible Lyα emission given the existence of strong continuum breaks in the sources. If this is the explanation, these sources would imply that the UV LF at z ∼ 7 extends to very bright magnitudes indeed, i.e., −24 AB mag, and in fact the LF that such sources would suggest is essentially power law in shape.
What should we make of this intriguing possibility? First, such an LF would seem to violate the constraints on the bright end of the LF set by deep, wide-area searches for z ∼ 7 galaxies (Ouchi et al. 2009; Bouwens et al. 2010c; Castellano et al. 2010a, 2010b). Second, it is difficult to understand how one might create such bright −24 AB mag sources in the UV. The challenge is that any source forming stars rapidly enough to be so bright in the UV (i.e., ∼200 M☉ yr−1) would most likely have built up sufficient quantities of dust and metals to be quite optically thick in the UV. Under such circumstances, it is unlikely that the source would be brighter than ∼−22 AB mag. Such is the situation at significantly later times (z ∼ 2–3) where there are exceedingly few systems with UV magnitudes brighter than ∼ − 23 (e.g., Reddy et al. 2008), but many ULIRGs (e.g., Chapman et al. 2005). It is hard to imagine, therefore, that at z ∼ 7, just 500–600 Myr after the first stars, there is a population of galaxies that are substantially brighter in the UV than at z ∼ 3. Additional work utilizing deeper spectroscopic and photometric data is clearly required.
6.1.2. z ∼ 8 LF
There are also several published determinations of the UV LF at z ∼ 8. These LFs are presented in stepwise form in Figure 11. Schechter parameters for these LFs are given in Table 7. In general, the present z ∼ 8 LF determination is in good agreement with previous determinations, within the quoted errors—though the present z ∼ 8 LF is a little higher than the McLure et al. (2010) result at the lowest luminosities.

Figure 11. Rest-frame UV LF determinations for galaxies at z ∼ 8 (Section 6.1.2). Shown are the UV LF from this paper (solid red circles and red upper limits) and from Bouwens et al. (2010b, black open circles and black upper limits) and McLure et al. (2010, blue squares). LF estimates from Lorenzoni et al. (2011) are similar. Also presented is the 1σ upper limit from Castellano et al. (2010b, green downward arrow). See Table 7 for a comparison of the Schechter parameters derived here for the z ∼ 7 UV LF with those found in other analyses.
Download figure:
Standard image High-resolution imageTable 7. Determinations of the Best-fit Schechter Parameters for the Rest-frame UV LFs at z ∼ 8 (Section 6.1.2; see also Figure 11)
| Reference | M*UV | ϕ* (10−3 Mpc−3) | α |
|---|---|---|---|
| This worka | −20.10 ± 0.52 | 0.59+1.01−0.37 | −1.91 ± 0.32 |
| McLure et al. (2010) | −20.04 | 0.35 | −1.71 (fixed) |
| Bouwens et al. (2010b) | −19.5 ± 0.3 | 1.1 (fixed) | −1.74 (fixed) |
| Lorenzoni et al. (2011) | −19.5 | 0.93 | −1.7 (fixed) |
Notes. aThe derived Schechter parameters depend significantly on whether we include or exclude the two brightest (∼26 AB mag) z ∼ 8 galaxies in the HUDF09-2 field. If we exclude the two brightest galaxies (assuming they represent a rare overdensity), we derive a significantly fainter characteristic luminosity M* and larger normalization ϕ*: M* = −19.54 ± 0.56, ϕ* = 1.5+2.9−1.0 × 10⁻³ Mpc−3, and α = −1.67 ± 0.40 (similar to the values found by Bouwens et al. 2010b and Lorenzoni et al. 2011).
Download table as: ASCIITypeset image
For the derived Schechter parameters (see Table 7), we find an M* of −20.10 ± 0.52, a ϕ* of 0.59+1.01−0.37 × 10⁻³ Mpc−3, and faint-end slope α = −1.91 ± 0.32. These M* and ϕ* values are somewhat brighter and lower, respectively, than what we find at z ∼ 6 and z ∼ 7. This might indicate that some of the evolution in the UV LF from z ∼ 8 to z ≲ 6 can be represented by a change in the volume density ϕ*. However, the uncertainties on ϕ* and M* are too large to be sure of these conclusions. In particular, the existence of a possible overdensity at z ∼ 8 within the HUDF09-2 field (see Section 5.3) illustrates the challenges of establishing reliable parameters from these initial data sets.
6.2. Large-scale Structure Uncertainties
One of the most important challenges for LF determinations is large-scale structure. Variations in the volume density of galaxies as a function of position can have a significant impact on both the shape and overall normalization of the derived LFs. As a result of our use of the SWML and STY procedures (Efstathiou et al. 1988; Sandage et al. 1979) to derive the LF, the impact of large-scale structure on the shape of our LF should be minimal. On the other hand, we would expect this structure to have an effect on the overall normalization of our LFs. One can estimate the size of these uncertainties using the Trenti & Stiavelli (2008) cosmic variance calculator. Using the approximate volume densities ∼5 × 10⁻³ Mpc−4 we derived for z ∼ 7–8 sources, the width of our redshift selection windows Δz ∼ 1, and the 10' × 10' search geometry we use within the CDF-South, we find that the uncertainty in the normalization of the LF at z ∼ 7 and z ∼ 8 is a very modest ∼25% and ∼20%, respectively.
Large-scale structure variations can also have an effect on the faint-end slope α determinations as a result of mass-dependent (and hence likely luminosity-dependent) bias parameters (e.g., Robertson 2010). We estimate the luminosity-dependent bias parameters based upon the approximate halo masses that correspond to the volume density of sources we are probing at specific points in the LF (again using the Trenti & Stiavelli 2008 calculator). We then perturb the LFs using these bias parameters and the power spectrum at z ≳ 7 and determine the effect on the faint-end slope α. We find that large-scale structure introduces a 1σ uncertainty of ∼0.05 in our faint-end slope determinations α at z ∼ 7 and z ∼ 8.
We can also look at the issue of field-to-field variations from a more empirical standpoint. Fixing the shape of the UV LFs at z ∼ 7 and z ∼ 8 to the best-fit α and M*, we can look at the variations in the normalization ϕ* for our three HUDF09 fields. We find a 1σ variation in ϕ* of just ∼20%. This is similar to what we would expect from the Poissonian uncertainties. This suggests that large-scale structure uncertainties do not pose an especially huge problem for LF determinations in the current luminosity range (−21 AB to −18 AB mag).
Thus, the impact of large-scale structure on our z ∼ 7 and z ∼ 8 LFs appears to be quite modest.
7. DISCUSSION
7.1. Evolution of the UV LF from z ∼ 8 to z ∼ 4
In Section 5, we derived detailed constraints on the UV LFs at z ∼ 7 and z ∼ 8. By comparing these LFs with those derived at z ∼ 4–6, we can examine the evolution with cosmic time. In Figure 12, we compare the stepwise LFs derived at z ∼ 7 and z ∼ 8 with those found at z ∼ 4–6. The z ∼ 7 LF presented in Figure 12 incorporates the wide-area NICMOS + ISAAC + MOIRCS z ∼ 7 search results from Bouwens et al. (2010c; see the LFs in Figure 10). It is remarkable how uniform the evolution of the UV LF is with cosmic time. At higher luminosities (−20 AB mag), the UV LF evolves by a factor of ∼6–7 from z ∼ 8 to z ∼ 4 while at lower luminosities (−18 AB mag), the decrease is a factor of ∼5.

Figure 12. Rest-frame UV LFs derived for galaxies at z ∼ 7 (magenta circles with 1σ errors) at z ∼ 8 (open red circles), compared against similar LF determinations at z ∼ 4 (blue), z ∼ 5 (green), and z ∼ 6 (cyan) from Bouwens et al. (2007). The z ∼ 7 LF results incorporate the Bouwens et al. (2010c) NICMOS + ISAAC + MOIRCS search results (see Figure 10). The upper limits are 1σ. The magenta and red lines show the best-fit Schechter functions at z ∼ 7 and z ∼ 8. The uniformly steep faint-end slopes α of the UV LF are quite apparent. Most of the evolution in the UV LF from z ∼ 8 to z ∼ 4 appears to be in the characteristic luminosity (by ∼1 mag).
Download figure:
Standard image High-resolution imageFigure 13 presents the 68% and 95% confidence intervals derived here for the UV LF at z ∼ 7 and z ∼ 8. For comparison, the LFs at z ∼ 4, z ∼ 5, and z ∼ 6 are also shown so that the evolution can readily be inferred. A clear trend is evident in the M*/ϕ* LF fit results (left panel) from z ∼ 8 to z ∼ 4. The characteristic luminosity shows evidence for a consistent brightening with cosmic time from z ∼ 7 to z ∼ 4. Ascertaining how the ϕ* and M* evolves out to z ∼ 8 is not possible at present, given the large uncertainties and degeneracy between these two parameters (though there is a hint that some of the evolution may be in ϕ*; see also the discussion in McLure et al. 2010). Tighter constraints on the volume density of bright z ∼ 8 galaxies are required for progress on this question.

Figure 13. 68% and 95% likelihood contours on the model Schechter parameters for our UV (rest-frame ∼1700 Å) LF determination at z ∼ 7 (magenta lines) and z ∼ 8 (dotted red lines). For comparison, we also include the LF determinations at z ∼ 4 (blue lines), z ∼ 5 (green lines), and z ∼ 6 (cyan lines) from Bouwens et al. (2007). We do not include the z ∼ 8 contours in the center and right panels given the large uncertainties on the z ∼ 8 Schechter parameters. It is striking how uniform the rate of evolution in the UV LF (left and middle panels) is as a function of redshift—though there is a significant degree of degeneracy between ϕ* and M*. Most of the evolution in the LF appears to be in M* (particularly from z ∼ 7 to z ∼ 4). Within the current uncertainties, there is no evidence for evolution in ϕ* or α (rightmost panel).
Download figure:
Standard image High-resolution image
Figure 14. Derived faint-end slope α to the UV LF vs. redshift. The present constraints on α are shown as the large solid red circles, with the 1σ uncertainties plotted as the error bars. The values of α derived at z ∼ 4–6 (Bouwens et al. 2007; but see also Yoshida et al. 2006; McLure et al. 2009) are plotted as the open red circles. Other determinations are from Oesch et al. (2010a, blue circles; see also Hathi et al. 2010), Reddy & Steidel (2009, green squares), Arnouts et al. (2005, blue crosses), Wyder et al. (2005, blue squares), Treyer et al. (1998, black open circle), and Oesch et al. (2007, 2010a, green crosses). While the current constraints on the faint-end slope α at z ∼ 7 and z ∼ 8 are of limited statistical weight (see also Ouchi et al. 2009; Oesch et al. 2010a), they suggest the faint-end slope α is at least as steep as −1.7—and possibly as steep as ∼ − 2.0 (Sections 5.2 and 5.3). We remark that the derived slopes simply describe the shape of the LF to several magnitudes below L*. Thus, slopes that are even steeper than −2 do not imply a divergent luminosity density (since the LF will cut off at some faint value).
Download figure:
Standard image High-resolution imageAs far as constraints on the shape of the LF (middle panel), again we see a clear trend toward fainter values of M* from z ∼ 7 to z ∼ 4. The faint-end slope α at z ∼ 7 and z ∼ 8 also is very steep, similar to the values α ∼ −1.7 found at z ∼ 2–6 (Figure 15) and possibly even steeper. This possible steepening of the LF with redshift is in qualitative agreement with that predicted from various theoretical models for the LF (e.g., Trenti et al. 2010; Salvaterra et al. 2011; Bouwens et al. 2008). Such steep faint-end slopes are potentially very important for reionization since it would suggest that low luminosity galaxies at z ≳ 7 are major contributors to the needed UV ionizing photon flux. We discuss this in detail in Bouwens et al. (2011b).
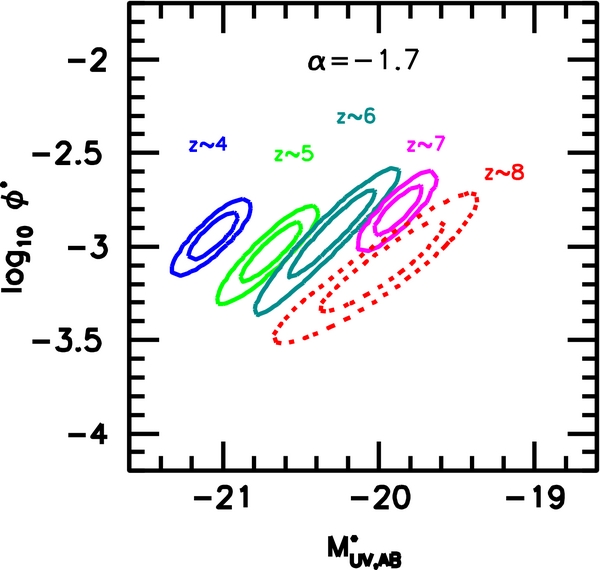
Figure 15. 68% and 95% likelihood contours on the model Schechter parameters M* and ϕ* for our LF determination at z ∼ 7 (magenta lines) and z ∼ 8 (dotted red lines). For comparison, we also show the constraints on the UV LF at z ∼ 4 (blue lines), z ∼ 5 (green lines), and z ∼ 6 (cyan lines) from Bouwens et al. (2007). This figure is the same as the left panel to Figure 13, but now fixing the faint-end slope α to −1.7. A faint-end slope α of −1.7 is similar to the values found at z ∼ 1–6 (Yoshida et al. 2006; Bouwens et al. 2007; Oesch et al. 2007, 2010c; McLure et al. 2009; Reddy & Steidel 2009; Arnouts et al. 2005; see Figure 14). No constraint on the faint-end slope at z ∼ 4–6 is imposed, and therefore the error contours there are somewhat larger than at z ∼ 7.
Download figure:
Standard image High-resolution imageNo strong trends are evident as a function of redshift in ϕ* and α considered together (Figure 13, right panel). However, the uncertainties remain large at z ∼ 7 and z ∼ 8. Given these uncertainties, we can potentially gain more insight into the evolution of the LF at high redshift by fixing the faint-end slope α to −1.7. The faint-end slope α is found to be consistent with this value over a very wide redshift range z ∼ 1–8 (Bouwens et al. 2007; Reddy & Steidel 2009; Beckwith et al. 2006; McLure et al. 2009; Ouchi et al. 2009; Oesch et al. 2007, 2010a, 2010c), so it seems reasonable to fix α to −1.7 at z ∼ 7 and z ∼ 8. The constraints we derive on M* and ϕ* fixing α are shown in Figure 15. This figure provides further support to the suggestion that the primary mode of evolution in the LF from z ∼ 7 to z ∼ 4 is in the characteristic luminosity (see also Bouwens et al. 2006, 2007; Yoshida et al. 2006; McLure et al. 2009). For z ∼ 8 LF, the normalization is somewhat lower—suggesting that some of the evolution in the LF at z ⩾ 4 may be in volume density (e.g., McLure et al. 2009; Castellano et al. 2010b).
7.2. Shape of the UV LF at z ∼ 7 and z ∼ 8
One potentially important open question about the UV LFs at z ⩾ 7 concerns their overall shape (e.g., see discussion in Section 5.5 of Bouwens et al. 2008). While we have generally attempted to represent the LFs here with Schechter functions (i.e., a power law with an exponential cutoff at the bright end; see Sections 5.2 and 5.3), it is possible that the LFs may have a shape closer to that of a power law, e.g., resembling the halo mass function (e.g., Douglas et al. 2009). This is simply because at the high redshifts we are probing the typical halo masses would be much lower (<1012 M☉) and therefore many of the physical mechanisms likely to be important for truncating the LFs at z ∼ 0 (e.g., transition to hot flows: Birnboim & Dekel 2003; Rees & Ostriker 1977; Binney 1977; Silk 1977 or AGN feedback: Croton et al. 2006) may not be as relevant at z ≳ 8. Of course, at sufficiently high redshifts (i.e., z ≳ 7), we would eventually expect some truncation in the LF at high masses (and luminosities) due to a similar exponential cutoff in the halo mass function (e.g., Trenti et al. 2010).
Overall, we do not find any evidence that the UV LF at z ∼ 7 or z ∼ 8 has a fundamentally different shape than the LF has at lower redshift. Both LFs seem to have roughly a power-law-like shape at the faint end and a modest cutoff at the bright end—consistent with that of a Schechter function (though the evidence for such a cutoff in the z ∼ 8 LF is weak). Ascertaining whether the LF really has a Schechter-like form or has a tail extending to bright magnitudes (e.g., Capak et al. 2011) will require significantly more statistics, particularly at bright magnitudes, to better establish the shape of the LF there. Fortunately, we should soon have such statistics as a result of observations being obtained over the GOODS fields as part of the CANDELS multi-cycle treasury program, the wide-area SEDS/CANDELS fields, and two pure parallel programs (Trenti et al. 2011; Yan et al. 2011).
7.3. Luminosity Densities and SFR Densities
With the completion of the wide-area ERS and ultra-deep HUDF09 observations, we have been able to significantly improve our constraints on the UV LFs at z ∼ 7 and z ∼ 8. These new LF determinations allow us to update our luminosity density and SFR density estimates at z ∼ 7–8 from those already given in Bouwens et al. (2010b) based on the initial HUDF09 data on the HUDF. These densities continue to be of great interest for discussions about the role of galaxies in reionization as well as the buildup of stellar mass.
For our luminosity density (and SFR density) estimates, we simply integrate up our stepwise LF determinations to the limiting depth of our LF determinations, i.e., to −17.7 AB mag (0.05 L*z = 3). The resultant luminosity densities are tabulated in Table 8. They are also shown in Figure 16 along with luminosity density determinations at lower redshift.

Figure 16. Luminosity density and SFR density determinations, as a function of redshift (Section 7.3). These determinations are integrated to −17.7 AB mag (0.05 L*z = 3). The lower set of points (blue for our measurements) and shaded blue region are the observed luminosity densities and SFR density estimates before dust correction. The upper set of points (red for our measurements) and shaded orange region indicates the SFR density estimates after dust correction. The SFR density estimates assume ≳ 100 Myr constant SFR and a Salpeter IMF. Conversion to a Kroupa (2001) IMF would result in a factor of ∼1.7 (0.23 dex) decrease in the SFR density estimates given here. At z ≲ 2 dust corrections are from Schiminovich et al. (2005), at z ∼ 3–6 from Bouwens et al. (2009b), and at z ≳ 7 they are assumed to be zero. The solid circles at z ∼ 7 and z ∼ 8 are the present determinations. For context, we have also included the SFR density estimates at z ∼ 4–6 from Bouwens et al. (2007), at z ∼ 2–3 from Reddy & Steidel (2009, green crosses), and at z ≲ 2 from Schiminovich et al. (2005, black squares). The estimates at z ∼ 10 (Bouwens et al. 2011) are given with the blue circles and upper limit. See Table 8 for a tabulation of the z ≳ 4 luminosity densities and SFR densities presented here.
Download figure:
Standard image High-resolution imageTable 8. UV Luminosity Densities and Star Formation Rate Densities to −17.7 AB maga
| Dropout | 〈z〉 |  |
log10 SFR density | |
|---|---|---|---|---|
| Sample | (erg s−1 | (M☉ Mpc−3 yr−1) | ||
| Hz−1 Mpc−3) | Uncorrected | Correctedb | ||
| z | 6.8 | 25.88 ± 0.10 | −2.02 ± 0.10 | −2.02 ± 0.10 |
| Y | 8.0 | 25.65 ± 0.11 | −2.25 ± 0.11 | −2.25 ± 0.11 |
| Jd | 10.3 | 24.29+0.51−0.76 | −3.61+0.51−0.76 | −3.61+0.51−0.76 |
| Jd | 10.3 | <24.42c | <−3.48c | <−3.48c |
| B | 3.8 | 26.38 ± 0.05 | −1.52 ± 0.05 | −0.90 ± 0.05 |
| V | 5.0 | 26.08 ± 0.06 | −1.82 ± 0.06 | −1.57 ± 0.06 |
| i | 5.9 | 26.02 ± 0.08 | −1.88 ± 0.08 | −1.73 ± 0.08 |
Notes. aIntegrated down to 0.05 L*z = 3. Based upon LF parameters in Table 5 (see Section 7.3). The SFR density estimates assume ≳ 100 Myr constant SFR and a Salpeter IMF (e.g., Madau et al. 1998). Conversion to a Kroupa (2001) IMF would result in a factor of ∼1.7 (0.23 dex) decrease in the SFR density estimates given here. bThe dust correction is taken to be 0 for galaxies at z ∼ 7–8, given the very blue β's (see also Bouwens et al. 2009, 2010a; Oesch et al. 2010a). cUpper limits here are 1σ (68% confidence). dz ∼ 10 determinations and limits are from Bouwens et al. (2011) and assume 0.8 z ∼ 10 candidates in the first case and no z ∼ 10 candidates (i.e., an upper limit) in the second case.
Download table as: ASCIITypeset image
The luminosity density determinations are converted into SFR densities using the Madau et al. (1998) conversion factor—assuming a Salpeter initial mass function (IMF; with a stellar mass function ranging from 0.1 M☉ and 125 M☉). As often noted (e.g., Verma et al. 2007; Stanway et al. 2005; Bouwens et al. 2009), this conversion factor assumes that the SFRs in galaxies are relatively constant for ≳ 100 Myr prior to observation. Consequently, use of this conversion would result in an underestimate of the SFR (by factors of ∼2) for galaxies with particularly young ages.
Given the very blue UV-continuum slopes β of z ≳ 7 galaxies (e.g., Bouwens et al. 2010a, 2010b; Oesch et al. 2010a; Finkelstein et al. 2010; Bunker et al. 2010; see also Bouwens et al. 2009), the dust extinction in z ≳ 7 galaxies is likely small, and so no correction for dust is made in computing the SFR densities at z ≳ 7. At z ≲ 6, we adopt the dust corrections given in Schiminovich et al. (2005), Reddy & Steidel (2009), and Bouwens et al. (2009). Our SFR density estimates are included in Table 8 and in Figure 16.
The UV luminosity densities we find to −17.7 AB mag at z ∼ 7 and z ∼ 8 are just 32% and 18%, respectively, of that found to the same limiting luminosity at z ∼ 4. The SFR densities we find to these limits are just 6% and 4%, respectively, of that at z ∼ 4. This provides some measure of how substantial galaxy buildup has been in the ∼1 Gyr from z ∼ 7–8 to z ∼ 4 when the universe was nearing its peak SFR density at z ∼ 2–3.
7.4. SFR Densities from the Stellar Mass Density
It is interesting to compare the present SFR density determinations with that inferred from recent estimates of stellar mass density at z > 4 (Labbé et al. 2010a, 2010b; Stark et al. 2009; González et al. 2010). The comparison provides us with a very approximate test of the shape of the IMF at high redshift as well as allowing us to test the basic consistency of these very fundamental measurements.
In estimating the SFR densities from the stellar mass densities (Stark et al. 2009; Labbé et al. 2010a, 2010b; González et al. 2010), there are a few issues we need to consider. One issue is the stellar mass lost due to SNe recycling (Bruzual & Charlot 2003). To correct for this, we have multiplied the SFR densities we infer from the stellar mass densities by a factor of 1/0.72 ∼ 1.39 (appropriate for the Salpeter IMF assumed in the Labbé et al. 2010b mass estimates and a ∼300 Myr typical age).
A second issue we need to consider is that new galaxies will be entering magnitude-limited samples at all redshifts simply due to the growth of galaxies with cosmic time (e.g., galaxies not present in a z ∼ 7 sample would grow enough from z ∼ 7 to z ∼ 6 to enter magnitude-limited selections at z ∼ 6). Therefore, it is not quite possible to determine the SFR density by subtracting the stellar mass density determination in one redshift interval from that immediately below it. To account for those galaxies entering magnitude-limited samples due to luminosity growth, galaxies are assumed to brighten by 0.33 mag per unit redshift (the approximate M* evolution; see Section 7.5). This results in a typical 20% correction to the SFR density.
Based on these corrections and considerations and the stellar mass density at z ∼ 8 (Labbé et al. 2010b), we derive the SFR density down to z ∼ 4. The results are shown in Figure 17 (hatched red region).13 Interestingly, the SFR densities inferred from the stellar mass density are only ∼40% higher than that inferred from the UV LFs at z < 7 (where the stellar masses are more well determined).14 This suggests that (1) the IMF for SF galaxies at high redshift (z ∼ 4–7) may not be that different from what it is at later times (z ≲ 3; but see discussion in Chary 2008) and (2) the stellar mass densities at z > 4 inferred from the Spitzer Infrared Array Camera (IRAC) photometry are reasonably accurate. This latter conclusion is important since nebular emission line fluxes have been suggested to dominate the measured light in z ⩾ 7 galaxies with IRAC (Schaerer & de Barros 2010; but see Finlator et al. 2011). These comparisons suggest that nebular emission is not as dominant as has been suggested (Schaerer & de Barros 2010).

Figure 17. Comparison of the SFR density determinations at z ≳ 4 with that implied by recent determinations of the stellar mass density (Section 7.4). The red hatched region gives the SFR densities implied by current compilations of the stellar mass density at z ≳ 4 (Labbé et al. 2010a, 2010b; Stark et al. 2009; González et al. 2010) where the width of this region indicates a roughly ±1σ uncertainty. The change in density of the cross-hatching at z > 7 is intended to indicate that the mass-density-derived SFR may be more subject to systematic uncertainty from limited measurements and the extrapolation required from the measurements at z ≲ 7. At z ≳ 8, the stellar mass density in galaxies brightward of −18 AB mag is assumed to scale with redshift as (1 + z)−4.4 (as found in Labbé et al. 2010b). Interestingly, at z < 7 the mass-density-derived SFR is only about 40% larger than the SFR density estimated from the LFs; such a small difference is quite encouraging. This suggests that (1) the IMF at high redshift (z ∼ 4–7) may not be that different from what it is at later times and (2) that stellar mass density estimates at z > 4 are reasonably accurate.
Download figure:
Standard image High-resolution image7.5. Extrapolations to z ⩾ 8: An LF-fitting Formulas
The present LF determinations provide us with reasonably accurate measures of luminosity density and SFR density at z ∼ 7 and z ∼ 8—which are of considerable importance for assessing the impact of galaxies in the buildup of mass and metals in the universe, as well as understanding their role in reionization. However, knowing the LF results at z ∼ 7–8 only provides us with part of the information we want. To address some of the most outstanding of today's questions (i.e., whether galaxies reionize the universe, how stellar mass and metals are built up versus cosmic time), we really need to know what the UV LFs look like at even higher redshift.
For these questions, perhaps the best approach is simply to extrapolate the present LF results to even higher redshifts. Certainly, given the very uniform rate of evolution of the UV LF from z ∼ 8 to z ∼ 4, it seems quite plausible that such an extrapolation would be reasonably accurate. As in our previous work (Section 5.3 of Bouwens et al. 2008), we frame the evolution of the LF in terms of a Schechter function and assume that each Schechter parameter M*, α, and ϕ* can be expressed as a linear function of redshift. We then identify linear coefficients that maximize the likelihood of reproducing the observed contours in Figure 13 at z ∼ 4, z ∼ 5, z ∼ 6, z ∼ 7, and z ∼ 8. The result is

We see that the evolution in M*UV is significant at the 5σ level. However, the evolution in ϕ* and α is still not significant. The fitting formulas above are similar to those found in Bouwens et al. (2008) based upon a large z ∼ 4–6 ACS sample and z ∼ 7 NICMOS sample.
7.6. Implications for z ∼ 10 J125-dropout Searches
In the previous section, we combined the present constraints on the UV LFs at z ∼ 7 and z ∼ 8 with those available at z ∼ 4–6 to derive fitting formulas for the evolution of the UV LF with redshift. These formulas arguably provide us with our best means for extrapolating the UV LF to even higher redshifts and therefore estimating the form of the UV LF at z ∼ 10. This enterprise has important implications for z ∼ 10 galaxy searches in present and future WFC3/IR observations.
What surface density of z ∼ 10 J125-dropout candidates do we expect to find in current ultra-deep WFC3/IR observations? We can estimate this by taking advantage of the fitting formulas we derive in the previous section and the detailed simulations carried out by Bouwens et al. (2011a) to estimate J125-dropout selection efficiencies. We predict 1.0 and 2.3 J125-dropouts arcmin−2 to an H160 magnitude of 28.5 and 29.5 AB mag, respectively. These numbers are similar albeit somewhat larger than that found by Bouwens et al. (2011a) over the HUDF to H160 ∼ 29.5. Certainly, the fact that a few J125-dropout galaxies are expected in the HUDF search suggests that the z ∼ 10 galaxy candidate identified by Bouwens et al. (2011a) is plausible. Of course, deeper observations are clearly needed for more definitive statements. We do not address the Yan et al. (2010) J125-dropout numbers here, given the challenges in interpreting those numbers (both as a result of very low 3σ detection thresholds used in that study and the likely high contamination rates expected from the proximity of the many Yan et al. (2010) candidates to bright foreground galaxies (see discussion in Bouwens et al. 2011a).
8. SUMMARY
The ultra-deep (14 arcmin2) HUDF09 and deep wide-area (40 arcmin2) ERS WFC3/IR observations are a significant resource for identifying large samples of star-forming galaxies at z ≳ 7. The depth of these observations in three distinct wavelength channels combined with their availability over regions of the sky with ultra-deep optical data make such identifications possible with well-established selection procedures like the LBG technique.
We utilize LBG selection criteria over these fields to identify 73 candidate z ∼ 7 galaxies and 59 z ∼ 8 candidate galaxies (Table 2). These candidates extend over a ∼3 mag magnitude range in luminosity from H160, AB ∼ 26 to ∼29.4 mag—thus reaching to −17.7 AB mag (0.05 L*z = 3). The use of LBG criteria allows us to identify likely high-redshift sources from the extremely deep WFC3/IR data and then to exploit fully the deep, high spatial resolution ACS optical data to remove contaminants in a very robust way. Our sample of 132 galaxies in the reionization epoch is the largest currently available.
To determine the contamination rate we thoroughly assess the impact of lower redshift sources, photometric scatter, AGNs, spurious sources, low-mass stars, and transients (e.g., SNe) on our selection (Section 3.5). The contamination rate that we find is just ∼7% for the HUDF sample and ∼30% for the brighter, but less crucial, ERS sample (where the shallower optical data provide weaker constraints).
Through simulations, we have found that very strict optical non-detection criteria are essential to obtaining contamination-free z ⩾ 7 samples. We set a requirement that an accepted source must not show a 2σ-detection in any optical filter (nor a 1.5σ-detection in more than one optical filter). However, through extensive simulations we have found that this alone is not rigorous enough; it is likely that ∼30%–40% of our LBG samples over the HUDF09-1, HUDF09-2, and ERS fields would have consisted of contaminants if that had been the only optical constraint. What is much more effective is to combine the information in the entire optical data set to derive a χ2opt value for each source. In addition, we recommend validating the selection by looking at the χ2opt distribution for the entire sample (Section 4.2; Figure 19). The use of this technique results in much smaller contamination and is the reason why we can reach as faint as 29 AB mag and still reach an overall contamination rate of ∼11% (∼7% in the HUDF09 selection). This is discussed extensively in Section 3.5 and Appendix D, while our concerns about contamination in some other recent studies are discussed in Sections 4.1.2 and 4.1.3.
The high surface density of galaxies in our samples has direct implications for the LFs of galaxies in the first 800 Myr of the universe and the buildup of galaxies with cosmic time. We derive selection volumes for our LBG-selected galaxy samples through careful simulations, and use these selection volumes to derive LFs with well-understood errors. The techniques we use to derive the LFs are insensitive to large-scale structure biases and also explicitly account for other observational biases. We combine our LF determinations with other wide-area search results (see Table 4) to derive more robust constraints on the overall shape of the LF. We then compare these LFs with those found at z ∼ 4–6 to quantify the evolution of the UV LFs in the first 1.6 Gyr of the universe.
Here are our primary findings.
- 1.The faint-end slope α for the UV LF at z ∼ 7 is very steep, with values of −2.01 ± 0.21. The current faint-end slope determination is consistent with previous estimates at z ∼ 7 (Ouchi et al. 2009; Oesch et al. 2010a) and is a logical extension of that found at lower redshift where α ∼ −1.7 from z ∼ 6 to z ∼ 1 (Oesch et al. 2007, 2010c; Bouwens et al. 2007; Reddy & Steidel 2009; Yoshida et al. 2006; Beckwith et al. 2006; Yan & Windhorst 2004). The faint-end slope α at z ∼ 8 is more uncertain, but also consistent with being very steep: α = −1.91 ± 0.32. We have verified that the present faint-end slope determinations are not significantly affected by large-scale structure (see Section 6.2). Such steep slopes do not necessarily lead to a divergent integrated luminosity density since it is expected that the galaxy LF will almost certainly truncate at some physically established low-mass or luminosity limit. These results provide increasingly strong evidence that very low luminosity galaxies provide the dominant contribution to the luminosity density at z ⩾ 6. Strikingly, ≳75% of the luminosity density is from galaxies fainter than −18 AB mag (if α ⩽ −1.7). Interestingly, such large contributions are expected from theory (e.g., Salvaterra et al. 2011; Trenti et al. 2010; Barkana & Loeb 2000).
- 2.The characteristic luminosity M* and the normalization ϕ* we find at z ∼ 7 are −20.14 ± 0.26 and 0.86+0.70−0.39 × 10⁻³ Mpc−3, respectively. These values are consistent with other recent determinations of the UV LF at z ∼ 7 (Ouchi et al. 2009; Oesch et al. 2010a; Castellano et al. 2010a) and are also consistent with lower redshift trends (i.e., Bouwens et al. 2007, 2008). If we represent the z ∼ 8 LF with a Schechter function, the characteristic luminosity M* and normalization ϕ* that we determine are −20.10 ± 0.52 and 0.59+1.01−0.37 × 10⁻³ Mpc−3, respectively. This suggests that the evolution in the UV LF at z ≳ 4 occurs not only through changes in M* (as preferred from the z ∼ 7 to z ∼ 4 results; Section 7.1), but also through changes in ϕ*. The result, however, is quite sensitive to the surface density of very luminous galaxies (in this case the two bright z ∼ 8 galaxies in the HUDF09-2 field which would appear to represent an overdensity; Section 5.3). The uncertainties are still large at present.
- 3.The z ∼ 7 LF appears to be much better represented by a Schechter function than by a power law and shows evidence for an exponential cutoff at the bright end (Section 7.2). The z ∼ 8 LF also seems to be better represented by a Schechter function—though the evidence is weaker. It is unclear what physical explanation would impart such a cutoff in the LF (particularly if M* becomes fainter at higher redshift; Section 7.5), but it is possible this may be due (at least partially) to a similar exponential cutoff in the halo mass function (e.g., Trenti et al. 2010).
- 4.By integrating the UV LFs derived here at z ∼ 7 and 8, we estimate the UV luminosity density and SFR density at z ∼ 7 and z ∼ 8 to a limiting luminosity of −17.7 AB mag (0.05 L*z = 3). Consistent with the very blue UV-continuum slopes β observed for z ∼ 7–8 galaxies (e.g., Bouwens et al. 2010a, 2010b; Oesch et al. 2010a; Finkelstein et al. 2010; Bunker et al. 2010), we assume that the dust extinction is zero. The UV luminosity densities at z ∼ 7 and z ∼ 8 are ∼32% and ∼18% of the value at z ∼ 4, while the SFR densities estimated at z ∼ 7 and z ∼ 8 to these same luminosity limits are ∼6% and ∼4% of the value at z ∼ 4 (see Figure 16 and Table 8; Section 7.3).
- 5.The SFR densities we estimate from published stellar mass density determinations at z ∼ 4–7 (e.g., Labbé et al. 2010b; Stark et al. 2009; González et al. 2010) are only ∼40% higher than that derived directly from the LFs. See Section 7.4 and Figure 17. This suggests that (1) the IMF for star formation at very high redshift may not be that different from what it is at later times and (2) the stellar mass densities at z > 4 inferred from the IRAC photometry are reasonably accurate. The latter conclusion is important since it has been suggested that nebular emission line fluxes may dominate the measured light in z ⩾ 7 galaxies with Spitzer IRAC (Schaerer & de Barros 2010; but see also Finlator et al. 2011). The present comparison suggests otherwise.
- 6.We use the current constraints on the LF at z ∼ 7–8 to update the Bouwens et al. (2008) fitting formulas describing the evolution of M*, ϕ*, and α as a function of redshift (Section 7.5). The revised formulas are M*UV = (− 21.02 ± 0.09) + (0.33 ± 0.06)(z − 3.8), ϕ* = (1.14 ± 0.20)10(0.003 ± 0.055)(z − 3.8)10−3 Mpc−3, and α = (− 1.73 ± 0.05) + (− 0.01 ± 0.04)(z − 3.8) (Section 7.5).
- 7.Given the interest in the existence of massive black holes at z > 6 we have considered whether our z ∼ 7 and z ∼ 8 samples include any obvious evidence in the WFC3/IR images for AGNs. It appears that the frequency of obvious AGNs (unresolved "stellar" sources that are comparable to, or brighter than, the underlying galaxy) is quite small (i.e., ≲2%) in these z ∼ 7–8 samples (Section 3.5.3).
- 8.These new LF results allow us to estimate the expected number of z ∼ 10 galaxies from a search of the current HUDF09 data. We predict 1.0 and 2.3 J125-dropouts arcmin−2 to an H160-band magnitude of 28.5 and 29.5 AB mag, respectively. These numbers are consistent with the single z ∼ 10 candidate found by Bouwens et al. (2011a) over the HUDF to H ∼ 29.5 (Section 7.6). See Oesch et al. (2011) for an updated discussion using a larger set of observations.
The present WFC3/IR observations allowed us to select 132 galaxies at z ∼ 7 and z ∼ 8, over a 3 mag range in luminosity, reaching as faint as 29 AB mag in the near-IR. These observations have provided us with our best insight yet into the buildup and evolution of galaxies at early times—providing us with a clear measurement of rate of evolution in the UV LF from z ∼ 8 to z ∼ 4 in the first 1.6 Gyr of the universe. Surveying the results, it is remarkable how uniform the evolution of the LF is with cosmic time. These new observations also provide us with further insight into the contributions of galaxies to reionization (see Bouwens et al. 2011b for new estimates based on these deep LFs).
Further progress should be made over the next few years in the field of high-redshift LFs from the wide-area HST Multi-Cycle Treasury (MCT) CANDELS program. The CANDELS program will substantially improve our constraints on the prevalence of bright galaxies at z ≳ 7 and the overall shape of the LF. However, the crucial observations needed for ultimately making progress on characterizing the role of galaxies in reionizing the universe in the period from z ∼ 11 to z ∼ 6 and on the nature of the dominant population of low-luminosity galaxies at z ∼ 7–10 are further ultra-deep observations with WFC3/IR. Such observations would significantly improve our determinations of the faint-end slope α, the UV-continuum slopes β of very low luminosity galaxies (e.g., Bouwens et al. 2010a), and the prevalence of z ∼ 10 galaxies (e.g., Bouwens et al. 2011a).
We thank the STScI director Matt Mountain for making the ERS observations possible by granting DD time to observe the CDF-South GOODS field with the newly installed WFC3/IR camera aboard HST. We acknowledge useful conversations with Marco Castellano, Simon Lilly, Casey Papovich, Naveen Reddy, and Brant Robertson. We are grateful to our anonymous referee for significant feedback that greatly improved this manuscript. We deeply appreciate all those at NASA, its contractors, STScI, and throughout the community who have worked so diligently to make Hubble the remarkable observatory that it is today. The servicing missions, like the recent SM4, have rejuvenated Hubble and made it an extraordinarily productive scientific facility time and time again. We greatly appreciate the support of policymakers, and all those at NASA in the flight and servicing programs who contributed to the repeated successes of the HST servicing missions. We acknowledge the support of NASA grants NAG5-7697 and HST-GO-11563. P.O. acknowledges support from the Swiss National Science Foundation.
APPENDIX A: SIZES OF OUR MODEL GALAXY POPULATION AND A COMPARISON WITH THE OBSERVATIONS
An essential input to determinations of the LFs are estimates of the selection volume. For determining these selection volumes, one of the most important inputs is the size (or surface brightness) distribution of the model galaxy population (e.g., Bouwens et al. 2003a, 2003b, 2004, 2006; Oesch et al. 2007). Use of a model galaxy population with sizes that are too large results in selection volumes that are too low, while use of a model galaxy population with sizes that are too small results in selection volumes that are too high.
Fortunately, we do not expect this to be an issue because of our approach. We expect that the sizes (or surface brightnesses) of our model galaxy population will match that seen in the observations since we base the size of our model galaxy population on the sizes already measured for z ∼ 7–8 galaxies in the HUDF (Oesch et al. 2010b) and on the size evolution observed from z ∼ 8 to z ∼ 4. Nonetheless, it is useful to verify that there is good agreement between our model galaxy population and observations using our current z ∼ 7–8 samples and the full two-year HUDF09 data.
We provide such a check in Figure 18—comparing the sizes of z ∼ 7 galaxies seen in the observations and from our simulations. The simulations are based on z ∼ 4 galaxies from the HUDF and the size–redshift evolution seen from z ∼ 7 to z ∼ 4. Sources from the simulations are selected in an identical manner. For this comparison, we only utilize galaxies between J125, AB ∼ 27.8 and J125, AB ∼ 28.5 for our z ∼ 7 selection and H160, AB ∼ 27.8 and H160, AB ∼ 28.6 for our z ∼ 8 selection—since these magnitude intervals allow for the selections of galaxies over a range of sizes and thus usefully probe the size distribution. Faintward of this, only the smallest galaxies are selected, and so comparisons between the observed and model size distributions do not allow us to effectively test our model (see discussion in Section 3.7 and Figure 5 of Bouwens et al. 2006; Appendix A of Bouwens et al. 2008; Figure 3 of Grazian et al. 2011). Also shown in this figure is the half-light radius distribution for a galaxy population with sizes that are 40% smaller and 50% larger than our fiducial model.

Figure 18. Comparison of the half-light radii of z ∼ 7–8 galaxies observed over the HUDF09 field (histogram) with those from our fiducial galaxy model (thick solid line; used to estimate the selection volumes, see Appendix C). The left panel is for our z ∼ 7 selection and the right panel is our for z ∼ 8 selection. Galaxies are selected from our simulations in exactly the same way as from the observations. The magnitude intervals plotted are chosen to be sufficiently brightward of the faint limit to allow for the selection of galaxies over a range of sizes, while still including a significant fraction of our HUDF09 z ∼ 7–8 sample. Also shown is the half-light radius distribution for a galaxy population with sizes that are 40% smaller and 50% larger than our fiducial model (dashed lines and dotted lines, respectively). The observed half-light radius distribution is in excellent agreement with the sizes from our fiducial model. The fit to the other size models is less good (the disagreement ranges from ∼1–2σ), but the uncertainties are large. Deeper observations will be required to establish the size distribution more accurately to very low luminosities. We find no evidence that our model size distribution is too large, and therefore that our selection volumes are too low, as suggested by Grazian et al. (2011; see Appendix A).
Download figure:
Standard image High-resolution imageAs Figure 18 illustrates, the observed size distribution is in excellent agreement with that predicted by our fiducial model. The fit to the other size models is less good, particularly the model with the smaller size distribution (the disagreement ranges from ∼1–2σ), but the uncertainties are large. Deeper observations will be required to establish the size distribution more accurately to very low luminosities. In any case, we find no evidence that our model size distribution is too large, and therefore that our selection volumes are too low, as suggested by Grazian et al. (2011). The poor fit of the observations to the models with smaller sizes suggests this issue is unlikely to bias us toward steeper slopes.
Incidentally, it would appear that Grazian et al.'s (2011) claim is based on a mistaken understanding of our methodology (shown in their Figures 2 and 4). They suggest that we model all galaxies using spectroscopically confirmed (and therefore predominantly bright) z ∼ 4 galaxies from the HUDF. Regretably, this is a misunderstanding of our approach and leads them to the wrong conclusion about our results. We explicitly consider luminosity when modeling source sizes and structures, i.e., the structure of luminous z ∼ 7 galaxies is modeled with luminous z ∼ 4 galaxies (from the HUDF) and the structure of lower luminosity z ∼ 7 galaxies is modeled with lower luminosity z ∼ 4 galaxies (from the HUDF). Since lower luminosity z ∼ 4 galaxies are typically much smaller than more luminous galaxies, we model the sizes of faint galaxies at z ∼ 7–8 with much smaller galaxies than has been suggested. Moreover, as shown in Figure 18, these sizes appear to be in excellent agreement with the observations.
APPENDIX B: EXPECTED CONTAMINATION RATES
In Section 3.5, we consider many different sources of contamination for our z ∼ 7 and z ∼ 8 selections, including (1) low-mass stars (T dwarfs), (2) transient sources (SNe), (3) AGNs, (4) low-redshift galaxies, (5) photometric scatter, and (6) spurious sources. After careful consideration of the source characteristics and simulations, we find that the only meaningful sources of contamination for our z ≳ 7 samples are lower redshift galaxies photometrically scattering into our selection. In Table 9, we give the expected contamination rates for the z ∼ 7 and z ∼ 8 selections as a function of magnitude for all four fields considered here.
Table 9. Estimated Number of Contaminants in our z ∼ 7 and z ∼ 8 Samplesa
| Mag Rangeb | HUDFc | HUDF09-1 | HUDF09-2d | ERS |
|---|---|---|---|---|
| z ∼ 7 Samples | ||||
| 25.0–25.5 | 0.00 | 0.00 | 0.00 | 0.01 |
| 25.5–26.0 | 0.00 | 0.00 | 0.00 | 0.24 |
| 26.0–26.5 | 0.00 | 0.02 | 0.03 | 0.66 |
| 26.5–27.0 | 0.00 | 0.09 | 0.06 | 1.05 |
| 27.0–27.5 | 0.02 | 0.15 | 0.15 | 0.85 |
| 27.5–28.0 | 0.13 | 0.41 | 0.33 | 0.12 |
| 28.0–28.5 | 0.20 | 0.86 | 0.63 | ⋅⋅⋅ |
| 28.5–29.0 | 0.36 | 0.58 | 0.71 | ⋅⋅⋅ |
| 29.0–29.5 | 0.27 | ⋅⋅⋅ | ⋅⋅⋅ | ⋅⋅⋅ |
| z ∼ 8 Samples | ||||
| 25.0–25.5 | 0.00 | 0.00 | 0.00 | 0.01 |
| 25.5–26.0 | 0.00 | 0.00 | 0.00 | 0.19 |
| 26.0–26.5 | 0.00 | 0.00 | 0.00 | 0.47 |
| 26.5–27.0 | 0.00 | 0.00 | 0.00 | 0.70 |
| 27.0–27.5 | 0.00 | 0.06 | 0.02 | 0.86 |
| 27.5–28.0 | 0.02 | 0.25 | 0.15 | ⋅⋅⋅ |
| 28.0–28.5 | 0.17 | 0.49 | 0.39 | ⋅⋅⋅ |
| 28.5–29.0 | 0.50 | 0.45 | 0.38 | ⋅⋅⋅ |
| 29.0–29.5 | 0.41 | 0.01 | 0.06 | ⋅⋅⋅ |
Notes. aFor our LBG selections over our three HUDF09 fields, our estimated contamination rates are made assuming that the faint photometric samples have the same color distributions as found in the high S/N HUDF09 26.5 < H160, AB < 28.0 subsample. For our ERS selections, our contamination estimates are based upon the high S/N HUDF09 26 < H160, AB < 27.0 subsample. Noise is then added to the photometry, and our z ∼ 7 or z ∼ 8 selection criteria are then applied. Any source that is selected by our LBG criteria (after adding noise), but detected in the optical in the original high S/N observations, is counted toward the total contamination level. See Section 3.5 for details. bJ125 and H160 magnitudes used for our z ∼ 7 and z ∼ 8 selections, respectively. cIt is striking how much lower the estimated contamination levels are in our HUDF selections than in our HUDF09-1/HUDF09-2 selections. This difference is a direct result of the much greater depth of the optical data over the HUDF (by ∼1 mag) than the HUDF09-1/HUDF09-2 selections. dAs a result of the ACS parallel observations acquired as part of the HUDF09 WFC3/IR program, the effective contamination rate over the HUDF09-2 field decreases by a factor of ∼3 for those regions with deeper ACS data (the cyan "P1" region shown in Figure 1). The effect of these additional data is reflected in the numbers we quote in this table.
Download table as: ASCIITypeset image
APPENDIX C: EFFECTIVE SELECTION VOLUMES
To derive the rest-frame UV LFs from the observed surface densities of z ∼ 7–8 candidates, we require a good estimate of the effective selection volume for our selections, as a function of magnitude. To obtain these estimates, we construct mock catalogs for our search fields. Pixel-by-pixel images are generated for each of the sources in our catalogs, these sources are added to our observational data, and finally source catalogs are constructed from the simulated data in the same way as on the observations. Dropouts are then selected using the criteria described earlier in this appendix. In generating two-dimensional images for each source in our catalogs, we randomly select a similar luminosity z ∼ 4 B dropout from the Bouwens et al. (2007) HUDF sample and then scale its size (physical) as (1 + z)−1 to match the observed size evolution to z ∼ 8 (Oesch et al. 2010b; see also Ferguson et al. 2004; Bouwens et al. 2004, 2006). In setting the UV colors of the sources, we assume that the UV-continuum slopes β are distributed as found by Bouwens et al. (2010a); i.e., with a mean value of −2.0 at L*z = 3 (−21 AB mag), a mean value of −2.7 at 0.1 L*z = 3 (−18.5 AB mag), and with a mean β between these two extremes for luminosities in the range 0.1–1 L*z = 3 (e.g., Bouwens et al. 2009, 2010a; Finkelstein et al. 2010; Bunker et al. 2010; R. J. Bouwens et al. 2011, in preparation). These simulations are performed for our z ∼ 7–8 selection over the ERS observations and for all three of the HUDF09 search fields.
APPENDIX D: USE OF THE χ2opt DISTRIBUTION TO CONTROL FOR CONTAMINATION
The best way to control for contamination in the z ⩾ 7 samples is to take advantage of the optical imaging observations over these samples. Typically, this is done by imposing an optical non-detection (<2σ) criterion in one or more bands or in a stack of the optical data—since high-redshift sources should not show a detection at optical wavelengths. Unfortunately, for the present z ≳ 7 selections, the optical observations available over our WFC3/IR fields are sufficiently shallow (in some cases) that it is not clear that the above procedure will be effective in excluding all low-redshift contaminants from our selections (or even the majority). This concern is particularly germane for the ERS, HUDF09-1, and HUDF09-2 fields—where the optical data are not appreciably deeper than the near-IR data.
D.1. Definition of χ2opt
To make maximal use of the optical imaging data that exist over the HUDF09 and GOODS fields, we clearly need to use a more sophisticated procedure. To this end, we define the quantity χ2opt that effectively combines information in all the optical imaging data. We define χ2opt as

where fi is the flux in band i in our smaller scalable apertures, σi is the uncertainty in this flux, and SGN(fi) is equal to 1 if fi > 0 and −1 if fi < 0. Included in the computed χ2opt values are the B435-, V606-, and i775-band observations for the z ∼ 7 z850-dropout selection and the B435-, V606-, i775-, and z850-band observations for the z ∼ 8 Y105-dropout selection.
D.2. χ2opt Distribution for z ≳ 7 Galaxies and Low-redshift Contaminants
How shall we use the measured χ2opt values for sources in our selection to exclude low-redshift contaminants? To answer this question, we must know the χ2opt distribution expected for bona fide z ⩾ 7 galaxies and also that distribution expected to come from possible low-redshift contaminants. The χ2opt distribution for z ∼ 7 candidates is calculated assuming no optical flux in z ∼ 7 candidates and ideal noise properties. Meanwhile, the χ2opt distribution for the low-redshift contaminants is calculated in the same way as we calculate contamination from photometric scatter in Section 3.5, i.e., starting with the color distribution for an intermediate magnitude subsample of real sources in our data and then adding noise to match the fluxes of faint sources in our search fields. While discussing the use of χ2opt to control for contamination in our z ≳ 6 selections, we will assume that we have already removed sources that are detected at ⩾2σ in individual images.
We show the model χ2opt distributions in Figure 19 for the z ∼ 7 selections we perform over the ERS, HUDF09, and HUDF09-1 fields (which represent a good sampling of the selections considered here). For the HUDF09 and HUDF09-1 fields, these distributions are shown ∼0.7 mag from the approximate selection limit for each field. As Figure 19 shows, the χ2opt values for z ≳ 7 galaxies are centered on 0 and have lower values than for low-redshift galaxies. However, due to the effects of noise, both z ≳ 7 galaxies and low-redshift contaminants are spread over a wide range in χ2opt values.

Figure 19. Apparent detection significance χ2opt (Appendix D: blue lines) expected for z ∼ 7 galaxy candidates from simulations for three different data sets considered here: ERS (left), HUDF09 (center), and HUDF09-1 (right). Since z ∼ 7 galaxies should not be detected in the optical, these distributions (blue lines) are, as expected, approximately centered on 0, with ∼50% above and ∼50% below 0 (due to noise). Also presented here (red lines) are the distributions expected for lower redshift contaminants in our fields (after excluding the obvious contaminants detected at >2σ in ⩾1 bands). The latter distributions (red lines: for the low-redshift contaminants) are estimated through the photometric scatter simulations described in Section 3.5.5. A dramatic demonstration of the added value from our full χ2opt approach can be seen in these figures. Note the large number of low-redshift galaxies we expect to satisfy our z ∼ 7 LBG criterion that are not excluded by a 2σ optical non-detection criterion. This is effectively illustrated by the area under the red line. For fields with optical data of limited depths (e.g., the ERS or HUDF09-1 fields), this number can be comparable to the number of bona fide z ∼ 7 galaxies. To effectively exclude these low-redshift contaminants, we derive χ2opt values for sources in our selections and then only select sources with small values of χ2opt, i.e., χ2opt < χlim2. For the HUDF09 and HUDF09-1 fields, the limiting values of χ2opt shown in this diagram are for sources selected ∼0.7 mag brighter than the selection limit (∼28.5 AB mag but this depends on the field). The dashed vertical lines show these χ2opt limits. The sources which exceed the χ2opt limits (but otherwise meet our selection criteria) are given in Tables 18, 19, and 20.
Download figure:
Standard image High-resolution imageIndeed, it is striking how low the χ2opt values are expected to become for some low-redshift galaxy contaminants that would appear in our selections. At relatively low χ2opt values of 3, for example, the total number of contaminants in our ERS or HUDF09-1 selections (red lines) is expected to exceed the number of bona fide z ⩾ 7 galaxies (blue lines: Figure 19). A few contaminants are even expected to have observed χ2opt values that are negative, particularly in those fields with the shallowest optical observations (i.e., the ERS or HUDF09-1 data). The prevalence of contaminants to even very low values of χ2opt underlines the importance of adopting very conservative optical non-detection criteria in our selection.
D.3. Use of the Measured χ2opt for Selecting z ≳ 7 Galaxies
We only select galaxies to a value of χ2opt where we expect the number of z ∼ 7 galaxies to be greater than the number of contaminants. This critical value χ2lim depends on both the depth of the optical data and the magnitude of the source—since we would expect our fainter selections to admit more contamination than our brighter selections. We have found that χ2lim values of 5, 3, and 5, respectively, worked well for our HUDF09, HUDF09-1, and HUDF09-2 data sets, respectively, at brighter (J125, H160 ≲ 28.5) magnitudes; however, at fainter magnitudes (J125, H160 ∼ 29.2), χ2lim needed to be 2.5, 1.5, and 2.5, respectively, for the same fields. For sources with magnitudes between 28.5 and 29.2, the upper limits on χ2opt are an interpolation between these extremes. For the small fraction (∼30%) of sources in the HUDF09-2 field without additional optical/ACS coverage from our HUDF09 program (those not within the P1 field shown in Figure 1), it was appropriate to adopt the same χ2opt limits as for the HUDF09-1 field.
We derive χ2opt values for our z ⩾ 7 candidates in three different apertures: 035 diameter circular apertures, small 018 diameter circular apertures, and Kron-style scalable apertures (Kron factor of 1.2). The use of three different apertures allows us to be much more comprehensive in our identification of possible optical light in sources (which may be spatially very compact or extended) and therefore rejection of these sources as low-z contaminants. No smoothing of the ACS optical images is performed prior to making these formal flux measurements. This ensures that we obtain the highest possible S/N for these flux measurements—effectively taking advantage of the sharper PSF in the ACS images.
D.4. Validation of the Technique
The χ2opt distributions observed for our samples also provide a convenient way of ascertaining the actual number of bona fide z ⩾ 7 galaxies in our search fields and therefore the contamination rate (by inference). Looking at Figure 19, we see that an exceedingly small number of contaminants are expected to have χ2opt <0 from the simulations, and so essentially all of sources satisfying our LBG criteria with χ2opt <0 are bona fide z ∼ 7–8 galaxies. However, we also know the χ2opt <0 requirement introduces an incompleteness of ∼50% (simply because ∼50% of the sources will have positive values of χ2opt and ∼50% negative values—given our definition of χ2opt). Therefore, the actual number of bona fide z ⩾ 7 candidates is approximately double the number of candidates with χ2opt <0. Moreover, since we quantify the χ2opt distribution for each search field in three different apertures (035 diameter circular, 018 diameter circular, scalable Kron), this provides us with three different estimates of the actual number of z ⩾ 7 candidates.
Reassuringly, the number of high-redshift candidates in our samples is in good agreement with the numbers derived from the above argumentation. Multiplying the number of z ∼ 7 candidates with χ2opt < 0 by 2, we expect 28.7, 15.3, 15.3, and 8.7 z ∼ 7 candidates in the HUDF09, HUDF09-1, HUDF09-2, and ERS fields, respectively, versus the 29, 17, 14, and 13 candidates in our observed samples. Similarly, we expect 28, 15.3, 10.7, and 6 z ∼ 8 candidates, respectively, in the above fields versus the 24, 14, 15, and 6 candidates in our observed samples.
D.5. Limitations of High-redshift Selections Not Making Use of Quantities Like χ2opt
It is instructive to contrast the present criteria for rejecting low-redshift contaminants with other frequently used methods. Perhaps the most common of these is one relying just upon the 2σ detections of the sources in individual optical bands for removing low-redshift contaminants from high-redshift selections (e.g., Bouwens et al. 2007; Wilkins et al. 2011). The difficulty with this approach is that it relies upon the optical data being very deep in each individual band (which is rarely the case).
As an example of the limitations of this approach we found that had we only used a 2σ-optical rejection criterion in selecting z ∼ 7 and z ∼ 8 galaxies, a large fraction (∼30%–40%) of our z ∼ 7–8 samples over the HUDF09-1, HUDF09-2, and ERS fields would have consisted of contaminants. Such large contamination rates significantly reduce the value of the samples for quantitative work.
The red lines in Figure 19 show the χ2opt distribution expected for low-redshift contaminants not detected in any optical band at >2σ. The area under the red curves in Figure 19 is comparable to that under the blue curves for data sets like HUDF09-1 or the ERS fields. Clearly, contamination from low-redshift sources can be quite substantial and have a significant impact in fields with shallower optical data (e.g., recall the discussion of contamination in the Wilkins et al. (2010, 2011) sample in Sections 4.1.2 and 4.1.3). This is perhaps an even more important concern than uncertainties in the size distribution at faint magnitudes (see, e.g., Bouwens et al. 2004; Grazian et al. 2011). Careful use of measures like χ2opt is required to limit contamination (or correct for it statistically in a robust way).
APPENDIX E: z ∼ 7–8 SAMPLES
In this appendix, we provide detailed catalogs and postage stamps for our z ∼ 7 and z ∼ 8 samples from the three ultra-deep WFC3/IR HUDF09 fields and ERS fields.
A description of the HUDF09 z ∼ 7 and z ∼ 8 selections is given in Section 3.2. A similar description of the ERS z ∼ 7 and z ∼ 8 selections is given in Section 3.4. The coordinates, total magnitudes, colors, and sizes measured for our z ∼ 7 candidates over our ultra-deep HUDF09 and ERS fields are provided in Tables 10–13. Small postage stamp cutouts of the z ∼ 7 candidates are given in Figure 20. The properties of our z ∼ 8 candidates in the three ultra-deep HUDF09 and ERS fields are given in Tables 14–17. Postage stamps of the z ∼ 8 candidates are given in Figure 21. The selection of these candidates is described in Sections 3.2 and 3.4.

Figure 20. Co-added Y105/Y098 + J125 + H160 images (234 × 234) of the 73 z ∼ 7 candidates identified over our HUDF09 and ERS search fields. Each candidate is annotated with its source ID and J125-band magnitude. The candidates are ordered in terms of their J125-band magnitude, with those from the HUDF09 program given first and the ERS observations second.
Download figure:
Standard image High-resolution image
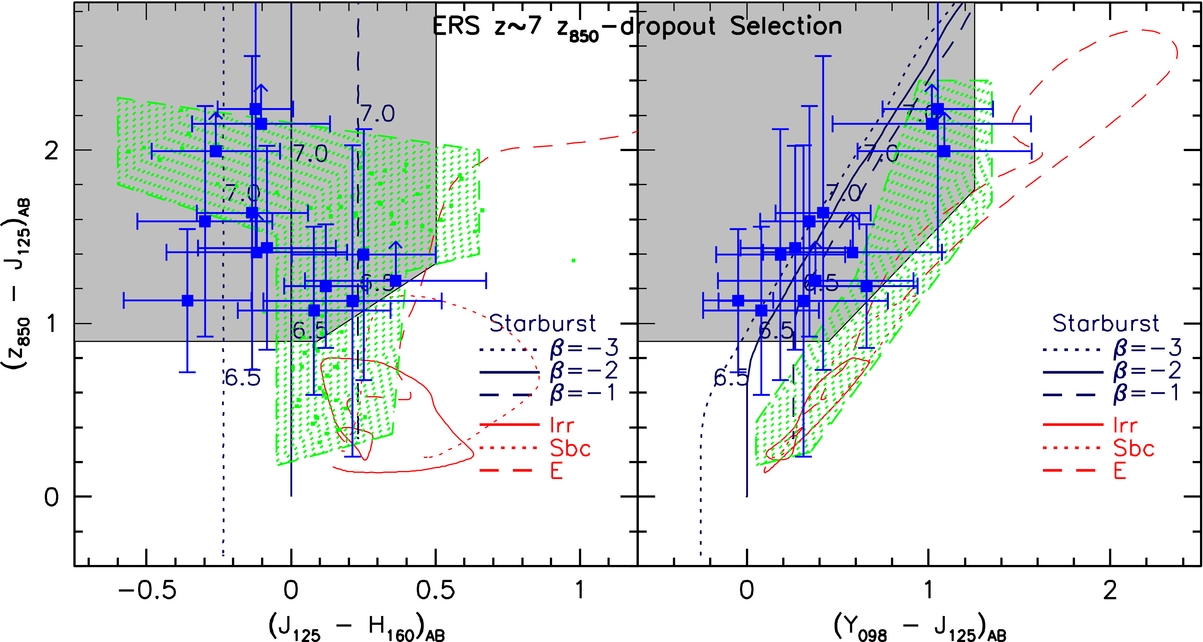
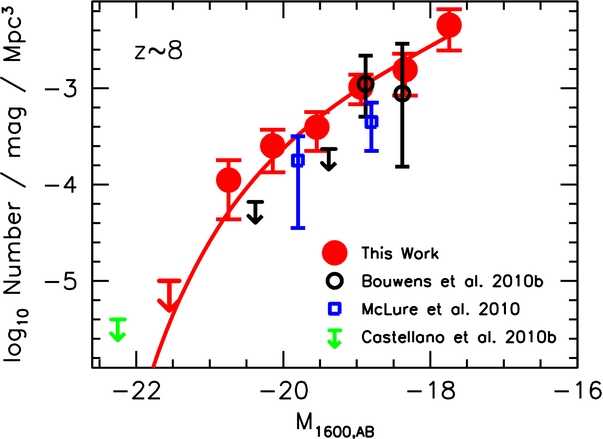
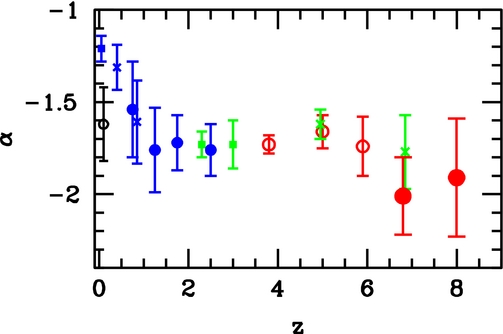
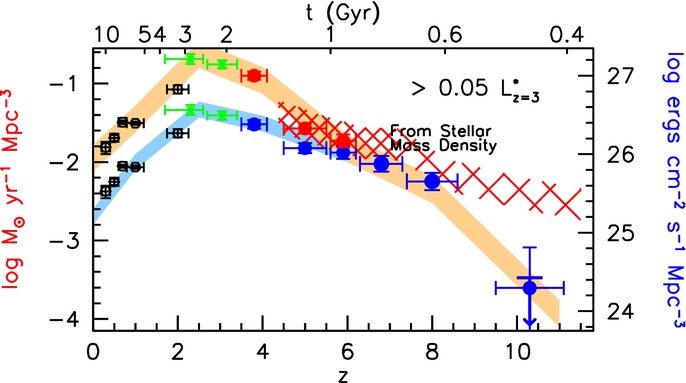
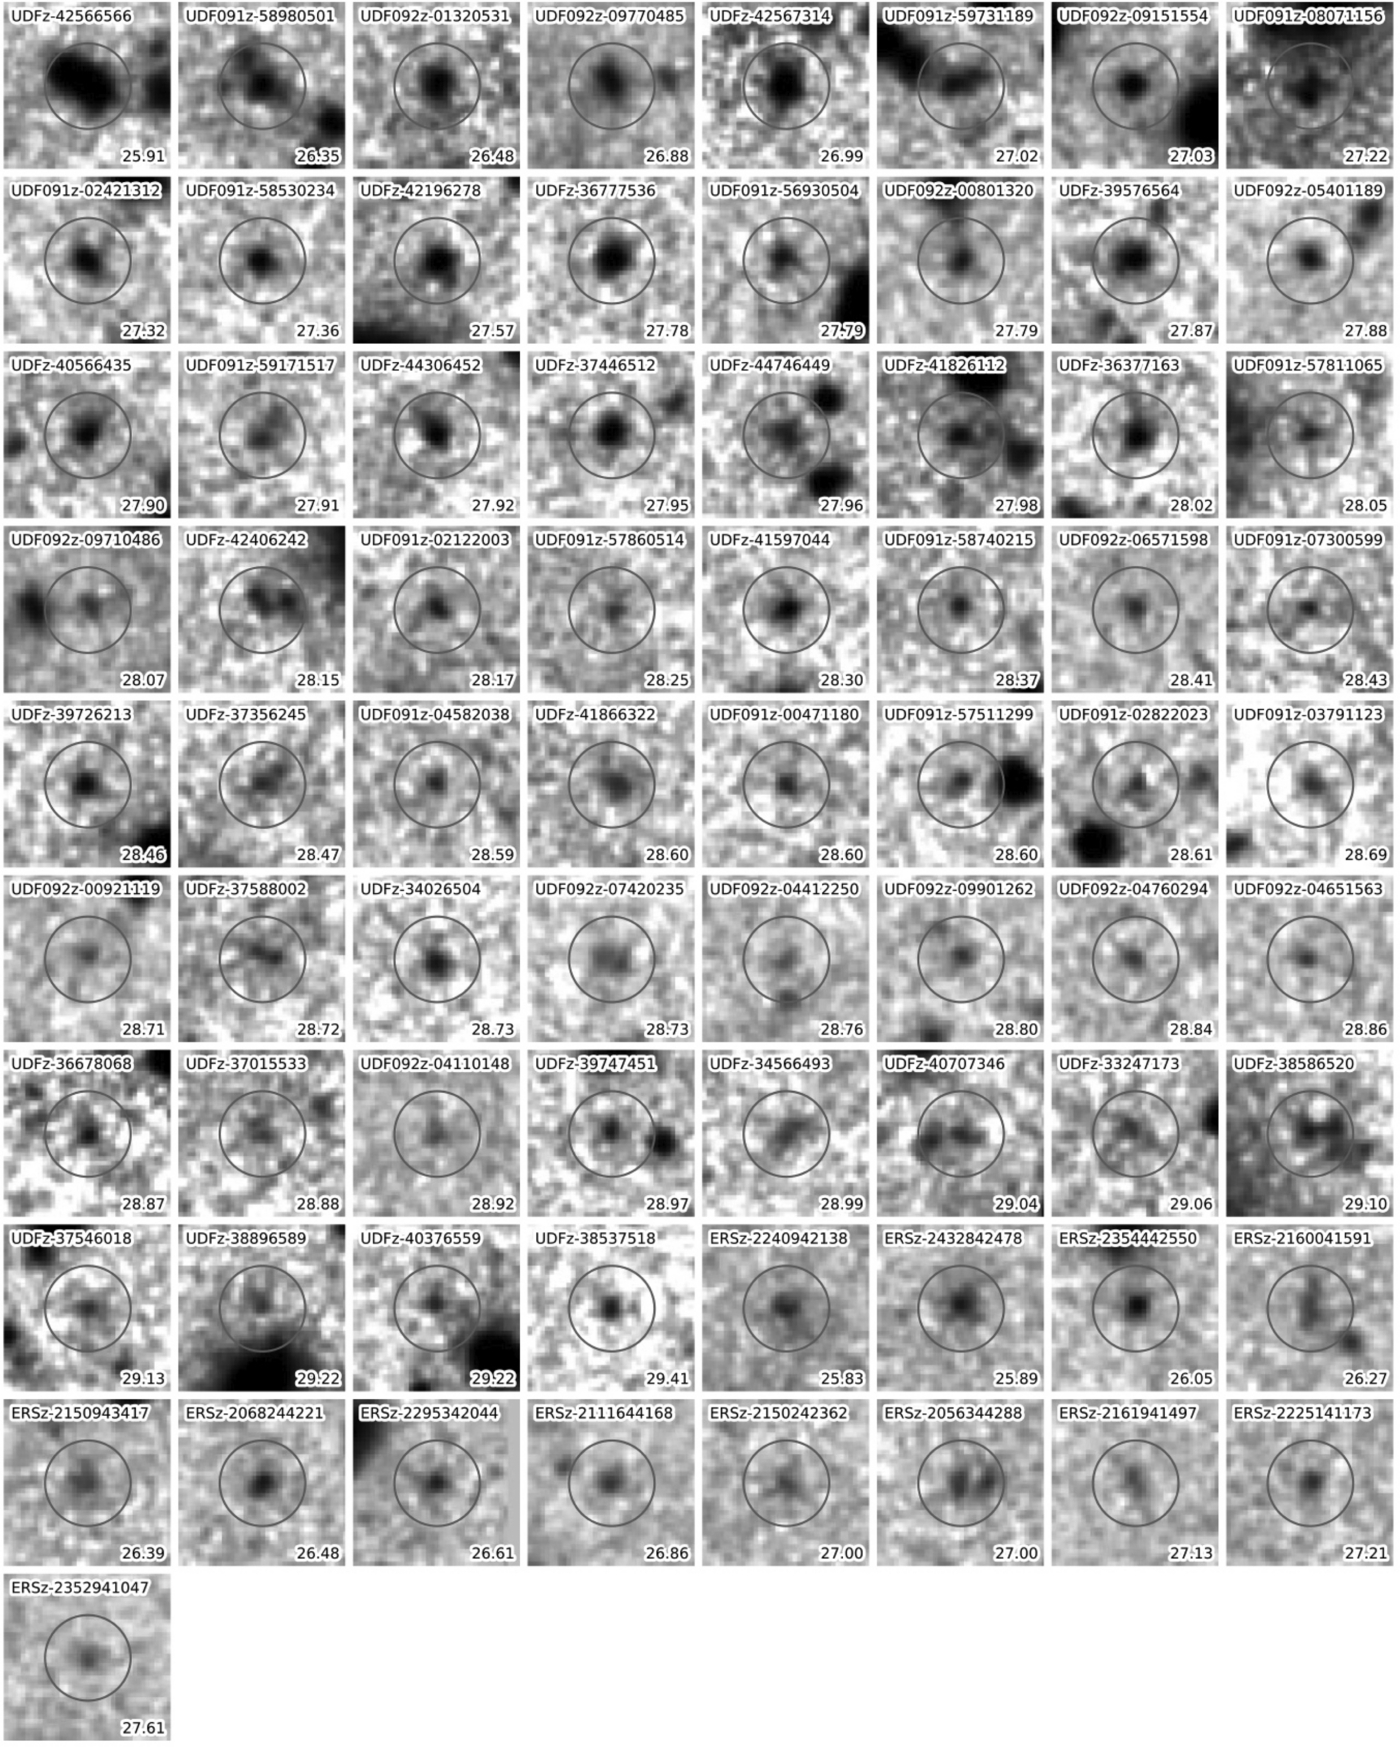
Figure 21. Co-added J125 + H160 images (234 × 234) of the 59 z ∼ 8 candidates identified over our HUDF09 and ERS search fields. Each candidate is annotated with its source ID and H160-band magnitude. The candidates are ordered in terms of their H160-band magnitude, with those from the HUDF09 program given first and the ERS observations second.
Download figure:
Standard image High-resolution image
Table 10. z ∼ 7 Candidates Identified in the Ultra-deep HUDF09 WFC3/IR Observations Over the HUDF
| Object ID | R.A. | Decl. | J125 | z850 − Y105a | Y105 − J125a | J125 − H160 | rhlb | Refc |
|---|---|---|---|---|---|---|---|---|
| UDFz-42566566 | 03:32:42.56 | −27:46:56.6 | 25.9 ± 0.0 | 1.6 ± 0.1 | 0.2 ± 0.0 | −0.1 ± 0.0 | 026 |
1,2,3,4,6,8,9,10,11,12 |
| UDFz-42567314 | 03:32:42.56 | −27:47:31.4 | 27.0 ± 0.1 | 1.7 ± 0.5 | 0.3 ± 0.1 | −0.1 ± 0.1 | 019 |
1,3,4,6,8,9,10,11 |
| UDFz-42196278 | 03:32:42.19 | −27:46:27.8 | 27.6 ± 0.1 | 0.9 ± 0.2 | 0.0 ± 0.1 | −0.1 ± 0.1 | 017 |
8,11,12 |
| UDFz-36777536 | 03:32:36.77 | −27:47:53.6 | 27.8 ± 0.1 | 1.0 ± 0.2 | −0.1 ± 0.1 | −0.1 ± 0.1 | 014 |
6,8,12 |
| UDFz-44306452 | 03:32:44.30 | −27:46:45.2 | 27.9 ± 0.1 | 0.8 ± 0.3 | 0.1 ± 0.2 | −0.3 ± 0.1 | 018 |
8,11,12 |
| UDFz-37446512 | 03:32:37.44 | −27:46:51.2 | 27.9 ± 0.1 | 1.1 ± 0.3 | −0.1 ± 0.1 | −0.2 ± 0.1 | 014 |
6,8,10,11,12 |
| UDFz-39576564 | 03:32:39.57 | −27:46:56.4 | 27.9 ± 0.1 | 1.2 ± 0.3 | 0.0 ± 0.1 | −0.1 ± 0.1 | 016 |
6,8,10,11,12 |
| UDFz-40566435 | 03:32:40.56 | −27:46:43.5 | 27.9 ± 0.1 | 1.3 ± 0.5 | −0.0 ± 0.1 | −0.2 ± 0.1 | 019 |
6,8,9,10,11,12 |
| UDFz-44746449 | 03:32:44.74 | −27:46:44.9 | 28.0 ± 0.1 | >1.6 | 0.1 ± 0.2 | −0.0 ± 0.2 | 027 |
8,10,11 |
| UDFz-36377163 | 03:32:36.37 | −27:47:16.3 | 28.0 ± 0.1 | 1.1 ± 0.3 | −0.1 ± 0.1 | −0.4 ± 0.2 | 015 |
6,8,9,10,11,12 |
| UDFz-41826112 | 03:32:41.82 | −27:46:11.2 | 28.0 ± 0.1 | 1.1 ± 0.6 | 0.0 ± 0.2 | 0.0 ± 0.2 | 023 |
10,11,12 |
| UDFz-42406242 | 03:32:42.40 | −27:46:24.2 | 28.1 ± 0.1 | >2.0 | −0.1 ± 0.2 | −0.2 ± 0.2 | 024 |
10,11 |
| UDFz-41597044 | 03:32:41.59 | −27:47:04.4 | 28.3 ± 0.1 | 1.1 ± 0.4 | −0.1 ± 0.2 | −0.3 ± 0.2 | 015 |
12 |
| UDFz-39726213 | 03:32:39.72 | −27:46:21.3 | 28.5 ± 0.1 | >1.9 | 0.2 ± 0.2 | −0.3 ± 0.2 | 012 |
6,8,9,10,11,12 |
| UDFz-37356245 | 03:32:37.35 | −27:46:24.5 | 28.5 ± 0.2 | 1.1 ± 0.7 | −0.2 ± 0.2 | −0.4 ± 0.3 | 022 |
|
| UDFz-41866322 | 03:32:41.86 | −27:46:32.2 | 28.6 ± 0.2 | >1.4 | 0.1 ± 0.3 | −0.4 ± 0.3 | 019 |
|
| UDFz-34026504 | 03:32:34.02 | −27:46:50.4 | 28.7 ± 0.1 | >1.6 | 0.3 ± 0.2 | −0.6 ± 0.3 | 012 |
|
| UDFz-37588002 | 03:32:37.58 | −27:48:00.2 | 28.7 ± 0.2 | >0.9 | 0.2 ± 0.4 | 0.3 ± 0.3 | 024 |
10 |
| UDFz-36678068 | 03:32:36.67 | −27:48:06.8 | 28.9 ± 0.2 | >1.4 | 0.2 ± 0.3 | −0.3 ± 0.3 | 014 |
|
| UDFz-37015533 | 03:32:37.01 | −27:45:53.3 | 28.9 ± 0.2 | 0.7 ± 0.6 | 0.0 ± 0.3 | −1.0 ± 0.8 | 017 |
|
| UDFz-34566493 | 03:32:34.56 | −27:46:49.3 | 29.0 ± 0.2 | >1.0 | 0.2 ± 0.4 | 0.1 ± 0.3 | 019 |
|
| UDFz-39747451 | 03:32:39.74 | −27:47:45.1 | 29.0 ± 0.2 | >1.2 | 0.1 ± 0.3 | −0.1 ± 0.3 | 014 |
|
| UDFz-40707346 | 03:32:40.70 | −27:47:34.6 | 29.0 ± 0.2 | >1.4 | −0.2 ± 0.3 | −0.3 ± 0.4 | 016 |
|
| UDFz-37546018 | 03:32:37.54 | −27:46:01.8 | 29.1 ± 0.2 | >0.9 | 0.2 ± 0.4 | −0.1 ± 0.4 | 017 |
|
| UDFz-33247173 | 03:32:33.24 | −27:47:17.3 | 29.1 ± 0.2 | >1.0 | 0.3 ± 0.4 | −0.2 ± 0.4 | 017 |
|
| UDFz-38586520 | 03:32:38.58 | −27:46:52.0 | 29.1 ± 0.2 | 1.4 ± 0.8 | 0.1 ± 0.3 | 0.0 ± 0.3 | 014 |
|
| UDFz-40376559 | 03:32:40.37 | −27:46:55.9 | 29.2 ± 0.2 | >1.3 | −0.2 ± 0.4 | −0.3 ± 0.4 | 015 |
|
| UDFz-38896589 | 03:32:38.89 | −27:46:58.9 | 29.2 ± 0.3 | >0.8 | 0.2 ± 0.5 | −0.1 ± 0.4 | 016 |
|
| UDFz-38537518 | 03:32:38.53 | −27:47:51.8 | 29.4 ± 0.2 | >1.5 | 0.1 ± 0.3 | −0.6 ± 0.3 | 009 |
6 |
Notes.
aLower limits on the measured colors are the 1σ limits. Magnitudes are AB.
bHalf-light radius calculated using SExtractor from the square root of χ2 image. The median difference between the half-light radii estimates in the first-year observations and that estimated from the full two-year observations is ∼002.
cReferences: (1) Bouwens et al. 2004; (2) Bouwens & Illingworth 2006; (3) Labbé et al. 2006; (4) Bouwens et al. 2008; (5) Oesch et al. 2009; (6) Oesch et al. 2010a; (7) Bouwens et al. 2010b; (8) McLure et al. 2010; (9) Bunker et al. 2010; (10) Yan et al. 2010; (11) Finkelstein et al. 2010; (12) McLure et al. 2011.
Download table as: ASCIITypeset image
Table 11. z ∼ 7 Candidates Identified in the Ultra-deep WFC3/IR Observations Over HUDF09-1
| Object ID | R.A. | Decl. | J125 | z850 − Y105a | Y105 − J125a | J125 − H160 | rhlb | Refc |
|---|---|---|---|---|---|---|---|---|
| UDF091z-58980501 | 03:32:58.98 | −27:40:50.1 | 26.3 ± 0.1 | 1.2 ± 0.2 | 0.1 ± 0.1 | −0.1 ± 0.1 | 036 |
|
| UDF091z-59731189 | 03:32:59.73 | −27:41:18.9 | 27.0 ± 0.1 | >2.6 | 0.2 ± 0.1 | −0.0 ± 0.1 | 024 |
|
| UDF091z-08071156 | 03:33:08.07 | −27:41:15.6 | 27.2 ± 0.1 | 1.1 ± 0.3 | −0.1 ± 0.2 | 0.2 ± 0.2 | 019 |
|
| UDF091z-02421312 | 03:33:02.42 | −27:41:31.2 | 27.3 ± 0.1 | 2.5 ± 0.7 | 0.1 ± 0.1 | −0.0 ± 0.1 | 016 |
2 |
| UDF091z-58530234 | 03:32:58.53 | −27:40:23.4 | 27.4 ± 0.1 | >2.5 | 0.2 ± 0.2 | −0.1 ± 0.1 | 016 |
2 |
| UDF091z-56930504 | 03:32:56.93 | −27:40:50.4 | 27.8 ± 0.1 | 1.4 ± 0.4 | 0.1 ± 0.2 | −0.5 ± 0.3 | 016 |
|
| UDF091z-59171517 | 03:32:59.17 | −27:41:51.7 | 27.9 ± 0.2 | 1.8 ± 0.8 | 0.0 ± 0.3 | 0.1 ± 0.2 | 022 |
|
| UDF091z-57811065 | 03:32:57.81 | −27:41:06.5 | 28.1 ± 0.2 | >1.6 | 0.2 ± 0.3 | 0.0 ± 0.3 | 019 |
|
| UDF091z-02122003 | 03:33:02.12 | −27:42:00.3 | 28.2 ± 0.2 | >2.0 | −0.0 ± 0.3 | 0.2 ± 0.2 | 016 |
|
| UDF091z-57860514 | 03:32:57.86 | −27:40:51.4 | 28.2 ± 0.2 | 1.0 ± 0.6 | 0.4 ± 0.4 | −0.9 ± 0.5 | 016 |
|
| UDF091z-07300599 | 03:33:07.30 | −27:40:59.9 | 28.4 ± 0.2 | >1.6 | 0.3 ± 0.4 | −0.4 ± 0.4 | 015 |
|
| UDF091z-58740215 | 03:32:58.74 | −27:40:21.5 | 28.4 ± 0.2 | 1.1 ± 0.5 | −0.0 ± 0.3 | −0.1 ± 0.3 | 015 |
|
| UDF091z-02822023 | 03:33:02.82 | −27:42:02.3 | 28.6 ± 0.2 | >1.3 | 0.4 ± 0.4 | −0.4 ± 0.4 | 013 |
|
| UDF091z-57511299 | 03:32:57.51 | −27:41:29.9 | 28.6 ± 0.2 | >1.5 | 0.3 ± 0.4 | −0.2 ± 0.4 | 013 |
|
| UDF091z-04582038 | 03:33:04.58 | −27:42:03.8 | 28.6 ± 0.2 | 1.1 ± 0.6 | 0.1 ± 0.3 | −0.3 ± 0.4 | 013 |
|
| UDF091z-00471180 | 03:33:00.47 | −27:41:18.0 | 28.6 ± 0.2 | 1.3 ± 0.7 | 0.1 ± 0.3 | 0.0 ± 0.3 | 012 |
|
| UDF091z-03791123 | 03:33:03.79 | −27:41:12.3 | 28.7 ± 0.2 | >1.8 | −0.1 ± 0.3 | −0.4 ± 0.4 | 013 |
1 |
Notes. aLower limits on the measured colors are the 1σ limits. Magnitudes are AB. bHalf-light radius calculated using SExtractor. See footnote b from Table 10. cReferences: (1) Bouwens et al. 2008; (2) Wilkins et al. 2011.
Download table as: ASCIITypeset image
Table 12. z ∼ 7 Candidates Identified in the Ultra-deep WFC3/IR Observations Over HUDF09-2
| Object ID | R.A. | Decl. | J125 | z850 − Y105a | Y105 − J125a | J125 − H160b | rhlb | Refc |
|---|---|---|---|---|---|---|---|---|
| UDF092z-01320531 | 03:33:01.32 | −27:50:53.1 | 26.5 ± 0.1 | 1.1 ± 0.3 | 0.2 ± 0.2 | −0.1 ± 0.1 | 025 |
|
| UDF092z-09770485 | 03:33:09.77 | −27:50:48.5 | 26.9 ± 0.1 | 1.4 ± 0.5 | −0.0 ± 0.1 | 0.3 ± 0.1 | 026 |
1 |
| UDF092z-09151554 | 03:33:09.15 | −27:51:55.4 | 27.0 ± 0.1 | >2.6 | −0.1 ± 0.1 | −0.0 ± 0.1 | 017 |
1,2 |
| UDF092z-00801320 | 03:33:00.80 | −27:51:32.0 | 27.8 ± 0.1 | 0.8 ± 0.3 | 0.1 ± 0.2 | −0.0 ± 0.2 | 016 |
|
| UDF092z-05401189 | 03:33:05.40 | −27:51:18.9 | 27.9 ± 0.1 | 1.7 ± 0.9 | 0.3 ± 0.2 | −0.4 ± 0.2 | 012 |
1,2 |
| UDF092z-09710486 | 03:33:09.71 | −27:50:48.6 | 28.1 ± 0.1 | >1.5 | 0.1 ± 0.3 | −0.1 ± 0.2 | 018 |
|
| UDF092z-06571598 | 03:33:06.57 | −27:51:59.8 | 28.4 ± 0.1 | >2.1 | −0.1 ± 0.2 | −0.3 ± 0.3 | 013 |
|
| UDF092z-00921119 | 03:33:00.92 | −27:51:11.9 | 28.7 ± 0.2 | >1.4 | 0.0 ± 0.4 | −0.2 ± 0.4 | 015 |
|
| UDF092z-07420235 | 03:33:07.42 | −27:50:23.5 | 28.7 ± 0.2 | 1.1 ± 0.5 | −0.3 ± 0.3 | 0.0 ± 0.3 | 016 |
|
| UDF092z-09901262 | 03:33:09.90 | −27:51:26.2 | 28.8 ± 0.2 | >1.3 | −0.1 ± 0.3 | 0.2 ± 0.3 | 012 |
|
| UDF092z-04412250 | 03:33:04.41 | −27:52:25.0 | 28.8 ± 0.2 | 1.2 ± 0.9 | 0.1 ± 0.4 | −0.6 ± 0.6 | 015 |
|
| UDF092z-04760294 | 03:33:04.76 | −27:50:29.4 | 28.8 ± 0.2 | 1.7 ± 0.7 | −0.1 ± 0.3 | −0.3 ± 0.4 | 011 |
|
| UDF092z-04651563 | 03:33:04.65 | −27:51:56.3 | 28.9 ± 0.2 | >1.4 | 0.3 ± 0.3 | −0.2 ± 0.3 | 011 |
|
| UDF092z-04110148 | 03:33:04.11 | −27:50:14.8 | 28.9 ± 0.2 | 1.2 ± 0.9 | 0.1 ± 0.4 | −0.0 ± 0.4 | 013 |
Notes. aLower limits on the measured colors are the 1σ limits. Magnitudes are AB. bHalf-light radius calculated using SExtractor. See footnote b from Table 10. cReferences: (1) Wilkins et al. 2011; (2) McLure et al. 2011.
Download table as: ASCIITypeset image
Table 13. z ∼ 7 Candidates Identified in the Deep Wide-area ERS Observations
| Object ID | R.A. | Decl. | J125 | z850 − J125a | Y098 − J125a | J125 − H160 | rhlb | Refc |
|---|---|---|---|---|---|---|---|---|
| ERSz-2240942138 | 03:32:24.09 | −27:42:13.8 | 25.8 ± 0.1 | 1.6 ± 0.9 | 0.4 ± 0.3 | −0.1 ± 0.2 | 030 |
4,5,6 |
| ERSz-2432842478 | 03:32:43.28 | −27:42:47.8 | 25.9 ± 0.1 | 1.2 ± 0.4 | 0.7 ± 0.3 | 0.1 ± 0.1 | 024 |
1 |
| ERSz-2354442550 | 03:32:35.44 | −27:42:55.0 | 26.1 ± 0.1 | 2.2 ± 0.8 | 1.1 ± 0.3 | −0.1 ± 0.1 | 016 |
|
| ERSz-2160041591 | 03:32:16.00 | −27:41:59.1 | 26.3 ± 0.1 | 1.6 ± 0.7 | 0.3 ± 0.3 | −0.3 ± 0.2 | 026 |
6 |
| ERSz-2150943417 | 03:32:15.09 | −27:43:41.7 | 26.4 ± 0.1 | >2.2 | 1.0 ± 0.5 | −0.1 ± 0.2 | 022 |
|
| ERSz-2068244221 | 03:32:06.82 | −27:44:22.1 | 26.5 ± 0.1 | 1.1 ± 0.4 | −0.0 ± 0.2 | −0.4 ± 0.2 | 015 |
6 |
| ERSz-2295342044 | 03:32:29.53 | −27:42:04.4 | 26.6 ± 0.1 | 1.4 ± 0.6 | 0.3 ± 0.3 | −0.1 ± 0.2 | 017 |
3,4,5,6 |
| ERSz-2111644168 | 03:32:11.16 | −27:44:16.8 | 26.9 ± 0.1 | >2.0 | 1.1 ± 0.5 | −0.3 ± 0.2 | 014 |
|
| ERSz-2150242362 | 03:32:15.02 | −27:42:36.2 | 27.0 ± 0.2 | >1.2 | 0.4 ± 0.5 | 0.4 ± 0.3 | 020 |
|
| ERSz-2056344288 | 03:32:05.63 | −27:44:28.8 | 27.0 ± 0.2 | 1.4 ± 0.7 | 0.2 ± 0.4 | 0.3 ± 0.2 | 016 |
|
| ERSz-2161941497 | 03:32:16.19 | −27:41:49.7 | 27.1 ± 0.2 | >1.4 | 0.6 ± 0.5 | −0.1 ± 0.3 | 017 |
6 |
| ERSz-2225141173 | 03:32:22.51 | −27:41:17.3 | 27.2 ± 0.2 | 1.1 ± 0.5 | 0.1 ± 0.3 | 0.1 ± 0.3 | 013 |
|
| ERSz-2352941047 | 03:32:35.29 | −27:41:04.7 | 27.6 ± 0.2 | 1.1 ± 0.9 | 0.3 ± 0.5 | 0.2 ± 0.3 | 014 |
Notes. aLower limits on the measured colors are the 1σ limits. Magnitudes are AB. bHalf-light radius calculated using SExtractor. See footnote b from Table 10. cReferences: (1) Bouwens et al. 2010c; (2) Hickey et al. 2010; (3) Castellano et al. 2010a; (4) Wilkins et al. 2010; (5) Wilkins et al. 2011; (6) McLure et al. 2011.
Download table as: ASCIITypeset image
Table 14. z ∼ 8 Candidates Identified in the Ultra-deep WFC3/IR Observations in the HUDF
| Object ID | R.A. | Decl. | H160 | Y105 − J125a | J125 − H160 | rhlb | Refc |
|---|---|---|---|---|---|---|---|
| UDFy-39537174 | 03:32:39.53 | −27:47:17.4 | 26.5 ± 0.0 | 0.7 ± 0.1 | 0.1 ± 0.0 | 032 |
1,3,6,8,9,10,11,13 |
| UDFy-38807071 | 03:32:38.80 | −27:47:07.1 | 26.8 ± 0.0 | 0.5 ± 0.1 | 0.1 ± 0.0 | 015 |
1,2,3,4,5,6,8,9,10,11,13 |
| UDFy-44706443 | 03:32:44.70 | −27:46:44.3 | 27.1 ± 0.1 | 0.9 ± 0.2 | −0.1 ± 0.1 | 019 |
6,8,9,10,11,13 |
| UDFy-43136284 | 03:32:43.13 | −27:46:28.4 | 27.6 ± 0.1 | 0.5 ± 0.2 | 0.1 ± 0.1 | 018 |
6,8,9,10,11,13 |
| UDFy-37218061 | 03:32:37.21 | −27:48:06.1 | 27.6 ± 0.1 | 0.6 ± 0.2 | −0.0 ± 0.1 | 017 |
6,8,9,10,11,13 |
| UDFy-38125539 | 03:32:38.12 | −27:45:53.9 | 27.9 ± 0.1 | 1.9 ± 0.7 | 0.1 ± 0.1 | 017 |
7,8,9,10,11,12,13 |
| UDFy-42876344 | 03:32:42.87 | −27:46:34.4 | 28.0 ± 0.1 | 0.8 ± 0.2 | 0.0 ± 0.1 | 016 |
7,8,9,10,11,12,13 |
| UDFy-37636014 | 03:32:37.63 | −27:46:01.4 | 28.0 ± 0.1 | 1.8 ± 0.6 | −0.1 ± 0.1 | 022 |
7,8,9,10,11 |
| UDFy-37796001 | 03:32:37.79 | −27:46:00.1 | 28.2 ± 0.1 | 1.4 ± 0.4 | −0.1 ± 0.1 | 015 |
7,8,9,10,11,12 |
| UDFy-43076241 | 03:32:43.07 | −27:46:24.1 | 28.3 ± 0.2 | 1.4 ± 0.8 | −0.1 ± 0.3 | 028 |
8,13 |
| UDFy-38356118 | 03:32:38.35 | −27:46:11.8 | 28.5 ± 0.1 | 0.5 ± 0.2 | −0.2 ± 0.1 | 012 |
9,10,11,13 |
| UDFy-33126544 | 03:32:33.12 | −27:46:54.4 | 28.5 ± 0.2 | 0.7 ± 0.4 | −0.1 ± 0.2 | 014 |
8,9,12,13 |
| UDFy-39468075 | 03:32:39.46 | −27:48:07.5 | 28.6 ± 0.1 | >1.7 | 0.5 ± 0.2 | 012 |
|
| UDFy-43086259 | 03:32:43.08 | −27:46:25.9 | 28.6 ± 0.2 | 0.8 ± 0.5 | −0.1 ± 0.2 | 020 |
|
| UDFy-40328026 | 03:32:40.32 | −27:48:02.6 | 28.6 ± 0.2 | 1.2 ± 0.6 | 0.0 ± 0.2 | 017 |
11 |
| UDFy-35517443 | 03:32:35.51 | −27:47:44.3 | 28.9 ± 0.2 | >1.4 | 0.2 ± 0.3 | 015 |
|
| UDFy-34626472 | 03:32:34.62 | −27:46:47.2 | 29.0 ± 0.2 | 0.9 ± 0.8 | 0.2 ± 0.3 | 014 |
|
| UDFy-42406550 | 03:32:42.40 | −27:46:55.0 | 29.0 ± 0.2 | 1.1 ± 0.7 | −0.0 ± 0.3 | 016 |
|
| UDFy-43086276 | 03:32:43.08 | −27:46:27.6 | 29.1 ± 0.2 | 1.2 ± 0.5 | −0.4 ± 0.2 | 012 |
7,8,10,11,12 |
| UDFy-33436598 | 03:32:33.43 | −27:46:59.8 | 29.2 ± 0.2 | >1.6 | 0.2 ± 0.3 | 013 |
14 |
| UDFy-36816421 | 03:32:36.81 | −27:46:42.1 | 29.3 ± 0.3 | >1.3 | −0.2 ± 0.4 | 018 |
|
| UDFy-39347255 | 03:32:39.34 | −27:47:25.5 | 29.4 ± 0.2 | 0.8 ± 0.7 | 0.2 ± 0.4 | 011 |
|
| UDFy-39106493 | 03:32:39.10 | −27:46:49.3 | 29.4 ± 0.3 | 0.9 ± 0.5 | −0.7 ± 0.3 | 019 |
|
| UDFy-39505451 | 03:32:39.50 | −27:45:45.1 | 29.4 ± 0.4 | 1.0 ± 1.0 | −0.2 ± 0.5 | 015 |
Notes. aLower limits on the measured colors are the 1σ limits. Magnitudes are AB. bHalf-light radius calculated using SExtractor. See footnote b from Table 10. cReferences: (1) Bouwens et al. 2004; (2) Bouwens & Illingworth 2006; (3) Labbé et al. 2006; (4) Bouwens et al. 2008; (5) Oesch et al. 2009; (6) Oesch et al. 2010a; (7) Bouwens et al. 2010b; (8) McLure et al. 2010; (9) Bunker et al. 2010; (10) Yan et al. 2010; (11) Finkelstein et al. 2010; (12) Lorenzoni et al. 2011; (13) McLure et al. 2011; (14) Bouwens et al. 2011.
Download table as: ASCIITypeset image
Table 15. z ∼ 8 Candidates Identified in the Ultra-deep WFC3/IR Observations Over HUDF09-1
| Object ID | R.A. | Decl. | H160a | Y105 − J125b | J125 − H160a | rhlc | Refd |
|---|---|---|---|---|---|---|---|
| UDF091y-02059566 | 03:33:02.05 | −27:39:56.6 | 27.1 ± 0.1 | 1.0 ± 0.3 | 0.1 ± 0.1 | 019 |
|
| UDF091y-02812107 | 03:33:02.81 | −27:42:10.7 | 27.2 ± 0.1 | 0.7 ± 0.3 | 0.2 ± 0.1 | 019 |
|
| UDF091y-55761063 | 03:32:55.76 | −27:41:06.3 | 27.4 ± 0.1 | 0.5 ± 0.2 | 0.2 ± 0.1 | 014 |
|
| UDF091y-56451003 | 03:32:56.45 | −27:41:00.3 | 27.6 ± 0.1 | 0.6 ± 0.2 | −0.1 ± 0.2 | 019 |
|
| UDF091y-59372014 | 03:32:59.37 | −27:42:01.4 | 27.6 ± 0.1 | 0.6 ± 0.3 | 0.1 ± 0.2 | 019 |
|
| UDF091y-02020311 | 03:33:02.02 | −27:40:31.1 | 28.2 ± 0.3 | 1.4 ± 1.0 | −0.0 ± 0.4 | 020 |
|
| UDF091y-02992182 | 03:33:02.99 | −27:42:18.2 | 28.3 ± 0.2 | 0.8 ± 0.5 | −0.0 ± 0.3 | 015 |
1 |
| UDF091y-04340518 | 03:33:04.34 | −27:40:51.8 | 28.4 ± 0.2 | 0.8 ± 0.6 | 0.2 ± 0.3 | 014 |
|
| UDF091y-02081326 | 03:33:02.08 | −27:41:32.6 | 28.4 ± 0.3 | >1.6 | −0.2 ± 0.4 | 020 |
|
| UDF091y-03721514 | 03:33:03.72 | −27:41:51.4 | 28.4 ± 0.3 | 1.0 ± 0.5 | −0.4 ± 0.3 | 018 |
|
| UDF091y-00531465 | 03:33:00.53 | −27:41:46.5 | 28.5 ± 0.2 | 0.5 ± 0.4 | 0.2 ± 0.3 | 012 |
|
| UDF091y-03021569 | 03:33:03.02 | −27:41:56.9 | 28.5 ± 0.2 | 1.3 ± 0.6 | −0.4 ± 0.3 | 014 |
1 |
| UDF091y-01480311 | 03:33:01.48 | −27:40:31.1 | 28.8 ± 0.3 | 1.2 ± 1.0 | 0.2 ± 0.4 | 013 |
|
| UDF091y-05391244 | 03:33:05.39 | −27:41:24.4 | 29.1 ± 0.4 | >1.4 | −0.3 ± 0.4 | 012 |
Notes. aSee footnote b in Table 11. bLower limits on the measured colors are the 1σ limits. Magnitudes are AB. cHalf-light radius calculated using SExtractor. See footnote b from Table 10. dReference: (1) Lorenzoni et al. 2011.
Download table as: ASCIITypeset image
Table 16. z ∼ 8 Candidates Identified in the Ultra-deep WFC3/IR Observations Over HUDF09-2
| Object ID | R.A. | Decl. | H160 | Y105 − J125a | J125 − H160 | rhlb | Refc |
|---|---|---|---|---|---|---|---|
| UDF092y-03781204d | 03:33:03.78 | −27:51:20.4 | 26.1 ± 0.0 | 0.6 ± 0.1 | 0.1 ± 0.0 | 020 |
1,3 |
| UDF092y-03751196d | 03:33:03.75 | −27:51:19.6 | 26.3 ± 0.0 | 0.7 ± 0.1 | −0.0 ± 0.1 | 023 |
3 |
| UDF092y-07580550 | 03:33:07.58 | −27:50:55.0 | 27.1 ± 0.1 | >2.4 | 0.3 ± 0.1 | 022 |
3 |
| UDF092y-04640529d | 03:33:04.64 | −27:50:52.9 | 27.2 ± 0.1 | 0.8 ± 0.2 | −0.1 ± 0.1 | 015 |
3 |
| UDF092y-09661163 | 03:33:09.66 | −27:51:16.3 | 27.2 ± 0.1 | 1.3 ± 0.6 | 0.5 ± 0.2 | 024 |
2 |
| UDF092y-06321217 | 03:33:06.32 | −27:51:21.7 | 27.7 ± 0.1 | 0.6 ± 0.2 | 0.0 ± 0.1 | 015 |
|
| UDF092y-09611126 | 03:33:09.61 | −27:51:12.6 | 27.9 ± 0.2 | 0.8 ± 0.5 | 0.1 ± 0.2 | 022 |
|
| UDF092y-06970279 | 03:33:06.97 | −27:50:27.9 | 28.0 ± 0.2 | >1.7 | −0.1 ± 0.3 | 022 |
|
| UDF092y-09291320 | 03:33:09.29 | −27:51:32.0 | 28.2 ± 0.2 | 0.8 ± 0.5 | −0.2 ± 0.3 | 020 |
|
| UDF092y-03391003 | 03:33:03.39 | −27:51:00.3 | 28.2 ± 0.2 | 1.2 ± 0.6 | 0.1 ± 0.2 | 014 |
|
| UDF092y-04242094 | 03:33:04.24 | −27:52:09.4 | 28.3 ± 0.1 | 1.0 ± 0.6 | 0.5 ± 0.2 | 011 |
|
| UDF092y-03811034 | 03:33:03.81 | −27:51:03.4 | 28.3 ± 0.2 | 0.5 ± 0.4 | 0.1 ± 0.2 | 016 |
|
| UDF092y-06391247 | 03:33:06.39 | −27:51:24.7 | 28.3 ± 0.2 | 0.7 ± 0.3 | −0.5 ± 0.2 | 016 |
|
| UDF092y-08891430 | 03:33:08.89 | −27:51:43.0 | 28.4 ± 0.2 | 0.5 ± 0.5 | 0.4 ± 0.3 | 012 |
|
| UDF092y-01971379 | 03:33:01.97 | −27:51:37.9 | 28.4 ± 0.2 | 0.8 ± 0.6 | 0.0 ± 0.3 | 020 |
|
| UDF092y-07830324 | 03:33:07.83 | −27:50:32.4 | 28.7 ± 0.3 | >1.1 | 0.0 ± 0.4 | 016 |
Notes. aLower limits on the measured colors are the 1σ limits. Magnitudes are AB. bHalf-light radius calculated using SExtractor. See footnote b from Table 10. cReferences: (1) Wilkins et al. 2011; (2) Lorenzoni et al. 2011; (3) McLure et al. 2011. dAll three sources here are within 30'' of each other (two being within 3'' of each other), have consistent Y105 − J125 colors (and thus redshifts), and are among the brightest z ∼ 7.5 galaxies in the field. They would appear to be part of a possible overdensity.
Download table as: ASCIITypeset image
Table 17. z ∼ 8 Candidates Identified in the Deep Wide-area ERS Observations
| Object ID | R.A. | Decl. | H160 | z850 − J125a | Y098 − J125a | J125 − H160 | rhlb | Refc |
|---|---|---|---|---|---|---|---|---|
| ERSY-2306143041d | 03:32:30.61 | −27:43:04.1 | 26.0 ± 0.1 | 2.0 ± 0.8 | 1.4 ± 0.7 | 0.3 ± 0.2 | 023 |
|
| ERSY-2399642019 | 03:32:39.96 | −27:42:01.9 | 26.4 ± 0.2 | >1.4 | >1.5 | 0.3 ± 0.2 | 022 |
|
| ERSY-2251641574 | 03:32:25.16 | −27:41:57.4 | 26.8 ± 0.2 | >1.7 | >1.5 | 0.0 ± 0.3 | 021 |
|
| ERSY-2029843519 | 03:32:02.98 | −27:43:51.9 | 26.8 ± 0.2 | >1.7 | >1.6 | 0.1 ± 0.3 | 014 |
1,2 |
| ERSY-2377942344e | 03:32:37.79 | −27:42:34.4 | 26.8 ± 0.2 | >1.9 | >1.7 | 0.2 ± 0.2 | 014 |
|
| ERSY-2354441327 | 03:32:35.44 | −27:41:32.7 | 27.2 ± 0.2 | >1.6 | >1.7 | −0.1 ± 0.3 | 014 |
2 |
Notes. aLower limits on the measured colors are the 1σ limits. Magnitudes are AB. bHalf-light radius calculated using SExtractor. See footnote b from Table 10. cReferences: (1) Lorenzoni et al. 2011; (2) McLure et al. 2011. dSource is formally "detected" at ∼1σ in the V606 band and ∼1.3σ in the z850 band, so is more likely to be at low redshift than the other candidates. eSource has H160 − 3.6 μ and H160 − 4.5 μ colors of ∼2 mag, which is quite red for a z ∼ 8 galaxy and may indicate it has a redshift z ∼ 2–3.
Download table as: ASCIITypeset image
Sources that just missed our HUDF09 or ERS z ≳ 7 selections as a result of flux in the optical bands (χ2opt) or colors that just missed our selection criteria are given in Tables 18–20 (see Appendix D).
Table 18. Possible z ∼ 7 Candidates Over the HUDF09 Fields that did not Meet Our Selection Criteriaa
| Object ID | R.A. | Decl. | J125 | z850 − Y105b | Y105 − J125b | J125 − H160 | rhlc | Refd |
|---|---|---|---|---|---|---|---|---|
| UDF092z-01101160 | 03:33:01.10 | −27:51:16.0 | 25.9 ± 0.0 | 0.8 ± 0.1 | 0.2 ± 0.1 | −0.0 ± 0.0 | 026 |
4 |
| UDF091z-56701076 | 03:32:56.70 | −27:41:07.6 | 26.7 ± 0.1 | 1.4 ± 0.3 | 0.4 ± 0.1 | −0.1 ± 0.1 | 020 |
3 |
| UDF091z-59481461 | 03:32:59.48 | −27:41:46.1 | 27.6 ± 0.1 | 1.1 ± 0.5 | 0.1 ± 0.2 | −0.6 ± 0.3 | 025 |
|
| UDF091z-59270343 | 03:32:59.27 | −27:40:34.3 | 27.8 ± 0.1 | >2.0 | 0.2 ± 0.2 | −0.2 ± 0.2 | 019 |
|
| UDFz-37296175 | 03:32:37.29 | −27:46:17.5 | 28.0 ± 0.1 | >1.7 | 0.1 ± 0.2 | 0.2 ± 0.2 | 028 |
2 |
| UDF091z-58830381 | 03:32:58.83 | −27:40:38.1 | 28.1 ± 0.1 | 1.0 ± 0.4 | 0.1 ± 0.2 | 0.1 ± 0.2 | 015 |
|
| UDF092z-07961350 | 03:33:07.96 | −27:51:35.0 | 28.1 ± 0.1 | 1.7 ± 0.7 | 0.1 ± 0.2 | 0.1 ± 0.1 | 012 |
|
| UDFz-36916516 | 03:32:36.91 | −27:46:51.6 | 28.2 ± 0.2 | >1.1 | 0.2 ± 0.4 | 0.0 ± 0.3 | 044 |
|
| UDFz-36467324 | 03:32:36.46 | −27:47:32.4 | 28.3 ± 0.1 | 1.6 ± 0.6 | −0.1 ± 0.2 | 0.4 ± 0.1 | 016 |
1,2 |
| UDF092z-08551377 | 03:33:08.55 | −27:51:37.7 | 28.3 ± 0.2 | >1.2 | −0.1 ± 0.3 | 0.2 ± 0.3 | 022 |
|
| UDF091z-04781529 | 03:33:04.78 | −27:41:52.9 | 28.3 ± 0.2 | >1.5 | 0.2 ± 0.4 | −0.1 ± 0.4 | 019 |
|
| UDF091z-59561338 | 03:32:59.56 | −27:41:33.8 | 28.3 ± 0.2 | 1.8 ± 0.6 | −0.3 ± 0.3 | −0.4 ± 0.4 | 019 |
|
| UDF091z-01020006 | 03:33:01.02 | −27:40:00.6 | 28.4 ± 0.2 | 1.2 ± 0.7 | −0.1 ± 0.3 | −0.5 ± 0.5 | 018 |
|
| UDFz-42247087 | 03:32:42.24 | −27:47:08.7 | 28.5 ± 0.2 | 1.5 ± 0.8 | −0.2 ± 0.2 | 0.4 ± 0.2 | 020 |
2 |
| UDF091z-59451483 | 03:32:59.45 | −27:41:48.3 | 28.6 ± 0.2 | >1.4 | −0.1 ± 0.4 | −0.1 ± 0.4 | 016 |
|
| UDF091z-02071130 | 03:33:02.07 | −27:41:13.0 | 28.7 ± 0.2 | 0.7 ± 0.5 | −0.0 ± 0.4 | 0.0 ± 0.4 | 015 |
|
| UDF092z-10561177 | 03:33:10.56 | −27:51:17.7 | 28.7 ± 0.2 | 0.9 ± 0.6 | −0.1 ± 0.3 | 0.1 ± 0.3 | 015 |
|
| UDF092z-09690571 | 03:33:09.69 | −27:50:57.1 | 28.7 ± 0.3 | >0.8 | 0.1 ± 0.5 | −0.0 ± 0.4 | 018 |
|
| UDFz-40506512 | 03:32:40.50 | −27:46:51.2 | 28.8 ± 0.2 | >1.3 | 0.3 ± 0.3 | −0.6 ± 0.3 | 014 |
|
| UDF091z-59842044 | 03:32:59.84 | −27:42:04.4 | 28.8 ± 0.2 | 1.4 ± 0.9 | 0.2 ± 0.4 | 0.1 ± 0.3 | 014 |
|
| UDF091z-05751079 | 03:33:05.75 | −27:41:07.9 | 28.9 ± 0.2 | >1.2 | 0.3 ± 0.5 | −0.0 ± 0.4 | 013 |
|
| UDF092z-07192310 | 03:33:07.19 | −27:52:31.0 | 28.9 ± 0.3 | >0.9 | 0.2 ± 0.5 | −0.0 ± 0.4 | 015 |
|
| UDF092z-07582097 | 03:33:07.58 | −27:52:09.7 | 28.9 ± 0.3 | 0.9 ± 1.1 | 0.3 ± 0.6 | 0.3 ± 0.4 | 016 |
|
| UDF092z-06900317 | 03:33:06.90 | −27:50:31.7 | 29.0 ± 0.2 | >1.4 | −0.2 ± 0.4 | 0.4 ± 0.3 | 014 |
|
| UDF092z-06960354 | 03:33:06.96 | −27:50:35.4 | 29.0 ± 0.3 | >0.8 | 0.2 ± 0.6 | 0.2 ± 0.4 | 014 |
|
| UDF092z-04992391 | 03:33:04.99 | −27:52:39.1 | 29.0 ± 0.3 | >0.9 | 0.1 ± 0.5 | 0.3 ± 0.4 | 015 |
|
| UDFz-41357078 | 03:32:41.35 | −27:47:07.8 | 29.2 ± 0.2 | 0.9 ± 0.9 | −0.1 ± 0.4 | 0.1 ± 0.3 | 016 |
|
| UDFz-37316420 | 03:32:37.31 | −27:46:42.0 | 29.2 ± 0.2 | 1.5 ± 0.6 | −0.5 ± 0.3 | −0.9 ± 0.7 | 015 |
Notes. aEach of the sources here satisfies the color criteria for our dropout selections, but shows slight detections in the χ2opt images generated from the B435, V606, and i775 data. These sources therefore do not make it into our LBG samples. See Section 3.3 and Appendix D for a discussion of χ2opt and our selection criteria. While a few of these sources will correspond to z ≳ 7 galaxies, the majority will not according to our simulations (Appendix D). For a few sources, the χ2opt detection comes almost entirely from the i775 band, suggesting that some might nevertheless have redshifts slightly above z ∼ 6. bLower limits on the measured colors are the 1σ limits. Magnitudes are AB. cHalf-light radius calculated using SExtractor. dReferences: (1) McLure et al. 2010; (2) Finkelstein et al. 2010; (3) Wilkins et al. 2011; (4) McLure et al. 2011.
Download table as: ASCIITypeset image
Table 19. Possible z ∼ 8 Candidates Over the HUDF09 Fields that did not Meet Our Selection Criteriaa
| Object ID | R.A. | Decl. | J125 | Y105 − J125b | J125 − H160 | rhlc | Refd |
|---|---|---|---|---|---|---|---|
| UDF092y-10571166 | 03:33:10.57 | −27:51:16.6 | 27.3 ± 0.1 | 0.6 ± 0.2 | 0.4 ± 0.1 | 015 |
|
| UDF092y-07492060 | 03:33:07.49 | −27:52:06.0 | 27.5 ± 0.1 | >1.9 | 0.5 ± 0.2 | 020 |
|
| UDF091y-06330449 | 03:33:06.33 | −27:40:44.9 | 27.7 ± 0.3 | 0.8 ± 0.5 | −0.2 ± 0.4 | 023 |
|
| UDF091y-59771436 | 03:32:59.77 | −27:41:43.6 | 28.0 ± 0.2 | 0.5 ± 0.5 | 0.3 ± 0.3 | 017 |
|
| UDF092y-07091160 | 03:33:07.09 | −27:51:16.0 | 28.0 ± 0.2 | 1.1 ± 0.4 | −0.4 ± 0.2 | 019 |
2 |
| UDFy-35177170 | 03:32:35.17 | −27:47:17.0 | 28.1 ± 0.1 | 0.5 ± 0.4 | 0.2 ± 0.2 | 023 |
1 |
| UDF092y-05720119 | 03:33:05.72 | −27:50:11.9 | 28.1 ± 0.2 | 0.5 ± 0.5 | 0.3 ± 0.3 | 020 |
|
| UDFy-43416360 | 03:32:43.41 | −27:46:36.0 | 28.2 ± 0.1 | 1.0 ± 0.5 | 0.2 ± 0.2 | 019 |
1 |
| UDF092y-08721095 | 03:33:08.72 | −27:51:09.5 | 28.3 ± 0.2 | 0.9 ± 0.6 | 0.2 ± 0.2 | 015 |
|
| UDF092y-03671041 | 03:33:03.67 | −27:51:04.1 | 28.3 ± 0.2 | 1.0 ± 0.5 | 0.1 ± 0.2 | 016 |
|
| UDF092y-10621086 | 03:33:10.62 | −27:51:08.6 | 28.3 ± 0.3 | 0.9 ± 0.9 | 0.1 ± 0.4 | 020 |
|
| UDF091y-59101018 | 03:32:59.10 | −27:41:01.8 | 28.3 ± 0.3 | 1.4 ± 0.9 | −0.2 ± 0.4 | 020 |
|
| UDFy-41787344 | 03:32:41.78 | −27:47:34.4 | 28.4 ± 0.1 | 0.5 ± 0.3 | 0.0 ± 0.2 | 019 |
|
| UDF092y-02731564 | 03:33:02.73 | −27:51:56.4 | 28.4 ± 0.1 | 0.9 ± 0.5 | 0.4 ± 0.2 | 010 |
|
| UDF091y-59522015 | 03:32:59.52 | −27:42:01.5 | 28.5 ± 0.3 | 0.6 ± 0.6 | −0.0 ± 0.4 | 018 |
|
| UDF092y-08680370 | 03:33:08.68 | −27:50:37.0 | 28.6 ± 0.2 | 1.2 ± 0.9 | 0.1 ± 0.3 | 015 |
|
| UDF091y-00240470 | 03:33:00.24 | −27:40:47.0 | 28.6 ± 0.3 | >1.5 | −0.2 ± 0.4 | 019 |
|
| UDF092y-07090218 | 03:33:07.09 | −27:50:21.8 | 28.6 ± 0.3 | 0.5 ± 0.4 | −0.5 ± 0.3 | 018 |
|
| UDF091y-00252004 | 03:33:00.25 | −27:42:00.4 | 28.6 ± 0.3 | 0.6 ± 0.4 | −0.3 ± 0.3 | 013 |
|
| UDF092y-00841085 | 03:33:00.84 | −27:51:08.5 | 28.6 ± 0.3 | 0.6 ± 0.4 | −0.6 ± 0.4 | 018 |
|
| UDF091y-06790538 | 03:33:06.79 | −27:40:53.8 | 28.6 ± 0.4 | >1.4 | −0.4 ± 0.5 | 019 |
|
| UDFy-38008154 | 03:32:38.00 | −27:48:15.4 | 28.7 ± 0.2 | 0.6 ± 0.3 | −0.3 ± 0.2 | 019 |
|
| UDFy-36497453 | 03:32:36.49 | −27:47:45.3 | 28.7 ± 0.2 | 1.2 ± 1.0 | 0.3 ± 0.3 | 019 |
|
| UDF091y-06211046 | 03:33:06.21 | −27:41:04.6 | 28.7 ± 0.3 | 0.8 ± 0.6 | −0.2 ± 0.4 | 016 |
|
| UDF092y-09631474 | 03:33:09.63 | −27:51:47.4 | 28.7 ± 0.3 | 1.1 ± 1.0 | 0.2 ± 0.4 | 014 |
|
| UDF092y-07941445 | 03:33:07.94 | −27:51:44.5 | 28.8 ± 0.2 | 0.5 ± 0.5 | 0.3 ± 0.3 | 011 |
|
| UDFy-37398129 | 03:32:37.39 | −27:48:12.9 | 28.8 ± 0.2 | 1.5 ± 0.9 | −0.3 ± 0.3 | 020 |
|
| UDF092y-01571044 | 03:33:01.57 | −27:51:04.4 | 28.8 ± 0.3 | 0.7 ± 0.8 | 0.2 ± 0.4 | 014 |
|
| UDF091y-03941583 | 03:33:03.94 | −27:41:58.3 | 28.8 ± 0.3 | 0.9 ± 0.7 | 0.0 ± 0.4 | 013 |
|
| UDF092y-05842094 | 03:33:05.84 | −27:52:09.4 | 28.8 ± 0.4 | 1.0 ± 0.9 | −0.2 ± 0.4 | 018 |
|
| UDF092y-08061458 | 03:33:08.06 | −27:51:45.8 | 28.9 ± 0.3 | >1.4 | −0.3 ± 0.4 | 015 |
|
| UDFy-37517553 | 03:32:37.51 | −27:47:55.3 | 29.0 ± 0.2 | >1.5 | 0.0 ± 0.3 | 016 |
|
| UDF092y-07220444 | 03:33:07.22 | −27:50:44.4 | 29.0 ± 0.3 | >1.1 | 0.0 ± 0.4 | 012 |
|
| UDF092y-02271378 | 03:33:02.27 | −27:51:37.8 | 29.0 ± 0.3 | 0.6 ± 0.6 | −0.2 ± 0.4 | 015 |
|
| UDF092y-10231298 | 03:33:10.23 | −27:51:29.8 | 29.0 ± 0.3 | 0.8 ± 0.6 | −0.3 ± 0.4 | 012 |
|
| UDF092y-10121280 | 03:33:10.12 | −27:51:28.0 | 29.0 ± 0.3 | 0.9 ± 0.6 | −0.4 ± 0.4 | 014 |
|
| UDFy-39405459 | 03:32:39.40 | −27:45:45.9 | 29.0 ± 0.3 | 1.3 ± 0.9 | −0.4 ± 0.4 | 029 |
|
| UDF092y-09351539 | 03:33:09.35 | −27:51:53.9 | 29.0 ± 0.4 | >1.2 | −0.1 ± 0.5 | 014 |
|
| UDFy-43347121 | 03:32:43.34 | −27:47:12.1 | 29.1 ± 0.3 | 1.1 ± 0.8 | −0.1 ± 0.3 | 017 |
|
| UDFy-38396038 | 03:32:38.39 | −27:46:03.8 | 29.2 ± 0.2 | 1.0 ± 0.7 | 0.1 ± 0.3 | 014 |
|
| UDFy-39807470 | 03:32:39.80 | −27:47:47.0 | 29.3 ± 0.2 | >1.0 | 0.3 ± 0.4 | 015 |
|
| UDFy-34437343 | 03:32:34.43 | −27:47:34.3 | 29.3 ± 0.4 | 0.8 ± 0.8 | −0.4 ± 0.5 | 020 |
|
| UDFy-37706328 | 03:32:37.70 | −27:46:32.8 | 29.4 ± 0.3 | 0.9 ± 0.7 | −0.2 ± 0.4 | 015 |
Notes. aEach of the sources here satisfies the color criteria for our LBG selections, but shows slight detections in the χ2opt images generated from the B435, V606, i775, and z850 data. These sources therefore do not make it into our LBG samples. See Section 3.3 and Appendix D for a discussion of χ2opt and our selection criteria. While a few of these sources will correspond to z ≳ 7 galaxies, the majority will not according to our simulations (Appendix D). bLower limits on the measured colors are the 1σ limits. Magnitudes are AB. cHalf-light radius calculated using SExtractor. dReferences: (1) Yan et al. 2010; (2) Wilkins et al. 2011.
Download table as: ASCIITypeset image
Table 20. Possible z ∼ 7–8 Candidates that did not Meet Our Selection Criteriaa
| Object ID | R.A. | Decl. | J125 | z850 − J125b | Y098 − J125b | J125 − H160 | rhlc | Refd |
|---|---|---|---|---|---|---|---|---|
| Possible z ∼ 7 candidates | ||||||||
| ERSz-2320541505f | 03:32:32.05 | −27:41:50.5 | 25.9 ± 0.1 | 1.9 ± 0.7 | 1.2 ± 0.4 | 0.3 ± 0.1 | 028 |
|
| ERSz-2226543006g | 03:32:22.65 | −27:43:00.6 | 26.1 ± 0.1 | 1.1 ± 0.3 | 0.1 ± 0.2 | 0.4 ± 0.1 | 020 |
1,2,3,5 |
| ERSz-2279041042e | 03:32:27.90 | −27:41:04.2 | 26.2 ± 0.1 | 2.7 ± 0.8 | 0.7 ± 0.2 | −0.6 ± 0.1 | 011 |
5 |
| ERSz-2097545591f | 03:32:09.75 | −27:45:59.1 | 26.2 ± 0.2 | >1.8 | 0.7 ± 0.5 | 0.0 ± 0.3 | 024 |
|
| ERSz-2030845122e,g | 03:32:03.08 | −27:45:12.2 | 26.3 ± 0.1 | 1.1 ± 0.4 | 1.1 ± 0.4 | 0.2 ± 0.1 | 013 |
|
| ERSz-2104045407g | 03:32:10.40 | −27:45:40.7 | 26.5 ± 0.1 | 0.8 ± 0.4 | 0.4 ± 0.3 | 0.2 ± 0.2 | 023 |
|
| ERSz-1599542348f | 03:31:59.95 | −27:42:34.8 | 26.5 ± 0.2 | 0.9 ± 0.6 | 0.7 ± 0.6 | 0.3 ± 0.2 | 027 |
|
| ERSz-2417341555g | 03:32:41.73 | −27:41:55.5 | 26.6 ± 0.2 | >1.2 | 0.5 ± 0.5 | 0.4 ± 0.3 | 031 |
|
| ERSz-2313142239f | 03:32:31.31 | −27:42:23.9 | 26.6 ± 0.2 | 1.0 ± 0.5 | 0.8 ± 0.5 | 0.2 ± 0.2 | 021 |
|
| ERSz-2338641089f | 03:32:33.86 | −27:41:08.9 | 26.6 ± 0.2 | 1.4 ± 0.8 | 0.6 ± 0.4 | 0.1 ± 0.2 | 027 |
|
| ERSz-2413843168g | 03:32:41.38 | −27:43:16.8 | 26.8 ± 0.1 | 0.9 ± 0.3 | 0.3 ± 0.2 | 0.0 ± 0.2 | 013 |
|
| ERSz-2308840450h | 03:32:30.88 | −27:40:45.0 | 26.8 ± 0.2 | 1.1 ± 0.6 | 0.8 ± 0.6 | 0.1 ± 0.3 | 022 |
|
| ERSz-2379242208i | 03:32:37.92 | −27:42:20.8 | 27.0 ± 0.2 | >1.4 | 1.1 ± 0.9 | 0.3 ± 0.3 | 024 |
|
| ERSz-2202443342g | 03:32:20.24 | −27:43:34.2 | 27.0 ± 0.2 | 0.8 ± 0.5 | 0.3 ± 0.3 | −0.1 ± 0.3 | 019 |
|
| ERSz-2346843052g | 03:32:34.68 | −27:43:05.2 | 27.0 ± 0.2 | 1.7 ± 0.9 | 0.5 ± 0.4 | 0.1 ± 0.3 | 019 |
|
| ERSz-2400642142i | 03:32:40.06 | −27:42:14.2 | 27.2 ± 0.2 | >1.5 | 1.0 ± 0.7 | 0.2 ± 0.3 | 017 |
|
| ERSz-2153943286g | 03:32:15.39 | −27:43:28.6 | 27.2 ± 0.2 | 0.9 ± 0.5 | −0.0 ± 0.3 | −0.3 ± 0.3 | 013 |
|
| ERSz-2232742361f | 03:32:23.27 | −27:42:36.1 | 27.2 ± 0.2 | 0.9 ± 0.5 | 0.2 ± 0.4 | 0.0 ± 0.3 | 016 |
|
| ERSz-2426643478g | 03:32:42.66 | −27:43:47.8 | 27.2 ± 0.2 | 1.2 ± 0.8 | >1.2 | 0.3 ± 0.3 | 015 |
|
| ERSz-2229344099g | 03:32:22.93 | −27:44:09.9 | 27.3 ± 0.2 | 1.0 ± 0.5 | 0.1 ± 0.4 | 0.3 ± 0.3 | 014 |
5 |
| ERSz-2267841314f,i | 03:32:26.78 | −27:41:31.4 | 27.4 ± 0.2 | >1.6 | 0.8 ± 0.6 | −0.0 ± 0.3 | 016 |
|
| ERSz-2270041428g | 03:32:27.00 | −27:41:42.8 | 27.5 ± 0.2 | 0.8 ± 0.5 | 0.1 ± 0.3 | −0.2 ± 0.3 | 015 |
|
| ERSz-2202541197f | 03:32:20.25 | −27:41:19.7 | 27.5 ± 0.2 | 1.3 ± 0.9 | 0.3 ± 0.5 | 0.3 ± 0.3 | 015 |
|
| Possible z ∼ 8 candidates | ||||||||
| ERSY-2146242369l | 03:32:14.62 | −27:42:36.9 | 26.0 ± 0.1 | >1.7 | 1.3 ± 0.7 | 0.5 ± 0.2 | 025 |
|
| ERSY-2416741275f,m | 03:32:41.67 | −27:41:27.5 | 26.1 ± 0.1 | >1.4 | >1.4 | 0.6 ± 0.2 | 021 |
|
| ERSY-2165043527k | 03:32:16.50 | −27:43:52.7 | 26.2 ± 0.1 | >2.2 | 1.3 ± 0.5 | 0.0 ± 0.2 | 021 |
|
| ERSY-2376440061n | 03:32:37.64 | −27:40:06.1 | 27.0 ± 0.3 | 1.3 ± 0.9 | >1.3 | 0.1 ± 0.3 | 041 |
|
| ERSY-2367541341j | 03:32:36.75 | −27:41:34.1 | 27.1 ± 0.2 | >1.4 | >1.4 | 0.3 ± 0.3 | 017 |
|
| ERSY-2107343270f | 03:32:10.73 | −27:43:27.0 | 28.2 ± 0.3 | >1.1 | >1.4 | −0.3 ± 0.4 | 012 |
|
Notes.
aSources in this table either slightly miss our selection criteria or show slight detections in the χ2opt images generated from the B435, V606, i775, and z850 data. These sources therefore do not make it into our LBG samples. See Section 3.3 and Appendix D for a discussion of χ2opt and our selection criteria.
bLower limits on the measured colors are the 1σ limits. Magnitudes are AB.
cHalf-light radius calculated using SExtractor.
dReferences: (1) Bouwens et al. 2010c; (2) Hickey et al. 2010; (3) Castellano et al. 2010a; (4) Wilkins et al. 2010; (5) Wilkins et al. 2011.
eThe size/structure of this source and its colors are consistent with the source being a T-dwarf. The case is particularly compelling for ERS-2279041041.
fShow slight (>1.5σ) detections in one or more optical bands, strongly suggesting they do not correspond to bona fide z ∼ 7–8 galaxies. For ERSz-2097545591, the detection is only apparent in a small 02 diameter aperture.
gIf a star-forming galaxy, more likely at z ∼ 6–6.6.
hThis source shows a red Y − J ∼ 1 color—and hence a possible z ∼ 7 galaxy if the Lyman break falls between the Y and J bands—but the source is also detected at >1.5σ in the i and z bands.
iDespite not satisfying our selection criteria, these sources may correspond to z ≳ 6.5 galaxies.
jSmall 2σ detection evident in a small 02 diameter aperture in the B435 band.
k2σ detection in the i band and apparent 1σ detection in the z band inconsistent with source being at z ∼ 8.
l2σ detection in the V606 band in 02 diameter aperture.
mRed J − H ∼ 0.6 color suggests this source is likely a low-redshift, intrinsic red galaxy.
nSlight detection in i775 and z850 bands in 02 diameter aperture.
Download table as: ASCIITypeset image
Footnotes
- *
Based on observations made with the NASA/ESA Hubble Space Telescope, which is operated by the Association of Universities for Research in Astronomy, Inc., under NASA contract NAS 5-26555. These observations are associated with programs 11563, 9797, and 10632.
- 9
The configuration of these segments within the CDF-South GOODS mosaic is illustrated in http://archive.stsci.edu/pub/hlsp/goods/v1/h_cdfs_v1.0sects_plt.jpg.
- 10
- 11
The derived Schechter parameters depend significantly on whether we include or exclude the two brightest (∼26 AB mag) z ∼ 8 galaxies in the HUDF09-2 field. If we exclude the two brightest galaxies (assuming they represent a rare overdensity), we derive a significantly fainter characteristic luminosity M* and larger normalization ϕ*: M* = −19.54 ± 0.56, ϕ* = 1.5+2.9−1.0 × 10⁻³ Mpc−3, and α = −1.67 ± 0.40.
- 12
- 13
The stellar mass density estimated at z ∼ 8 (Labbé et al. 2010b)—although uncertain—suggests a certain SFR density at z ≳ 8. Of course, since the stellar mass is an integral quantity (and there are a large range of plausible SF histories that yield the observed stellar mass density), a redshift dependence needs to be assumed. We adopt the same scaling of the stellar mass density with redshift at z ≳ 8, i.e., (1 + z)−4.4, as Labbé et al. (2010b) found to fit the observational results at z ∼ 4–8.
- 14
The difference increases slightly at earlier times where the galaxy stellar mass function is more poorly determined and extrapolations are used.