


Abstract
Using non-invasive 3D ultrasound, peak wall stress (PWS) and aortic stiffness can be evaluated, which may provide additional criteria in abdominal aortic aneurysm (AAA) risk assessment. In this study, these measures were determined in both young and age-matched individuals, and AAA patients while its relation to age, maximum diameter, and growth was assessed statistically.
Time-resolved 3D-US data were acquired for 30 volunteers and 65 AAA patients. The aortic geometry was segmented, and tracked over the cardiac cycle using 3D speckle tracking to characterize the wall motion. Wall stress analysis was performed using finite element analysis. Model parameters were optimized until the model output matched the measured 3D displacements. A significant increase in aortic stiffness was measured between the age-matched volunteers [median 0.58, interquartile range (IQR) 0.48–0.71 kPa⋅m] and the small AAA patients (median 1.84, IQR 1.38–2.46 kPa⋅m; P < 0.001). In addition, an increase in aortic stiffness was evaluated between the small (30–39 mm) and large (≥50 mm) AAAs (median 2.72, IQR 1.99–3.14 kPa⋅m; P = 0.01). The 99th percentile wall stress showed a positive correlation with diameter (ρ = 0.73, P < 0.001), and significant differences between age-matched volunteers and AAA patients.
The AAA pathology causes an early and significant increase in aortic stiffness of the abdominal aorta, even after correcting for the expected effect of ageing and differences in arterial pressure. Moreover, some AAAs revealed relatively high PWS, although the maximum diameter was below the threshold for surgical repair. Using the current method, these measures become available during follow-up, which could improve AAA rupture risk assessment.
Introduction
An abdominal aortic aneurysm (AAA) is a progressive widening of the aorta which eventually may rupture when no medical treatment is performed. The majority of all AAAs are asymptomatic until rupture, which leads to a life threatening haemorrhage. Therefore, surgical repair is performed when the risk of rupture outweighs the risk of surgery. Current clinical guidelines suggest to perform operative repair of the aneurysm: (i) when the maximum diameter is larger than 55 mm for men and 52 mm for women, (ii) if rapid growth is observed (maximum diameter >10 mm/year), or (iii) when the aneurysm becomes symptomatic.1 Although these guidelines are based on large randomized controlled trails, a population-based average is used to quantify the individual patient-specific rupture risk.2,3 As a consequence of current AAA management, small aneurysms prone for rupture are left untreated despite the fact that 2–10% of all AAAs rupture before the threshold for surgical intervention is reached.3,4 Thereby, other AAAs which are currently treated might be exposed to unnecessary surgical risks since the aneurysm could remain stable.5,6 These data suggest that maximum diameter evaluation alone is not sufficient to predict the patient-specific rupture risk of an AAA and a more personalized approach is needed.
From a biomechanics perspective, AAA wall mechanics plays an import role in the distinction between stable and more susceptible aneurysms. Wall stress analysis has been proposed in literature, which provides the peak stress in de aortic wall based on the AAA geometry, blood pressure, and mechanical properties of the AAA wall. These models showed that symptomatic, and ruptured AAAs have a higher peak wall stress (PWS) compared with the asymptomatic, non-ruptured AAAs.7,8 Thereby, in a meta-analysis of Khosla et al.,9 this finding was strengthened and remained significant when the systolic blood pressure was standardized for all patients at 120 mmHg. Finally, Gasser et al.10 showed in a large retrospective study with 243 patients that the PWS is higher in ruptured than non-ruptured cases which could help clinical decision making. Despite these promising results, wall stress analysis has not yet been introduced in clinical workflow due to the lack clinical validation based on prospective clinical trials. The main reason is the use of computed tomography (CT) imaging for geometry assessment in current studies which suffer from its drawbacks, such as radiation exposure and the use of nephrotoxic contrast agents. Magnetic resonance imaging (MRI) has been proposed as alternative but is not easily implemented due to the long scan time and high costs.11
Recently, 3D ultrasound (US) has been clinically introduced and showed its feasibility in the assessment of the full 3D AAA geometry. US based wall stress analysis has been proposed and showed similar wall stress results compared with CT imaging.12 Thereby, 3D US is relatively cheap and it does not suffer from the drawbacks of using CT or MRI. Of course, 3D US has a limited field of view, but if the shoulders of the AAA, i.e. the areas with high curvature, are in the acquired image, wall stress analysis can be performed accurately.13 Consequently, 3D US is an ideal imaging modality to calculate PWS in a prospective clinical study.
In addition, using 4D (time-resolved 3D) US imaging not only wall stress analysis can be performed. By capturing the dynamic motion of the aortic wall, the strain and mechanical properties of the AAA wall can be assessed simultaneously by fitting the displacements in the finite element model to the measured US-based 3D displacement field.14,15 Moreover, the use of (time resolved) 3D US opens new opportunities to perform studies on smaller aneurysms and even healthy volunteers, which is not feasible with CT and MRI due to the aforementioned drawbacks or practical issues.
The purpose of this study was to characterize the aortic stiffness and PWS in young individuals, age-matched individuals, and AAA patients, and compare the results between normal aortas and aortas with different degrees of aneurysmal disease. Their relation to age, maximum diameter, and growth was assessed and statistically analysed.
Methods
Study population and data acquisition
Time-resolved 3D US data were acquired for 30 healthy volunteers and 65 AAA patients during breath hold. All participants gave informed consent to this study, which was approved by the local ethics committee. The healthy volunteers consisted of a relatively young participants group with an age <30 years (n = 10, average age of 24.0 ± 2.0 years) and a group of participants which were at least 55 years old (n = 20, average age of 59.3 ± 6.6 years). All 65 AAA patients were divided in three different groups based on the maximum diameter of the aneurysm, i.e. small AAAs (diameter 30–39 mm, n = 25), moderate AAAs (diameter 40–49 mm, n = 20), and large AAAs with a diameter larger or equal to 50 mm (n = 20). Current groups were determined based on the recommended surveillance interval during outpatient follow-up. An example of the acquired US data for each group is shown in Figure 1, whereas demographic data are listed in Table 1.
Patient demographics for each of the five different groups
| Variables | Volunteers | Abdominal aortic aneurysm patients | |||
|---|---|---|---|---|---|
| Young | Age matched | Small | Moderate | Large | |
| Gender (M:F) | 4:6 | 11:9 | 24:1 | 19:1 | 18:2 |
| Age (years)a | 24 (21–28) | 58 (51–77) | 72 (62–84) | 76 (65–87) | 76 (59–90) |
| Diastolic blood pressure (mmHg)b | 69 (65–74) | 83 (80–89) | 87 (81–93) | 81 (74–88) | 83 (74 -91) |
| Systolic blood pressure (mmHg)b | 112 (107–133) | 138 (131–154) | 144 (135–163) | 146 (134–152) | 137 (123–148) |
| Maximum diameter (mm)b | 16 (14–19) | 21 (13–29) | 35 (31–39) | 45 (40–49) | 51 (50–63) |
| Growth (mm/year)b | NA | NA | 0 (0–1) | 3 (1–4) | 4 (3–6) |
NA, not applicable.
Values are reported as median and range.
Values are reported as median and interquartile range.
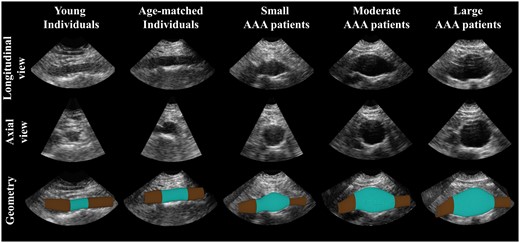
Examples of a longitudinal and cross-sectional view of the 3D ultrasound data for a young, and age-matched individual, and a small, moderate, and large AAA patient (from left to right). At the bottom row the segmented geometry is shown (blue) with the elongation needed for correct wall stress analysis (brown).
All time-resolved 3D US acquisitions were obtained using a Philips iU22 (n = 86) or Philips EPIQ 7 (n = 9) system with the same transducer, a Philips X6-1 matrix curved array probe (Philips Medical Systems, Bothell, WA, USA) with a centre frequency of 3.5 MHz. The US data were recorded in supine position during multiple heartbeats with an acquisition rate of 4–8 volumes per second, to ensure that the peak systole and end diastole was captured in the data. Brachial pressure was measured directly after the US acquisition using an automatic arm cuff.
The acquired US data were converted offline into a Cartesian co-ordinate system with a ranging field of view of (6–20) cm by (10–24) cm by (6–16) cm in width, length, and depth, respectively. The corresponding spatial resolution of the US data ranged between (0.5 to 1.3) mm × (0.4 to 1.3) mm × (0.3 to 0.7) mm.
Data processing and biomechanical analysis
All 95 volumes were segmented in the end-diastolic phase and the aortic geometry was regularized as previously was described by Kok et al.,12 and van Disseldorp et al.15 The aortic wall was tracked over the cardiac cycle using a 3D coarse to fine block matching algorithm which was adapted for 3D displacement estimation of Cartesian DICOM data.16 In the first step of the displacement algorithm, the global motion of the aorta was tracked using a kernel size of (4.5 × 4.5 × 2.3) mm3 and a search window of (14 × 14 × 12) mm3. Afterwards, the same kernel size was used to calculate the final displacements in a smaller updated search window of (10 × 10 × 7) mm3 with the previous estimate as input.
The diastolic aortic geometries were elongated and converted into a hexahedral mesh with a constant wall thickness of 2 mm.15 The geometries were together with the estimated 3D wall displacements and the measured brachial blood pressure input for an iterative finite element approach using Abaqus 6.14 (Dessault Systèmes, Paris, France). An initial value for the wall stiffness (shear modulus multiplied by the wall thickness) of 0.2 kPa⋅m for the healthy volunteers and 1.8 kPa⋅m for all AAA patients was applied.15,17 Optimization of the model was performed by changing the wall stiffness while comparing the displacements in the finite element model to the US displacements. A schematic overview of the proposed characterization method is shown for a healthy volunteer and an AAA patient in Figure 2.
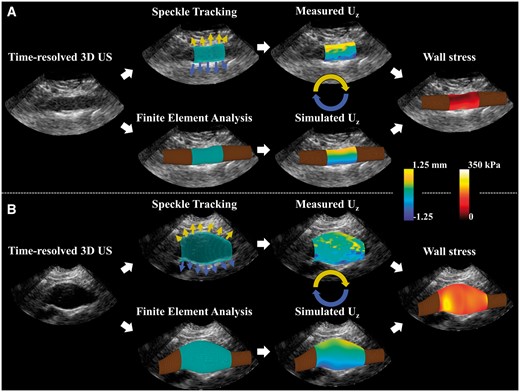
A schematic overview of the mechanical characterization with results for one volunteer (A) and one AAA patient (B). The segmented geometry was used to track the displacements using 3D speckle tracking and as input for a finite element model (please note that the displacement arrows are illustrative and not scaled). The measured axial displacements were fitted to the simulated displacements resulting in the subject specific aortic stiffness. Finally, the wall stress distribution at peak pressure is visualized for both cases.
Convergence was achieved when the estimated wall stiffness differed less than 1% with the previous estimate. Finally, in order to obtain the PWS at an equivalent pressure for each subject, the internal pressure in the aorta was increased to 140 mmHg and the peak stress distribution in the aortic wall was obtained. In this study, the 99th percentile wall stress was calculated and used as peak stress criteria for the aortic wall.17
Statistical analysis
Data analyses were performed using MATLAB R2017a (MathWorks Inc., Natick, MA, USA). In order to correct for the difference in arterial pressure between each individual, the aortic stiffness was linearly scaled to a mean arterial pressure (MAP) of 100 mmHg, and expressed as mean value with standard deviation (SD). Normality was tested by the one-sample Kolmogorov–Smirnov test. Regression analysis was performed to examine a possible dependency of aortic stiffness due to aging in the young and age-matched volunteer population. Differences between the three different groups and the volunteers were compared with the Wilcoxon rank sum test. The correlations between aortic stiffness, diameters, PWS, and age were evaluated using Spearman Rank correlation method. For all statistical tests, a P-value below 0.05 was considered to be significant.
Results
For each volunteer and AAA patient, the aortic stiffness and 99th percentile wall stress were calculated. For the examples shown in Figure 2, the wall displacements and stresses are visualized. Mechanical analysis resulted in a corresponding aortic stiffness of 181 ± 2 kPa⋅m for this specific volunteers and 840 ± 15 kPa⋅m for the AAA patient. A 99th percentile PWS of 168 kPa and 244 kPa, were observed, respectively.
In Figure 3, the aortic stiffness is visualized as function of age for all young and age-matched volunteers, and AAA patients. Stiffness measurements were significantly higher for the age-matched volunteers compared with the young volunteers (P < 0.001) and between the age-matched volunteers vs. AAA patients (P < 0.001). Correlation and regression analysis were performed to analyse the effect of arterial stiffening due to ageing. It showed a significant relation within the volunteer population ( = 0.33, P < 0.001), but within the AAA patients no correlation between age and stiffness was observed (P = 0.60).
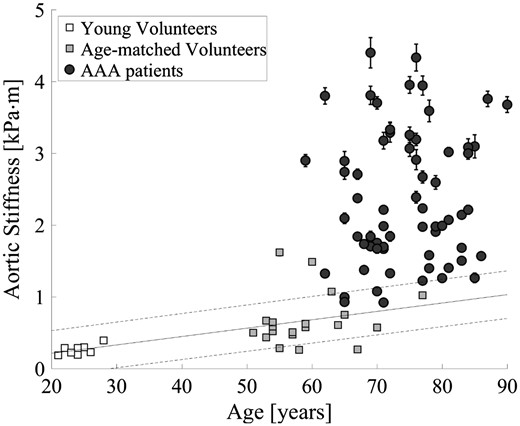
Measured aortic stiffness with estimated standard error to the mean as a function of age for young volunteers, age-matched volunteers, and AAA patients. The white and grey squares represent the young and age-matched volunteers, while the black circles show the AAA patients. The black line represents the regression line of the increase in aortic stiffness as function of age in healthy volunteers ( = 0.33, P < 0.001).
The aortic stiffness as function of the diameter is shown in a scatterplot in Figure 4A. A positive correlation between stiffness and diameter is observed in the volunteer population (ρ = 0.55, P = 0.002) and within the AAA patients (ρ = 0.33, P = 0.007). The median aortic stiffness with interquartile range is 0.23 (0.22–0.29) kPa⋅m for the young volunteers, 0.58 (0.48–0.71) kPa⋅m for the age-matched volunteers, 1.84 (1.38–2.46) kPa⋅m for the small AAAs (diameter 31–39 mm), 2.04 (1.73–3.65) kPa⋅m for the moderate AAAs (diameter 40–49 mm), and 2.72 (1.99–3.14) kPa⋅m for the large AAAs. The grouped aortic stiffness values are visualized in a box-and-whiskers plots in Figure 4B. A significant difference was observed between the age-matched volunteers and all AAAs (all P < 0.001), and between the small and large AAAs (P = 0.01).
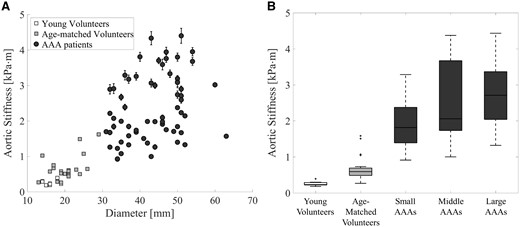
(A) Scatterplot of the aortic stiffness with standard deviation as function of the maximum aortic diameter for the volunteers (grey squares) and AAA patients (black circles). (B) Box-and-whiskers plots of aortic stiffness of the young volunteers, age-matched volunteers, and small, moderate, and large AAAs patients. A significant increase in stiffness is shown between the age-matched volunteers and small AAAs (P < 0.001), but also between the small and large AAAs (P = 0.01).
In Figure 5, the box-and-whiskers plots show the relative aortic stiffness for each of the five different groups when the arterial stiffness is corrected for the effect of ageing, i.e. the observed regression found in the volunteer group. This figure shows that the major increase in aortic stiffness between the volunteers and AAA patients is due to the aneurysm disease, and is not effected by a possible relation with age.
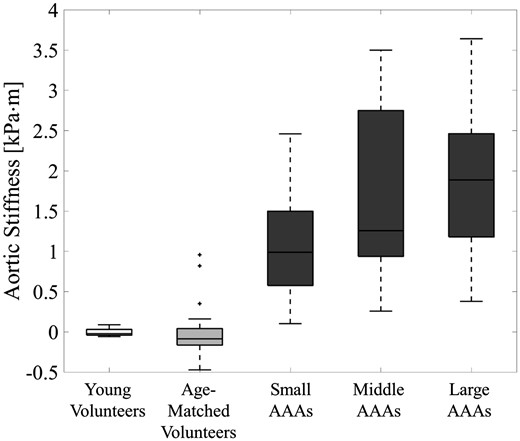
Box-and-whiskers plots of the aortic stiffness after the stiffness is corrected for the influence of ageing by subtracting the expected stiffness based on regression analysis. This relative aortic stiffness is shown for the young volunteers, age-matched volunteers, and the small, moderate, and large AAA patients.
Aortic stiffness was also correlated with AAA growth in the preceding year. Although, as expected, the maximum diameter correlated with preceding growth (ρ = 0.70, P < 0.001), no correlation was determined between aortic stiffness and growth (ρ = 0.10, P = 0.44) and between growth and 99th percentile wall stress (ρ = 0.13, P = 0.32).
Figure 6 shows the 99th percentile wall stress (with the 89.5th–99.5th range as a dispersion measure) as function of the aortic diameter for all participants. Although some spread in the data is observed, a positive correlation between diameter and 99th percentile wall stress is visible (ρ = 0.73, P < 0.001). The age-matched volunteers have a significant lower 99th percentile wall stress compared with the AAA patients (all P < 0.001), but no significant differences were observed when compared with the young volunteers (P = 0.22). More interesting, some patients with a relatively large aortic diameter (>5.0 cm) are observed with a 99th percentile wall stress similar to healthy volunteers, while other large AAAs with an equivalent diameter have an increased, almost twice as high, 99th percentile wall stress (≥ 400 kPa).
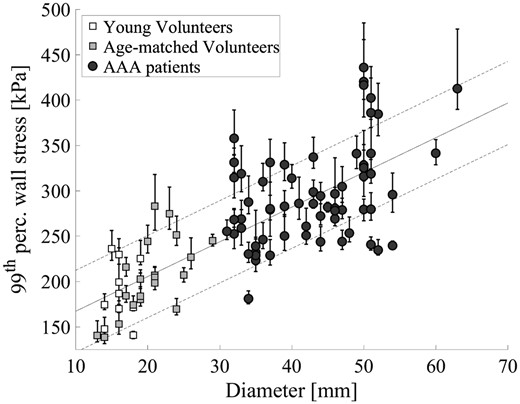
The 99th percentile peak wall stress as a function of the maximum aortic diameter for the volunteers (squares) and the abdominal aortic aneurysm patients (circles). Error bars represent the 89.5th–99.5th stress range for each individual. The black line is a regression line with its standard deviation ( = 0.57, P < 0.001).
Discussion
In this study, it has been demonstrated that time-resolved 3D US can be used to assess the aortic stiffness and PWS in vivo, which provides powerful opportunities in detecting and monitoring aneurysm disease in an early or even prior stage. The mechanical parameters were compared between young volunteers and age-matched healthy volunteers, and with AAA patients which cover the entire diameter range in follow-up. The two main findings of this study are:
The AAA pathology causes a significant increase in stiffness of the abdominal aorta in an early stage: local aortic stiffness was compared between healthy age-matched volunteers and AAA patients and showed significant differences, even after correcting for differences in MAP and the expected effect of ageing.
Peak wall stresses (PWSs) assessed for volunteers and AAA patients showed a significant correlation with diameter. Moreover, AAA patients with peak stresses similar to volunteers were observed while others patients with equivalent diameters may have an increased PWS, and potentially elevated rupture risk.
From a clinical perspective, it would be a great value to identify those AAAs who have a high possibility of growth. This additional information could be used to personalize the follow-up management and to identify patients at risk. In a study by Raaz et al.,18 the temporal relationship between arterial stiffening and AAA growth was assessed in a murine model. This study showed that arterial stiffening precedes by aneurysmal dilatation, suggesting that aortic dilatation is an active process. In this study, aortic stiffness was measured in a clinical setting during regular follow-up. It showed its feasibility and ability to detect differences in aortic stiffness between healthy volunteers and AAA patients, and within small and large AAAs. Interestingly, the aortic stiffness did not correlate with the AAA growth in the year prior to the stiffness measurements. A possible explanation is that AAA growth is the result of an increased aortic stiffness and not vice versa.18 To verify this hypothesis, a follow-up study could be employed using the current method to examine if this relationship is also found in AAA patients.
Few studies compared the local aortic stiffness between AAA patients and healthy volunteers, and to our knowledge this study is the first that compares both stiffness and 99th percentile PWSs between volunteers and AAA patients. Current results are in good agreement with the results obtained by Li et al.19 using pulse wave velocity imaging. In this study, the arterial wall motion due to the blood pressure pulse wave was used to assess the regional arterial stiffness. An average pulse wave velocity of 6.03 and 10.54 m/s was measured for normal and AAA subjects, which corresponds with an aortic stiffness of 0.26 and 1.57 kPa⋅m, respectively (vs. 0.23 and 1.98 kPa⋅m in this study). Derwich et al.20 characterized the aortic strain using 4D US between volunteers and AAA patients. Besides spatial heterogeneity in strain, also differences in mean circumferential strain were observed. These results correspond with current findings, assuming similar physiological blood pressures in both groups, an increased aortic stiffness in AAA patients will result in a decreased mean circumferential strain as suggested. However, strain was not part of the scope of this study. Thereby, measuring local aortic stiffness is not only limited to US imaging. Using external mechanical waves induced by a pneumatic driver magnetic resonance elastography (MRE) can be used to characterize various soft tissues. Recently, abdominal aortic MRE was performed on AAA patients and normal individuals,21 and showed similar relative differences as reported in this study.
Patients with high aortic stiffness showed a larger SD compared with the more compliant aortas. An explanation for this observation could be the use of DICOM data, which limits the precision of the displacement estimation. In relatively stiff AAAs, the aortic displacements are small which introduces a larger uncertainty in the model calibration. In the future, the availability and use of raw frequency US data will improve the displacements estimation and thus the expected error on the parameter estimates.
The use of US-based wall stress analysis has the advantage that it is not limited to only large AAAs, as is the case with CT, but also allows the analysis of the PWSs for healthy volunteers and small AAAs. Figure 6 showed overall higher 99th percentile wall stresses for AAA patients compared with the volunteers, and a significant correlation with diameter. However, an enlarged aortic diameter does not necessarily result in an increased PWS. These findings are in line with previous CT-based studies which showed that PWS can distinguish between stable and possibly threatening AAAs. Next step in current research is to follow these patients over time to examine whether the small AAAs with high PWS are more prone to accelerated growth and rupture compared with the low PWS patients with similar diameters, how PWS evolves over time, and when large changes in aortic stiffness occur. The use of 3D US enables these future follow-up studies, however, this was beyond the scope of this study.
One of the limitations in this study is the use of a constant wall thickness. Since wall thickness is directly related to aortic stiffness and local variations in wall thickness, it will influence the wall stress distribution and its absolute values. However, using current US techniques, it is not possible to extract the patient-specific and regional wall thickness at the specific depth of 8–10 cm where the majority of the aneurysm are located. Intra-vascular US could solve this issue, although it would make this technique more invasive.
In addition, good image quality is essential to obtain reliable measures for the aortic wall stiffness and PWS. For some patients with a limited echogenicity, 3D US imaging will still be challenging due to the depth of the AAA, the presence of bowel gas, or calcifications in the aortic wall leading to acoustic shadowing. Image quality might be improved using novel compounding techniques, i.e. the use of multiple US acquisitions from different angles and positions.
Ultimately, a regional stiffness map of the AAA would improve the understanding of mechanical alterations due to the AAA pathology. Calcified and more compliant regions could be detected, which subsequently also will improve the calibration of the finite element model to predict wall stresses more accurately. However, this was beyond the scope of this study. Finally, verification of the aortic stiffness would strengthen current findings. In vitro bi-axial tensile testing of corresponding AAA tissue would be an appropriate method to characterize the stiffness ex vivo. However, tissue samples are not available in volunteers and are limited available in patients. The majority of the AAA patients are currently treated using endovascular aortic repair, therefore, only patients undergoing open surgery would yield samples for ex vivo validation.
Conclusion
Using an easy applicable and non-invasive 3D US method, aortic stiffness and PWSs were calculated in healthy and aneurysmal aortas for a large range of age and AAA diameters. Results showed an early and significant increase in stiffness as a result of the AAA pathophysiology, and cases with relatively high PWS despite a maximum diameter below the current threshold. These measures can provide additional criteria in AAA risk assessment in the future, especially since it is now available during follow-up using an economical and harmless imaging modality, and reference values can be established.
Funding
This work was supported with an unrestricted educational grant from the Dutch “Lijf and Leven” Foundation.
Conflict of interest: none declared.
