Article

Monitoring of Chlorophylls during the Maturation Stage of Plums by Multivariate Calibration of RGB Data from Digital Images

by
Jaime Domínguez-Manzano
1,
Olga Monago-Maraña
2,*,
Arsenio Muñoz de la Peña
1,3 and
Isabel Durán-Merás
1,3
1
Departamento de Química Analítica, Universidad de Extremadura, 06006 Badajoz, Spain
2
Department of Analytical Sciences, Faculty of Sciences, National Distance Education University (UNED), Avda. Esparta s/n, Crta. de Las Rozas-Madrid, 28232 Las Rozas, Spain
3
Instituto Universitario de Investigación del Agua, Cambio Climático y Sostenibilidad (IACYS), Universidad de Extremadura, 06006 Badajoz, Spain
*
Author to whom correspondence should be addressed.
Chemosensors 2023, 11(1), 9; https://doi.org/10.3390/chemosensors11010009
Submission received: 22 November 2022 / Revised: 14 December 2022 / Accepted: 16 December 2022 / Published: 22 December 2022
(This article belongs to the Section Analytical Methods, Instrumentation and Miniaturization)

Abstract

:
The methodology developed in this study was based on digital imaging processing of plums harvested in eight different weeks during their ripening process. Mean RGB data, histograms, and matrices of RGB data were used to characterise the ripening stage of the plums, in both qualitative and quantitative approaches, by using classification and quantification chemometric methods. An exploratory analysis of data was performed using principal component analysis (PCA) and parallel factor analysis (PARAFAC) in RGB histograms and matrices data, respectively, showing differences in the colour features since the fourth week of harvesting. In the case of the quantitative approach, high correlation was achieved between the histogram data, using partial least squares (PLS), and total chlorophyll content. In addition, between three-way matrixes and total chlorophyll content, good correlations were obtained applying unfolded-PLS (U-PLS) and N-way-PLS (N-PLS). The most accurate results were obtained on the green channel. Analytical parameters obtained were good, with determination coefficients (R2) higher than 0.91 for all models in the first and second-order multivariate analysis. In addition, relative errors of prediction (REPs) were lower than 12% in all models for the green channel. Therefore, the proposed method was a satisfactory alternative to destructive physiological and biochemical methods in the determination of total chlorophylls in plum samples. In the routine analysis, first-order multivariate calibration with PLS analysis is a good option due to the simplicity of data processing.

Graphical Abstract

1. Introduction

Plums are one of the most well-known stone fruits, with Spain and Italy being the major European producers [1], especially of ‘Japanese plums’ belonging to the species Prunus Salicina Lindell, and ‘European plums’ belonging to the species Prunus domestica L. [2]. Both varieties are mainly consumed fresh and have remarkable commercial features, which depend on their pre-harvest and post-harvest conditions and treatments. Therefore, the development of different methods to assess the commercial quality properties of these fruits has a very important economic impact.
One of the most important quality features, which involves the commercial life of the product, is the ripening stage. These processes in plums have been widely studied in relation to the main phytochemicals of their skin. Total polyphenols and anthocyanins showed a relatively ascending trend during all the studied phases of the ripening process [3]. However, total chlorophyll content showed an intense increase during the fructification phase, followed by a continuous decrease until ripening in “Sanley”, “Vanat de Italia” and “Tuleu Gras” plum cultivars [3]. In addition, other researchers studied that the gradual decrease in chlorophylls and carotenoids, and the accumulation of anthocyanins, changed the colour of the fruit from green to deep purple colour in black plums cultivars Syzgium cumini [4]. Hence, chemical changes will be followed by changes in colour on the skin of the fruit, and these chemical changes, based on the principal phytochemicals present in the peel of the fruit, are demonstrated to be an excellent index to monitor the ripening stage of plums of different cultivars.
In order to analyse these phytochemicals in the skin of the fruits, several analytical methods based on spectrophotometry [5], and chromatography [6] have been proposed. However, these methods are time- and solvent-consuming, require sample destruction, sophisticated equipment and highly trained analysts. Nowadays, analytical methodologies are required to be more efficient, economic, and eco-friendly, thus new methodologies based on non-destructive procedures and inexpensive and accessible devices are being developed. In this context, chemometric methods, which are based on the mathematical treatment of multidimensional analytical information in untreated samples, are suitable to these features. For this reason, these methods have been widely used among different areas such as environment, food control or biotech processes, among others [7,8,9]. Hence, the use of autofluorescence data obtained from plums with a fiber optic were analyzed, applying different second-order chemometric methods for satisfactory quantification of chlorophylls in plums’ skin [10]. This method was reported as a reliable, non-destructive, short time response and minimal instrumentation required approach, to monitoring the ripening process of plums, achieving important qualitative and quantitative information about the evolution of chlorophylls.
On the other hand, the application of digital images data based on the different colour spaces coded into RGB, HSI, or greyscale, coupled with different chemometric methods, has gained great prominence due to its simplicity and the possibility to integrate data processing in common devices such as digital cameras and smartphones.
For this reason, several studies have been reported to demonstrate the relevance of these methods for the determination of quality parameters of interest, in different food matrices. For example, simple one-way data based on RGB features have been used with univariate linear regression for monitoring thermal stability of extra virgin olive oil [11] or for assessing chlorophyll and nitrogen status in plants [12]. On the other hand, two-way data based on the different colour features in different colour spaces, such as HSI, RGB, or L, a, b, organized in colour histograms, have been performed with successful results in different food matrices. In this way, several studies have been reported applying colour histograms in combination with classification and quantification chemometric methods, in order to estimate the adulteration in the fat content in chicken hamburgers [13], Sudan I dye in ketchup samples [14], young wines in aged wines [15] or food dyes in commercial products [16]. In addition, colour histograms have been used to quantify different compounds of interest or classify different quality degrees in several foods such as grape juice [17], mango fruits [18] or to determine nitrites in water [19], and the maturity stage of fruits such as bananas [20].
Until now, there were no studies of second-order data analysis applied on the whole digital images with their “pure” colour features provided for every pixel, where multivariate calibration is possible to be performed. However, it has been used in other fields, such as wood weathering [21], where PARAFAC was used with fused NIR, RGB, gloss and Cie-Lab data, in different weathering times, obtaining qualitative information of the evolution of the different factors related to surface properties of the wood. Moreover, it was used in the determination of nitrites in food samples, taking eight photographs with different F number in a paper-based sensor (PBS), for the determination of nitrites with the Griess reagent, arranging three-way arrays using the number of samples, the intensity of the red pixels and the F number, to obtain U-PLS and N-PLS models [22].
The objective of this work is to show the potential of digital imaging processing, coupled with different chemometric tools, to evaluate the chlorophyll content of plums without treatment of the sample or sophisticated data analysis equipment. For that, analytical information based on RGB colour space has been explored in different data levels: mean values of RGB for each pixel (one-way), histograms (two-way), and whole matrix of RGB data (three-way). In addition, after an exploratory analysis of data, models for total chlorophylls quantification was obtained using different chemometric tools.

2. Material and Methods

2.1. Reagents and Solvent Standards

Standard solutions were prepared by dissolving the contents of ampules containing 1 mg of chlorophyll a or chlorophyll b (chl a and chl b), obtained from Sigma-Aldrich Chemical Co (Barcelona, Spain), in 25.00 mL of acetone and stored at −4 °C in darkness. Acetone (Merck, Darmstadt, Germany) was used to prepare diluted solutions.

2.2. Sampling

The maturity process of plums was analysed in the Friar plums variety, harvested from a cultivar located in Badajoz, Extremadura, Southwest of Spain. Samples of fruits were harvested from the last week of May to August 2018, and then randomly collected for each week along the maturation process. In three samples from each week, three photographs were taken from every side of the plum (peduncle side was avoided). Afterward, an HPLC analysis of the chlorophylls in the skin was carried out.

2.3. Reference Analysis

Reference analysis was performed by the chromatographic method proposed by Hart and Scott [23] and adapted to this study. Details for extraction procedure of chlorophylls are described in a previous work [10]. HPLC analysis was carried out on a UFLC Shimadzu Prominence LC-AD equipped with a degasser, a quaternary pump, a column oven, an automatic autosampler (SIL-20A/20AC), a photodiode detector (SPD-M20A) and a spectrofluorimetric detector (U RF-20A/20Axs). A Shimadzu LC Solutions software package was used to control the instrument and data acquisition. The analytical column used was a Kinetex C18 (150 × 4.6 mm 5 μm) (Phenomenex Inc., Torrance, CA, USA).

2.4. Digital Images Acquisition

To obtain digital images from plums, a BQ smartphone (Aquarius M5 model) was employed, using Android operating system version 5.0 and equipped with a 13 megapixels-resolution and 2.0 focus-ratio camera. The smartphone was incorporated in a home-made box with 25 cm × 25 cm × 25 cm dimensions surrounded in its top by a strip of fourteen bright LEDs (D65 illuminant and 6500 K colour temperature), where the customized aperture to put the smartphone was made in front of the sample holder. This device was demonstrated to be useful to obtain reproducible measurements by isolation from ambient light and internal luminosity control by the strip of LEDs [23].

2.5. Data Processing

For data processing, different strategies were assayed and compared. In Figure 1, a scheme of the process is shown, and different steps will be detailed in the further sections. Images were taken from three faces of plums, avoiding the peduncle face due to the lack of relevant information. From each face, a region of interest (ROI) of 400 × 400 pixels was selected, generating three ROIs for each plum, and removing areas not relevant in the images, such as the white background that can be observed in the pictures of Figure 1. Then, mean data for the different faces of plums were considered for data analysis.

2.5.1. Univariate Analysis

After images acquisition, they were transferred to Matlab environment for reading by “imread” command (Matlab R2018a, version 7.5.0.342, Natick, MA, USA). Red (R), green (G) and blue (B) matrices were constructed by their 8 bytes digital codes. The mean for each channel were used for calculations.
To perform univariate calibration, different ratios for R, G, and B channels were calculated for each plum as follows:
Ratio   R = R R + G + B
Ratio   G = G R + G + B
Ratio   B = B R + G + B
Each ratio was correlated with the total chlorophylls in the skin, analysed by HPLC, and their evolution over time was evaluated. A scheme of this experimental procedure can be observed in the top of Figure 1.

2.5.2. First-Order Multivariate Analysis

In the case of first-order analysis, colour histograms for each channel and image were obtained using the software ImageJ (version 1.53K, Wayne Rasband and contributors, National Institutes of Health, USA, public domain) (accessed on 15 January 2022) (https://imagej.nih.gov/ij/). Then, the mean histograms of the three faces of every replicate of the 24 samples were used for data analysis. As observed in the center of the scheme of Figure 1, using histograms, an exploratory analysis of data was performed by principal component analysis (PCA) to explore the variability of data. In addition, calibration models for total chlorophyll content in the skin of the plums were built using partial least-squares (PLS) [24,25]. The X matrix was a 24 × 256 matrix, where rows represent the number of samples and columns represent the frequency of each colour value in each channel under study. Full-cross validation was used, and different parameters were obtained to evaluate the performance of the model: coefficient of determination (R2), root mean square error (RMSE) and relative error of prediction (REP). All calculations were performed using The Unscrambler version 6.11 (CAMO Software AS, Oslo, Norway).

2.5.3. Second-Order Analysis

For second-order analysis, the whole matrix of 400 × 400 pixels of the ROI of the photographs were obtained for each channel and for the three faces of each replicated of the 24 assayed samples. Then, the mean matrix of the three faces was used for data analysis. The dimension of the whole matrix of data was a 24 × 400 × 400 array, corresponding to the number of samples, and the mean pixels of the horizontal and vertical position of each pixel. As in the case of first-order data, an exploratory analysis was performed by PARAFAC. Calibration models were obtained with unfolded-partial least-squares (U-PLS) and N-way partial least-squares (N-PLS). Second-order analysis was carried out in Matlab (Matlab R2018a, version 7.5.0.342, Natick, MA, USA) and using MVC2, a useful Matlab graphic interface developed by A.C. Olivieri et al. [26]. In this case, full-cross validation was also used to validate the models and the same analytical parameters used in the first-order analysis were calculated to evaluate the performance of the model. The scheme for this procedure is presented in the bottom part of Figure 1.

3. Results and Discussion

3.1. Univariate Analysis

To evaluate the maturity stage of plums along the different weeks by univariate analysis, mean values of different channels R, G and B were obtained for each week, considering three replicates of samples (and three images per sample). Hence, the ratio values were calculated for each channel. The evolution of R, G, and B ratios along the maturation stage is shown in Figure 2A, Figure 2B and Figure 2C, respectively. In this first approach, it is worth highlighting that in the fourth week the ratio of the green channel (Figure 2B) reaches a maximum, while the blue channel ratio (Figure 2C) reaches a minimum, even when this change is not appreciable to the naked eye. These results might be due to a change in the maturity stage, where the main phytochemicals, as chlorophylls, have an important decrease, and anthocyanins present an increase [3,4]. In addition, it can be observed that variability among the same week increases from the fourth week, as shown by the error bars in Figure 2A–C. Otherwise, red channel (Figure 2A) shows a slight increase in the time. This trend might be explained as a decrease of chlorophyll content since, as mentioned in other studies, red is the complementary of the green wavelength of the chlorophyll [14].
After a qualitative exploration of data, a quantitative approach was performed with the same data. Figure 2D–F and Table 1 show the results obtained for the regression curve of each channel. As observed, G and B channels (Figure 2E,F) were not suitable for the quantification of total chlorophylls. However, the R channel (Figure 2D) offered good results with R2 = 0.89, RMSEP = 9.42 μg/mL and REP = 13%.
These results agree with other studies performed to estimate total chlorophylls in potato plants [27], sugar beet leaves [28] and betel vine [29] using R, G, and B brightness ratio. Furthermore, fluorescence studies with an optic fiber previously done and reported in the same samples [10] showed that factors obtained from PARAFAC, and associated with chlorophyll a and chlorophyll b, showed a similar trend during the maturation process, which suggest that the increase in the red value is related with the decreasing in chlorophyll concentration. This methodology can be considered simple and reliable for this purpose.

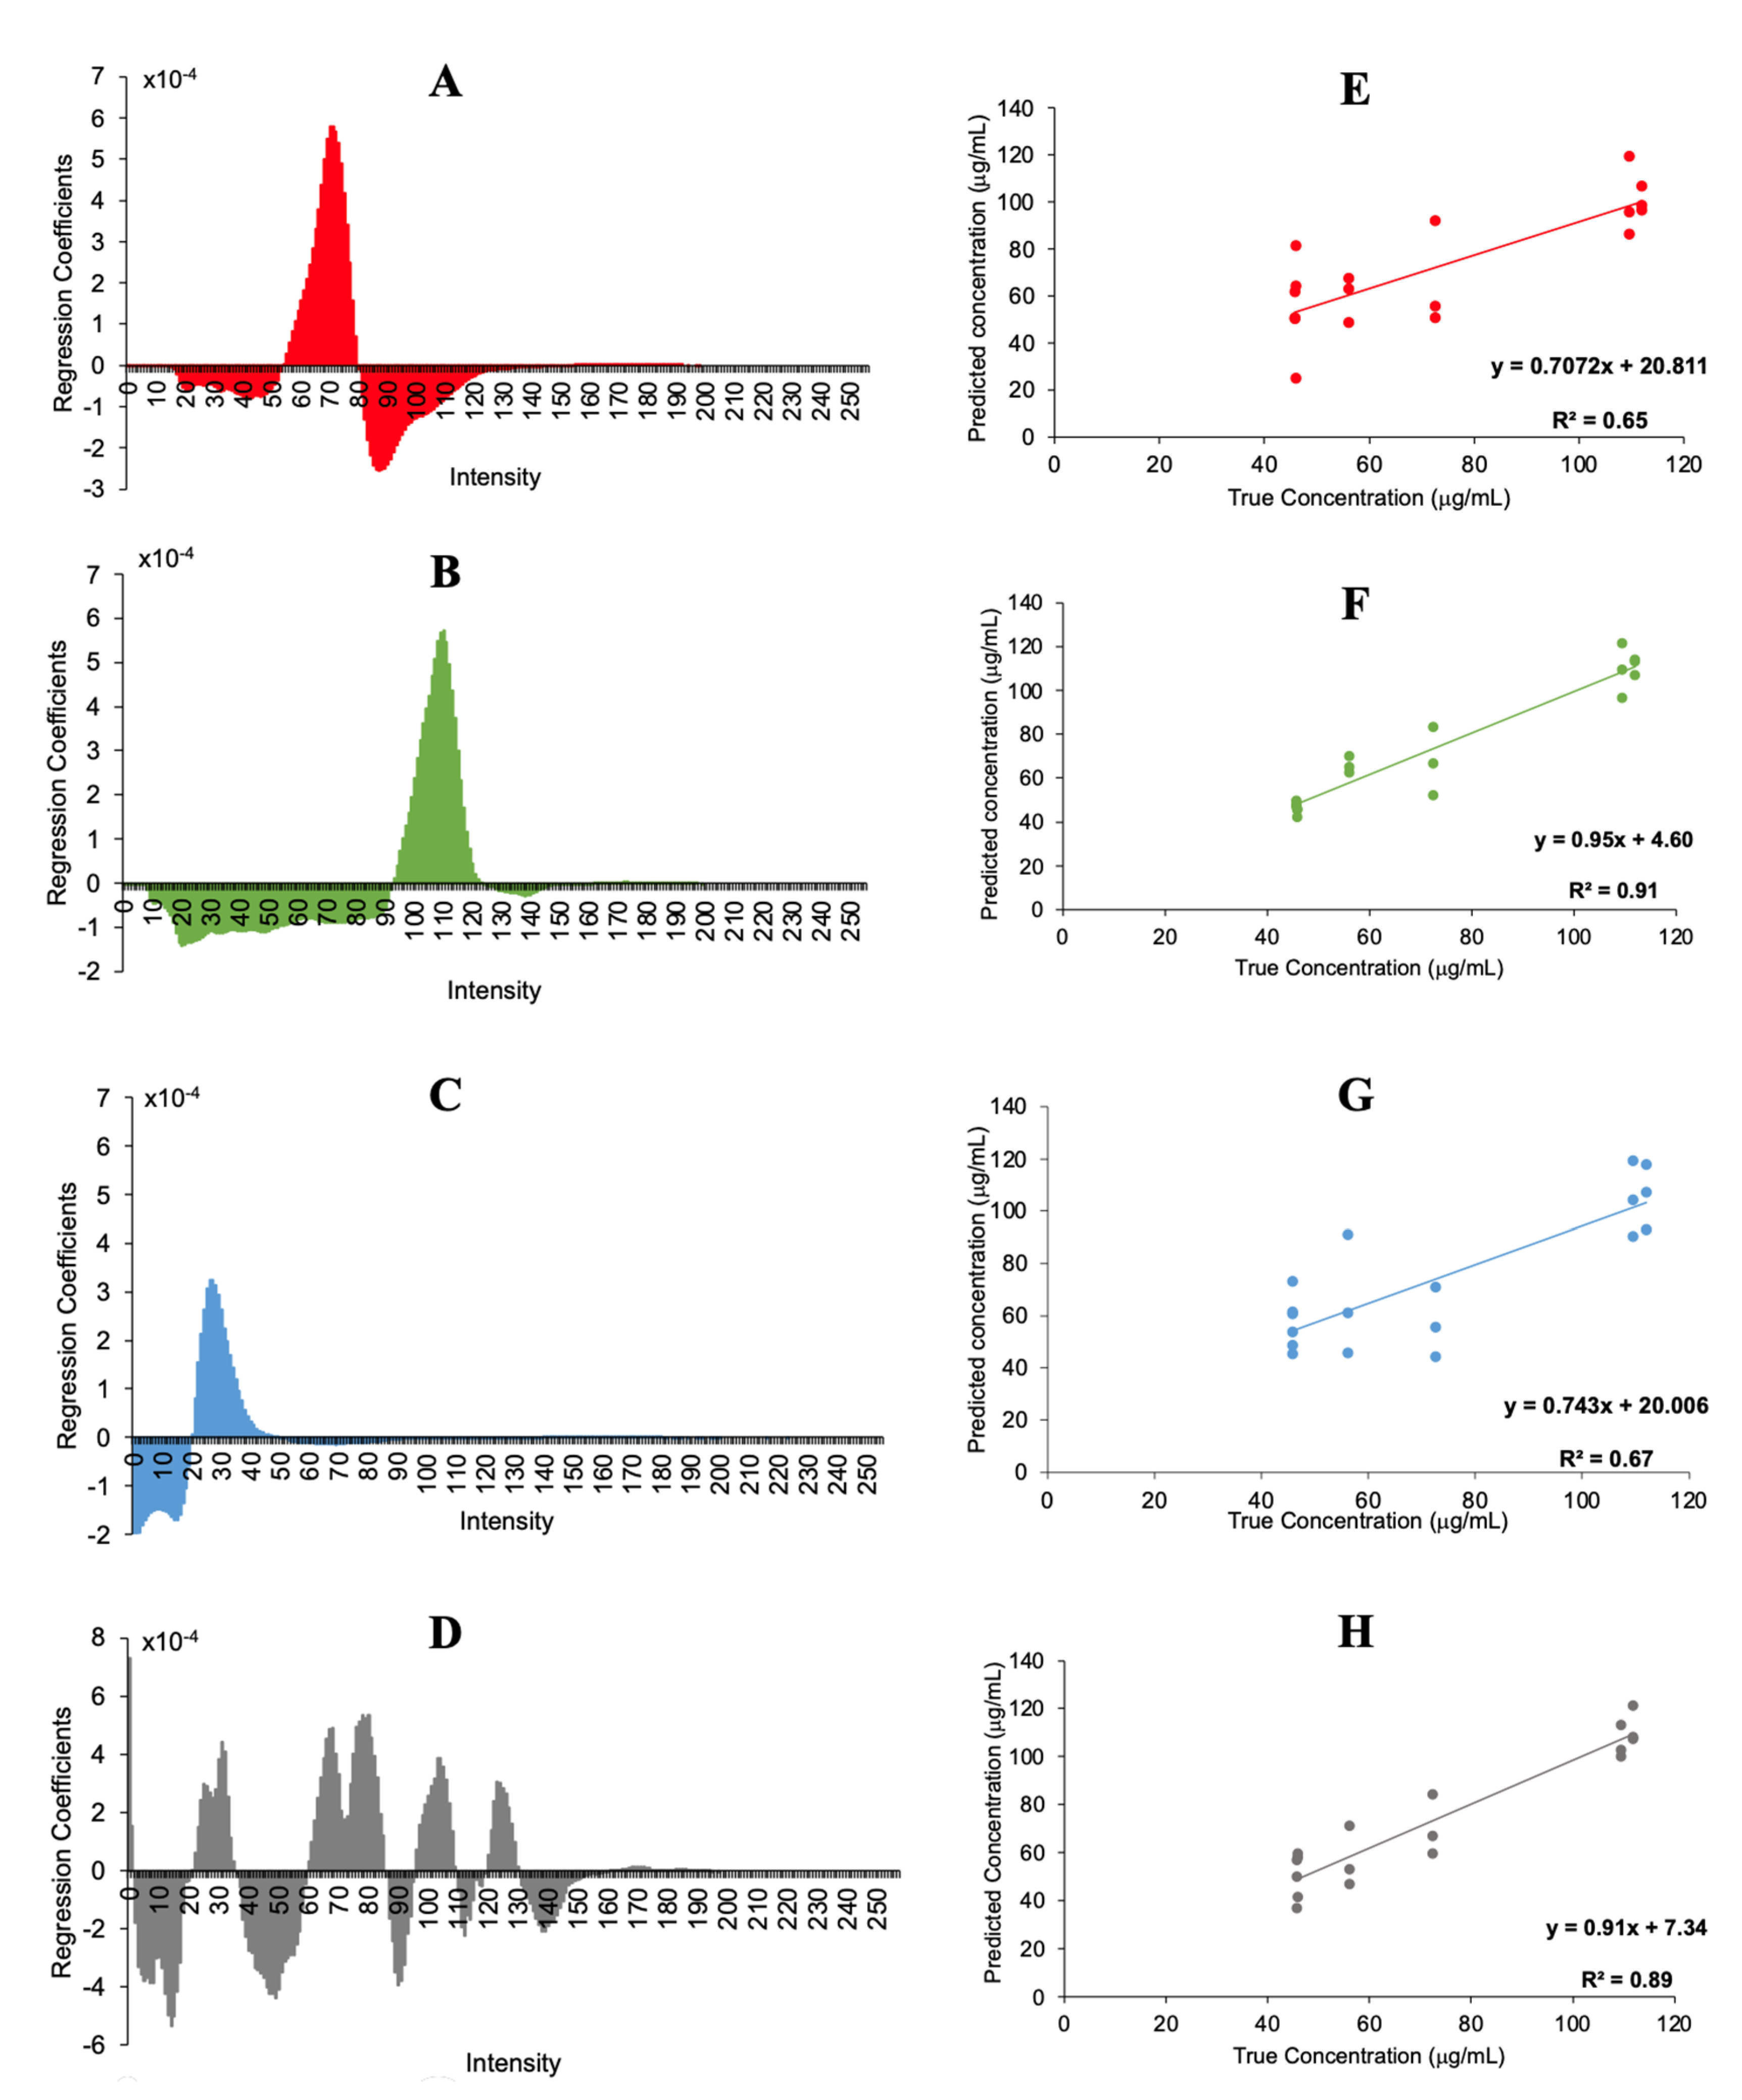
3.2. First-Order Multivariate Analysis

To perform multivariate analysis, mean histograms (plums harvested same week) of each channel (R, G and B), and three channels together (RGB histograms) were considered. As mentioned before, the matrix was a 24 × 256 data matrix, where 24 was the number of samples and 256 the frequency of each of the 256 possible intensity values of R, G, B and RGB channels. Firstly, a visual exploration of data was performed, as can be seen in Figure 3A–D. During the time, the G channel (Figure 3B) presents higher frequencies in the lower intensity of the channel, from the first week, with the highest frequency around 112, to the seventh week, with higher frequencies between 10 to 30. This change might be because the green colour changes to dark green with time. Then, the red/purple colour appears when chlorophylls decrease and anthocyanins increase, which increases the absorption of green wavelengths and the reflexion of red wavelengths. On the other hand, the R channel (Figure 3A) presents a different change. It presents higher frequencies in the lower intensities (around 64), for the first week, and higher frequencies in the higher intensities (around 80) for the seventh week. In the case of B channel, this change is not observed so clearly.
With this, PCA was performed, and samples were coloured according to date of harvesting, before (red colour) or after (blue colour) the fourth week. The obtained scores for the two first components are represented in Figure 3E–H for each channel (R, G, B and RGB). As observed in Figure 3F, a trend in the distribution was observed, mainly in the G channel, when scores for the two first components were plotted. In this case, the two first components explained the 76% of the total variance, being the PC1 which explained the clustering of samples. This trend is more marked in the case of RGB considered together (Figure 3H), being the clustering due to the second component, which explained only 15% of the variance. Loadings for the first or second component are shown in Figure 3I–L. It can be observed that the most variables influencing the separation of samples are those corresponding with the RGB channel (Figure 3H) and with intensities around 66–68 and 110–112. This result was expected, presenting samples in the first four weeks with higher frequencies around these intensities for the red and green channel.
Finally, histograms were used for a quantitative analysis in order to quantify the total chlorophyll content in plums. For that, calibration models were performed with PLS for the different channels, respectively. Full-cross validation was employed, and the number of components were selected according to the explained variance. Figure 4A–D illustrate the PLS regression coefficients for each channel, and Figure 4E–H the predicted chlorophyll concentrations when PLS was applied versus the HPLC concentrations. Good accordance was obtained between the predicted values and the reference results obtained in HPLC, with the best determination coefficient (0.92) for the green channel. The figures of merit of each channel are summarized in Table 2.

3.3. Second-Order Multivariate Analysis

After first-order analysis, second-order data was used to obtain the corresponding models. Each matrix for each plum presented a dimension of a 24 × 400 × 400, where 400 was the number of pixels for each image, and 24 the number of samples. The mean matrix was obtained for three faces of the plum. Firstly, an exploratory analysis was performed applying PARAFAC to obtain the corresponding scores after the determination of the optimum number of components. This process was based on the “core consistency diagnostic” (CORCONDIA) [30] criterion, where the value of this parameter has an important decreasing when the optimum number of components is overcome. When the scores for the two first components were plotted, any trend was observed (data not shown) and results were not as good as in the first-order analysis.
On the other hand, the quantitative approach of total chlorophyll content was performed by U-PLS and N-PLS, and the predicted versus the measured by HPLC concentrations are plotted in Figure 5. While the results obtained for both R and G channels are in good agreement with the HPLC values, the results for B channel are poor. In Table 2, the statistical parameters are summarized. The best results were obtained for the G channel with both algorithms, achieving R2 of 0.96 and 0.95; RMSECV of 7.50 and 9.64 μg/mL, and REP of 10 and 12%, respectively, for both algorithms.
This methodology applies the chemometric algorithms to a higher volume of data, because instead of selecting the main features of the image, this methodology selects every single pixel, which takes into account more information.

4. Conclusions

RGB data imaging processing in combination with univariate, first- and second-order multivariate methods have demonstrated to be simple, reliable, and accurate methodologies for monitoring the maturity stage of plums during the harvesting period, with potential benefits in their commercial features. Using univariate analysis, bests results were obtained for the R channel, the complementary colour to the observed one. These results were in accordance with other studies. PCA presented an important success for the exploration of data according to maturity stage in the histograms of the RGB data, where changes in the intensity of the three principal additive colours are important and visible in this kind of data. With this data, PLS has demonstrated to be useful for the total chlorophylls determination, obtaining the best results for the green channel. On the other hand, employing the whole digital image (information for each pixel), good results of quantification were obtained using U-PLS and N-PLS algorithms. With all these results, this study shows good methodologies, with advantages to follow the maturation stage of plums and quantify their total chlorophylls content. In further studies, it would be interesting to include more samples and give more robustness to the methodology used in the practice.

Author Contributions

Conceptualization, O.M.-M., A.M.d.l.P. and I.D.-M.; Methodology, J.D.-M.; Validation, J.D.-M.; Formal analysis, J.D.-M. and O.M.-M.; Resources, I.D.-M.; Writing – original draft, J.D.-M. and O.M.-M.; Writing–review & editing, O.M.-M., A.M.d.l.P. and I.D.-M.; Supervision, O.M.-M., A.M.d.l.P. and I.D.-M.; Funding acquisition, A.M.d.l.P. and I.D.-M. All authors have read and agreed to the published version of the manuscript.

Funding

This research was funding by the Ministerio de Ciencia e Innovación de España (Project PID2020-112996GB-I00 funded by MCIN/AEI/10.13039/501100011033) and Junta de Extremadura (Ayuda a Grupos GR21048 and Project IB20016) co-financed by European Funds for Regional Development.

Conflicts of Interest

The authors declare no conflict of interest.

References

  1. Ministerio de Industria Comercio y Turismo Estadísticas de Comercio Exterior de Bienes de España y La UE, Spain. 2022. Available online: https://datacomex.comercio.es/Data (accessed on 10 September 2022).
  2. Manganaris, G.A.; Vicente, A.R.; Crisosto, C.H. Effect of Pre-Harvest and Post-Harvest Conditions and Treatments on Plum Fruit Quality. CAB Rev. Perspect. Agric. Vet. Sci. Nutr. Nat. Resour. 2008, 3, 1–9. [Google Scholar] [CrossRef] [Green Version]
  3. Vlaic, R.; Muresan, V.; Andruta, M.; Crina, M.; Adriana, P.; Viorel, M.; Maria Simona, C.; Muste, S. The Changes of Polyphenols, Flavonoids, Anthocyanins and Chlorophyll Content in Plum Peels during Growth Phases: From Fructification to Ripening. Not. Bot. Horti. Agrobot. Cluj. Napoca 2017, 46, 148. [Google Scholar] [CrossRef] [Green Version]
  4. Patel, P.R.; Rao, T.V.R. Growth and Ripening in Black Plum [Syzygium cumini (L.) Skeels]. Int. J. Fruit Sci. 2014, 14, 147–156. [Google Scholar] [CrossRef]
  5. Lancaster, J.E.; Grant, J.E.; Lister, C.E.; Taylor, M.C. Skin Color in Apples-Influence of Copigmentation and Plastid Pigments on Shade and Darkness of Red Color in Five Genotypes. J. Am. Soc. Hortic. Sci. 1994, 119, 63–69. [Google Scholar] [CrossRef]
  6. Patel, P.R.; Rao, T.V.R. Physiological Changes in Relation to Growth and Ripening of Khirni [Manilkara hexandra (Roxb.) Dubard] Fruit. Fruits 2009, 64, 139–146. [Google Scholar] [CrossRef] [Green Version]
  7. Senger, R.S.; Scherr, D. Resolving Complex Phenotypes with Raman Spectroscopy and Chemometrics. Curr. Opin. Biotechnol. 2020, 66, 277–282. [Google Scholar] [CrossRef]
  8. Zhang, X.; Yang, J.; Lin, T.; Ying, Y. Food and Agro-Product Quality Evaluation Based on Spectroscopy and Deep Learning: A Review. Trends Food Sci. Technol. 2021, 112, 431–441. [Google Scholar] [CrossRef]
  9. Mas, S.; de Juan, A.; Tauler, R.; Olivieri, A.C.; Escandar, G.M. Application of Chemometric Methods to Environmental Analysis of Organic Pollutants: A Review. Talanta 2010, 80, 1052–1067. [Google Scholar] [CrossRef]
  10. Monago-Maraña, O.; Domínguez-Manzano, J.; Muñoz-de la Peña, A.; Durán-Merás, I. Second-Order Calibration in Combination with Fluorescence Fibre-Optic Data Modelling as a Novel Approach for Monitoring the Maturation Stage of Plums. Chemom. Intell. Lab. Syst. 2020, 199, 103980. [Google Scholar] [CrossRef]
  11. Rotich, V.; al Riza, D.F.; Giametta, F.; Suzuki, T.; Ogawa, Y.; Kondo, N. Thermal Oxidation Assessment of Italian Extra Virgin Olive Oil Using an UltraViolet (UV) Induced Fluorescence Imaging System. Spectrochim. Acta A Mol. Biomol. Spectrosc. 2020, 237, 118373. [Google Scholar] [CrossRef]
  12. Ali, M.M.; Al-Ani, A.; Eamus, D.; Tan, D.K. An Algorithm Based on the RGB Colour Model to Estimate Plant Chlorophyll and Nitrogen Contents. In Proceedings of the International Conference on Sustainable Environment and Agriculture, Venice, Italy, 17–18 November 2013; International Association of Computer Science & Information Technology: Singapore, 2013. [Google Scholar]
  13. de Sousa Fernandes, D.D.; Romeo, F.; Krepper, G.; di Nezio, M.S.; Pistonesi, M.F.; Centurión, M.E.; de Araújo, M.C.U.; Diniz, P.H.G.D. Quantification and Identification of Adulteration in the Fat Content of Chicken Hamburgers Using Digital Images and Chemometric Tools. LWT 2019, 100, 20–27. [Google Scholar] [CrossRef]
  14. Reile, C.G.; Rodríguez, M.S.; de Sousa Fernandes, D.D.; de Araujo Gomes, A.; Diniz, P.H.G.D.; di Anibal, C.V. Qualitative and Quantitative Analysis Based on Digital Images to Determine the Adulteration of Ketchup Samples with Sudan I Dye. Food Chem. 2020, 328, 127101. [Google Scholar] [CrossRef]
  15. Herrero-Latorre, C.; Barciela-García, J.; García-Martín, S.; Peña-Crecente, R.M. Detection and Quantification of Adulterations in Aged Wine Using RGB Digital Images Combined with Multivariate Chemometric Techniques. Food Chem. X 2019, 3. [Google Scholar] [CrossRef] [PubMed]
  16. Sorouraddin, M.H.; Saadati, M.; Mirabi, F. Simultaneous Determination of Some Common Food Dyes in Commercial Products by Digital Image Analysis. J. Food Drug Anal. 2015, 23, 447–452. [Google Scholar] [CrossRef] [Green Version]
  17. Beltrame, K.K.; Gonçalves, T.R.; Gomes, S.T.M.; Matsushita, M.; Rutledge, D.N.; Março, P.H.; Valderrama, P. Digital Images and Independent Components Analysis in the Determination of Bioactive Compounds from Grape Juice. LWT 2021, 152, 112308. [Google Scholar] [CrossRef]
  18. Elsayed, S.; Galal, H.; Allam, A.; Schmidhalter, U. Passive Reflectance Sensing and Digital Image Analysis for Assessing Quality Parameters of Mango Fruits. Sci. Hortic. 2016, 212, 136–147. [Google Scholar] [CrossRef]
  19. Shariati-Rad, M.; Irandoust, M.; Mohammadi, S. Multivariate Analysis of Digital Images of a Paper Sensor by Partial Least Squares for Determination of Nitrite. Chemom. Intell. Lab. Syst. 2016, 158, 48–53. [Google Scholar] [CrossRef]
  20. Zhuang, J.; Hou, C.; Tang, Y.; He, Y.; Guo, Q.; Miao, A.; Zhong, Z.; Luo, S. Assessment of External Properties for Identifying Banana Fruit Maturity Stages Using Optical Imaging Techniques. Sensors 2019, 19, 2910. [Google Scholar] [CrossRef] [Green Version]
  21. Sandak, J.; Sandak, A.; Cocchi, M. Multi-Sensor Data Fusion and Parallel Factor Analysis Reveals Kinetics of Wood Weathering. Talanta 2021, 225, 122024. [Google Scholar] [CrossRef]
  22. Olivieri, A.; Escandar, G.M. Practical Three-Way Calibration; Elsevier: Amsterdam, The Netherlands, 2014; ISBN 0124104541. [Google Scholar]
  23. Cerrato-Alvarez, M.; Frutos-Puerto, S.; Miró-Rodríguez, C.; Pinilla-Gil, E. Measurement of Tropospheric Ozone by Digital Image Analysis of Indigotrisulfonate-Impregnated Passive Sampling Pads Using a Smartphone Camera. Microchem. J. 2020, 154, 104535. [Google Scholar] [CrossRef]
  24. Martens, H.; Naes, T. Multivariate Calibration; John Wiley & Sons: Hoboken, NJ, USA, 1992; ISBN 0471930474. [Google Scholar]
  25. Indahl, U.G. The Geometry of PLS1 Explained Properly: 10 Key Notes on Mathematical Properties of and Some Alternative Algorithmic Approaches to PLS1 Modelling. J. Chemom. 2014, 28, 168–180. [Google Scholar] [CrossRef]
  26. Olivieri, A.C.; Wu, H.L.; Yu, R.Q. MVC2: A MATLAB Graphical Interface Toolbox for Second-Order Multivariate Calibration. Chemom. Intell. Lab. Syst. 2009, 96, 246–251. [Google Scholar] [CrossRef]
  27. Yadav, S.P.; Ibaraki, Y.; Gupta, S.D. Estimation of the Chlorophyll Content of Micropropagated Potato Plants Using RGB Based Image Analysis. Plant Cell Tissue Organ. Cult. 2010, 100, 183–188. [Google Scholar] [CrossRef]
  28. Sánchez-Sastre, L.F.; Alte da Veiga, N.M.S.; Ruiz-Potosme, N.M.; Carrión-Prieto, P.; Marcos-Robles, J.L.; Navas-Gracia, L.M.; Martín-Ramos, P. Assessment of RGB Vegetation Indices to Estimate Chlorophyll Content in Sugar Beet Leaves in the Final Cultivation Stage. AgriEngineering 2020, 2, 9. [Google Scholar] [CrossRef] [Green Version]
  29. Dey, A.K.; Sharma, M.; Meshram, M.R. An Analysis of Leaf Chlorophyll Measurement Method Using Chlorophyll Meter and Image Processing Technique. Procedia Comput. Sci. 2016, 85, 286–292. [Google Scholar] [CrossRef] [Green Version]
  30. Bro, R.; Kiers, H.A.L. A New Efficient Method for Determining the Number of Components in PARAFAC Models. J. Chemom. J. Chemom. Soc. 2003, 17, 274–286. [Google Scholar] [CrossRef]
Figure 1. Scheme of the images acquisition and data processing.
Chemosensors 11 00009 g001
Figure 2. Evolution of the R, G and B ratios along the maturation stage (AC) (mean ratio was obtained considering three replicates of samples (and three images per sample); and linear regression curves for R, G and B ratios and total chlorophyll concentration (DF) (mean values were obtained considering three images per samples, and samples per week individually).
Chemosensors 11 00009 g002
Figure 3. Histograms (AD), scores values of the two first PCA components (EH) and loading profiles of the first PCA component (IL) for the R, G, B and RGB channels along the maturation process.
Chemosensors 11 00009 g003
Figure 4. PLS regression coefficients plots (AD) and predicted versus actual concentration (EH) of the R, G, B and RGB histogram channels.
Chemosensors 11 00009 g004
Figure 5. U-PLS (A) and N-PLS (B) regression line for the regression models obtained in the R, G, and B channels.
Chemosensors 11 00009 g005
Table 1. Figures of merit for the univariate regression obtained in the different channels.
ChannelSlopeInterceptR2RMSEP (μg/mL)REP (%)
R0.980.570.899.413
G0.24101.40.3953.873
B−4.98635.70.01304.9414
R: red; G: green; B: blue; R2: determination coefficient; RMSEP: root mean square error of prediction; REP: relative error of prediction.
Table 2. Figures of merit for the different regression models obtained for first- and second-order multivariate analysis in the different channels.
First-Order
AlgorithmChannelComponentsSlopeInterceptR2RMSEP (μg/mL)REP (%)
PLSRed30.7020.80.6816.623
Green50.974.600.928.411
B30.7420.00.7016.021
RGB70.717.340.899.112
Second-Order
AlgorithmChannelComponentsSlopeInterceptR2RMSEP (μg/mL)REP (%)
U-PLSRed30.935.060.959.112
Green30.953.520.967.510
Blue30.906.440.9512.217
N-PLSRed40.936.350.9210.915
Green30.934.670.959.6412
Blue20.7714.70.7818.925
R: red; G: green; B: blue; RGB: red, green, and blue; R2: determination coefficient; RMSEP: root mean square error of prediction; REP: relative error of prediction; PLS: partial least-squares; U-PLS: unfolded-PLS; N-PLS: multi-way-PLS.
Disclaimer/Publisher’s Note: The statements, opinions and data contained in all publications are solely those of the individual author(s) and contributor(s) and not of MDPI and/or the editor(s). MDPI and/or the editor(s) disclaim responsibility for any injury to people or property resulting from any ideas, methods, instructions or products referred to in the content.

