Article

Genotypic Response of Finger Millet to Zinc and Iron Agronomic Biofortification, Location and Slope Position towards Yield

1
Center for Food Science and Nutrition, Addis Ababa University, Addis Ababa 1176, Ethiopia
2
Faculty of Epidemiology and Population Health, London School of Hygiene and Tropical Medicine, London WC1E 7HT, UK
3
Rothamsted Research, Hertfordshire AL5 2JQ, UK
4
School of Biosciences, University of Nottingham, Sutton Bonington Campus, Leicestershire LE12 5RD, UK
5
Alliance for a Green Revolution in Africa (AGRA), Sustainably Growing Africa’s Food Systems, Nairobi 66773, Kenya
*
Author to whom correspondence should be addressed.
Agronomy 2023, 13(6), 1452; https://doi.org/10.3390/agronomy13061452
Submission received: 27 April 2023 / Revised: 18 May 2023 / Accepted: 23 May 2023 / Published: 24 May 2023
(This article belongs to the Special Issue Transforming AgriFood Systems under a Changing Climate)

Abstract

:
The present study aimed to investigate the influence of genotypic differences on responses to zinc and iron agronomic biofortification among yields of finger millet. A field experiment was conducted over two seasons in farmers’ fields in Ethiopia (2019, 2020). The experimental design had 15 treatment combinations comprising three finger millet genotypes and the applications of different combinations of zinc and iron mineral fertilizers. Five soil-applied fertilizer treatments (20 kg h−1 FeSO4 + 25 kg h−1 ZnSO4 + NPKS, 25 kg ha−1 ZnSO4 + NPKS, 20 kg ha−1 FeSO4 + NPKS, NPKS, and 30% NPKS) at two locations (Gojjam and Arsi Negelle, Ethiopia) and using two slope positions (foot and hill) were replicated four times in a randomized complete block design. Grain yield and biomass were evaluated on a plot basis. Plant height, total and productive tiller number, finger length of the longest spike and number of fingers per main ear were measured at the maturity stage. The combined soil application of FeSO47H2O and ZnSO47H2O increased the yield of the Meba genotype by 51.6%. Additionally, ZnSO47H2O fertilizer application increased the yield of the Urji genotype by 27.6%. A yield enhancement of about 18.3% of the Diga-01 genotype was achieved due to the FeSO47H2O fertilizers’ application. The findings of the present study suggest that the influence of Zn and Fe agronomic biofortification on the yield of finger millet could be affected by genotype differences and environmental conditions.

1. Introduction

Cereal crops naturally have very low grain zinc (Zn) and iron (Fe) concentrations, and growing them on soils deficient in potentially plant-available Zn- and Fe further affects yield as well as grain Zn and Fe concentrations [1]. Studies show that about half of cereal-cultivating soils globally are deficient in plant-available Zn [2], particularly acidic soils, and those in high-rainfall areas of the tropics. In spite of high total concentrations of Fe in tropical soils, high-level oxidation and fixation significantly affect their plant availability [3]. Deficiencies of Fe and Zn in soil results in reduced crop yield as well as quality since both minerals play major biological roles in plants, such as maintaining proper metabolic and physiological cellular processes [3].
Crop genotypes’ breeding for resistance to Zn and Fe deficiency is a realistic and long-term solution to overcome problems related to Zn and Fe deficiency in soils [4]. However, breeding genotypes can require substantial time [5] as well as a relatively higher investment as compared to agronomic biofortification [6].
Fertilization with Zn and Fe is a common practice to help to combat Zn and Fe deficiencies as a short-term strategy [3,7]. Crop Zn and Fe deficiencies are most frequently amended by agronomic biofortification through soil application of Zn and Fe fertilizers [8]. Zinc sulphate (ZnSO4) and ferrous sulphate (FeSO4) are used extensively as sources of Zn and Fe fertilizers, because of their higher solubility in water and existence in both crystalline and granular forms [9]. Many studies have reported that the agronomic biofortification with Fe and Zn positively enhances crop yield and/or grain Fe and Zn concentrations in crops like wheat, maize and rice [1,2,3].
Crop selection in agronomic biofortification plays a critical role in its effectiveness. The identification and improvement of traditional or native crops that are highly adaptive to local climates and that can efficiently withstand biotic and abiotic stresses is crucial. Finger millet (Eleusine coracana L.) represents one of the critical plant genetic resources for the agriculture and food security of populations inhabiting arid, infertile and marginal lands [10]. In the semiarid tropics of eastern Africa, it is the major staple food for millions of resource-poor people and plays an important nutritional and economic role [11]. Finger millet is adaptable to adverse agro-ecological conditions with minimal inputs (fertilizer, pesticides and herbicides), showing low moisture stress and disease tolerance, is productive on marginal land where other crops cannot perform, and shows tolerance to acidic soil [12,13]. In Ethiopia, finger millet is the sixth most important crop after tef, wheat, maize, sorghum and barley. It has been produced on 480,343 hectares of land, from which ~1.2 M tons have been obtained at the national level per year [14]. Nationwide, ~1.55 M households are directly engaged in finger millet production, and the production has increased by 300% in the previous 20 years [14].
Previous reports on the impact of agronomic biofortification with Zn and Fe, regarding genotype as well as slope position, of indigenous crops like finger millet and teff in tropical smallholding farming systems are lacking. However, a report from Ethiopia has indicated that wheat yield was more strongly influenced by slope positions than either the nutrient sources or rates; thus, site-specific fertilizer treatment is strongly recommended [15]. Therefore, this paper reports on the effect of basal application of Zn and Fe fertilizer on grain yield and the yield attributes of three finger millet genotypes at different locations and slope positions.

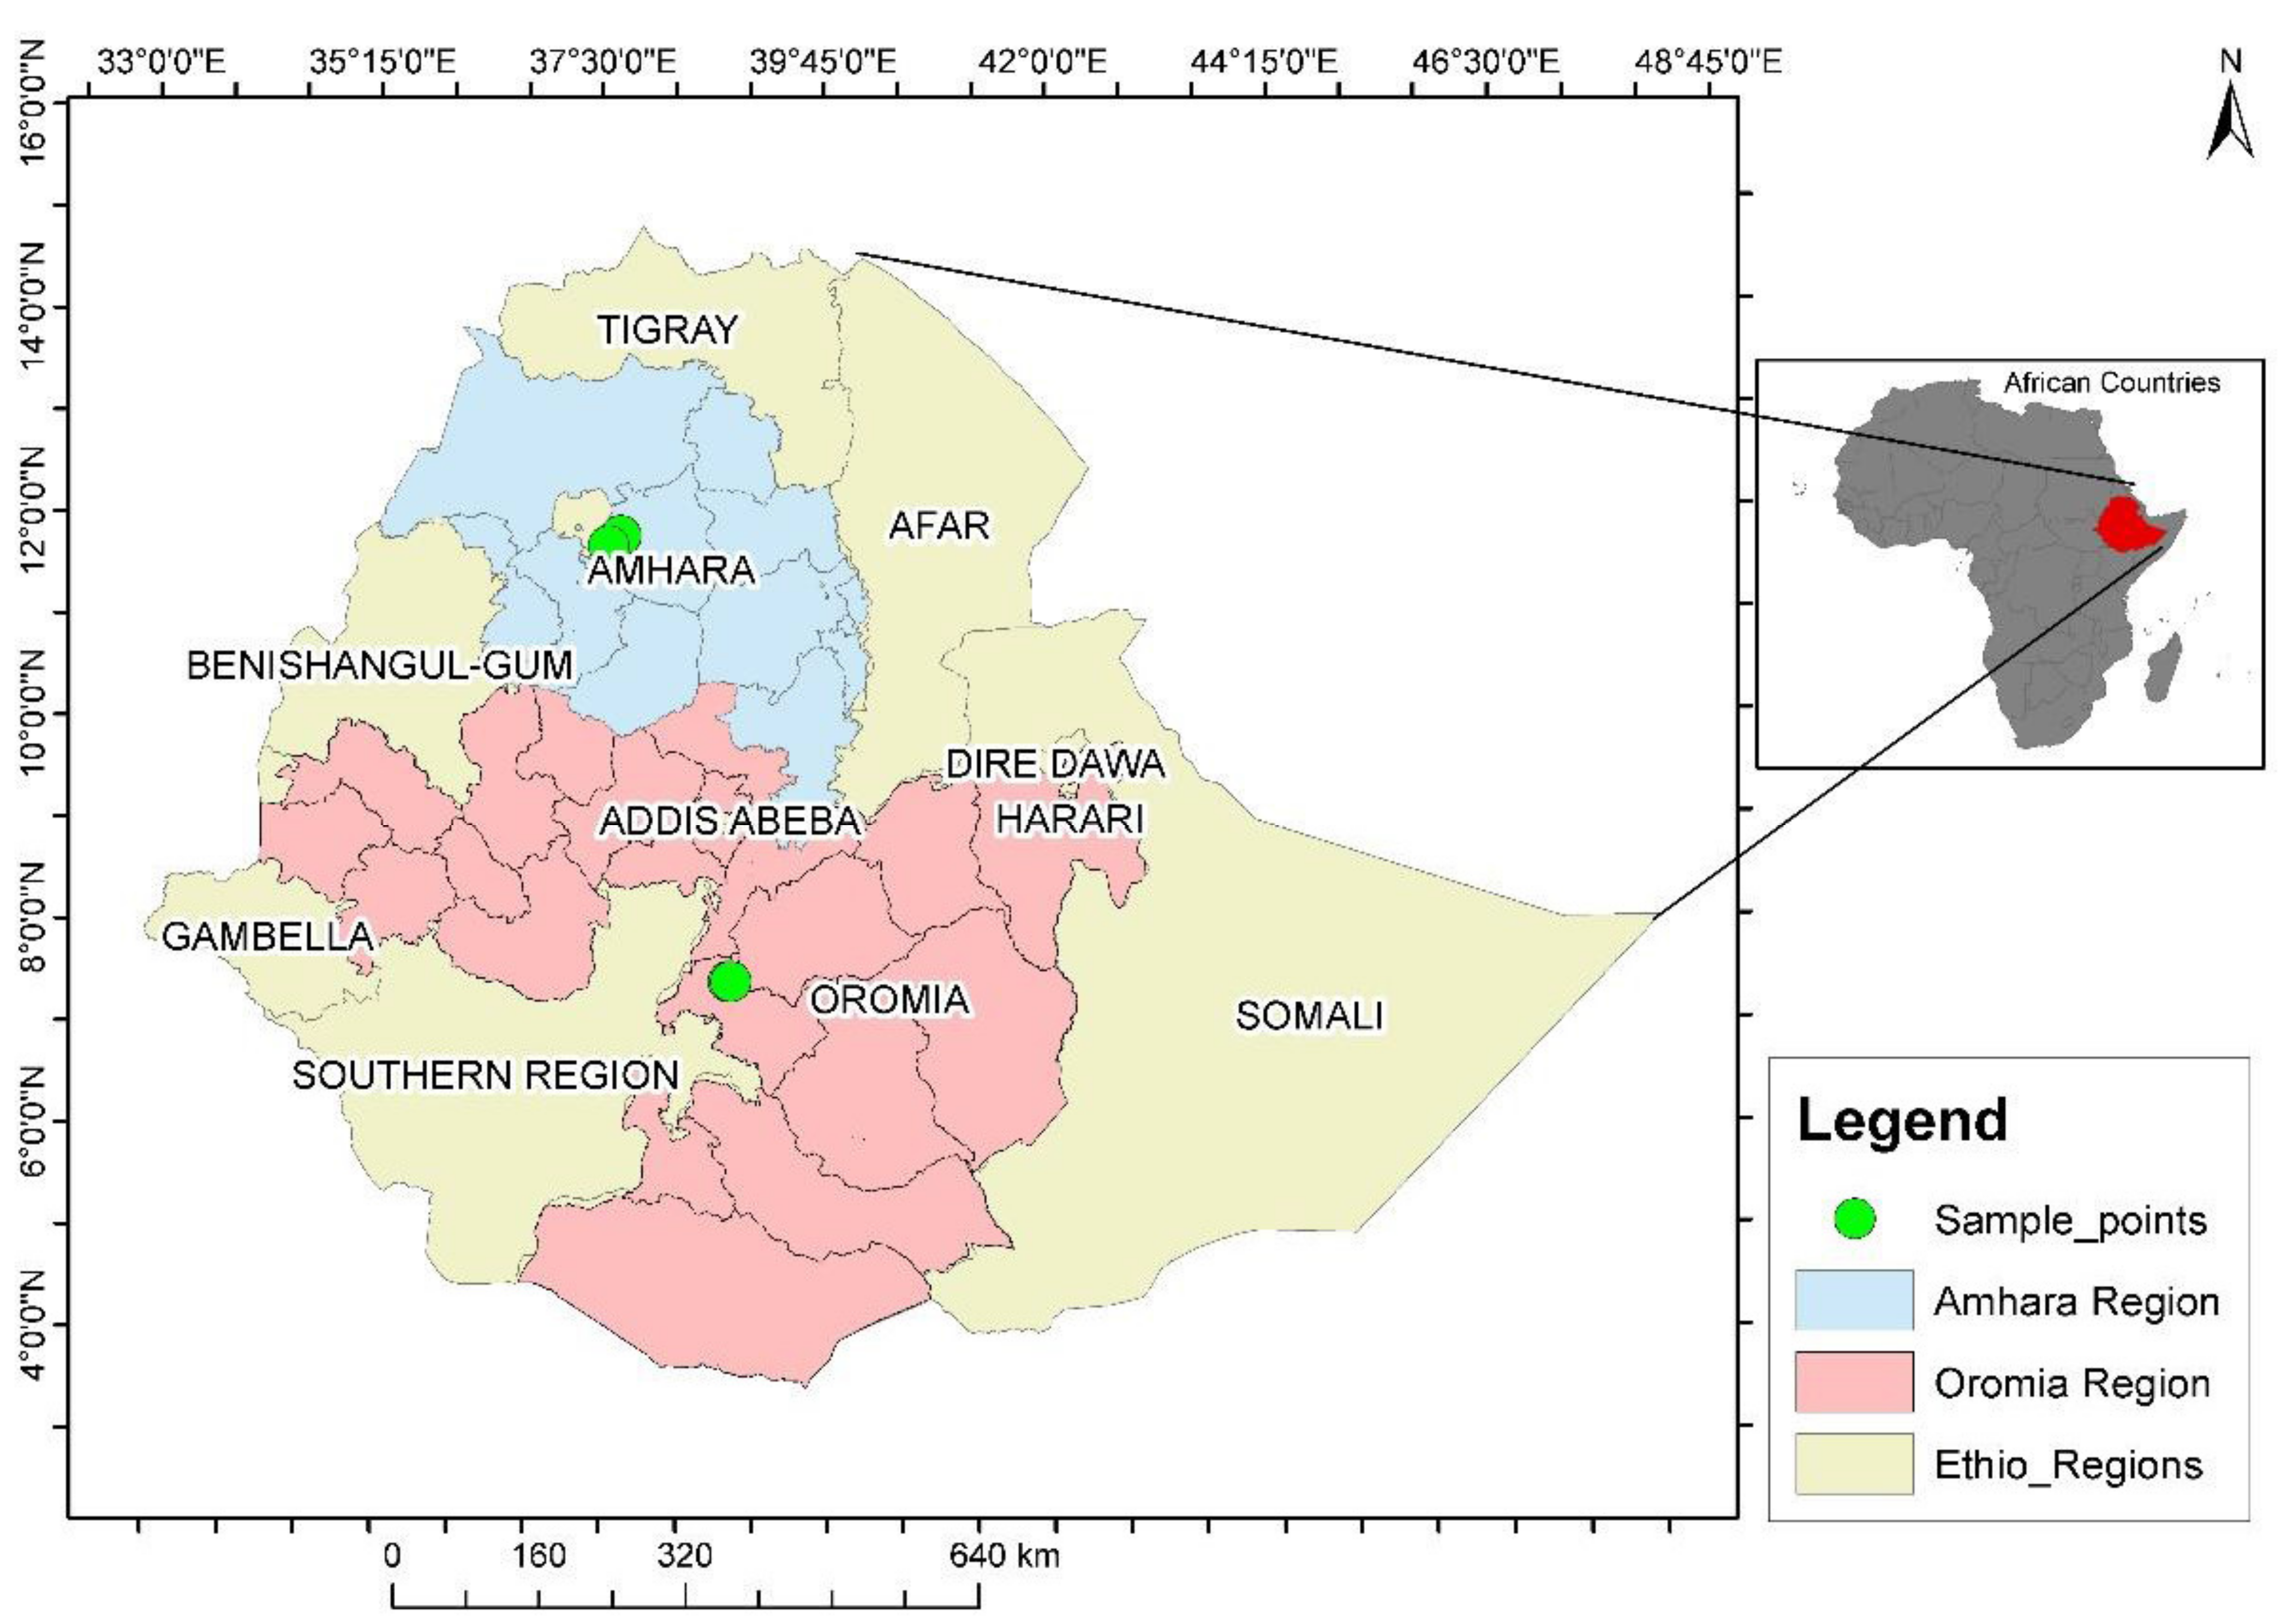
2. Materials and Method

2.1. Field Experiment

The agronomic biofortification trials with Zn and Fe micronutrients were carried out at the Gojjam (11°41′54′’ N 37°29′79′’ E foot slope and 11°40′23′’ N 37°30′29′’ E hill slope) and Arsi Negelle (7°19′38′’ N 38°38′54′’ E foot slope and 7°18′43′’ N 38°39′57′’ E hill slope) areas on farmers’ land (Figure 1). According to the classification of the agro-ecological zonation of Ethiopia, both sites are characterized as sub-humid midlands located between 1500–2300 m.a.s.l. and as having unimodal rainfall, with an average annual rainfall of 800–1200 mm [16]. The average temperature was recorded as 13 °C and 10 °C for the minimum and 23 °C and 26 °C for the maximum for Arsi Negelle and Gojjam, respectively, during the experimental seasons. The average temperature was 17.5 °C [17] and 20 °C [18] for Arsi Negelle and Gojjam, respectively. The experiment was laid out in a randomized complete block design (RCBD) (Supplementary Materials) with a factorial concept with 4 replications consisting of 15 treatment combinations involving 3 finger millet genotypes (Dagi-01, black in colour; Urji, white in colour and Meba, brown in colour) and 5 levels of fertilizer application (Table 1).

2.2. Agronomic Management

The plot size was 4 m × 4 m, with gangways between plots being 1 m wide while the distances between the blocks and the borders were 0.5 m each. The experiment was repeated for two seasons, but only at Arsi Negelle (due to COVID-19 pandemic travel restrictions), and different farms were used in each year, sowed between mid-June and mid-July and harvested in November. Planting was done by hand drilling at a seed rate of 7 kg ha−1. Each experimental plot had ten rows with 40 cm of inter-row spacing. NPKS, ZnSO47H2O and FeSO47H2O were applied at planting and urea was applied after 45 days at first weeding. All plots were weeded at least six times using human labour and no pesticides or herbicides were applied. Plant samples for data collection were tagged right after 100% crop germination and the crop was developed in a rainfed fashion, without irrigation.

2.3. Soil Sample Collection

The soil classes of both experimental locations, including the slopes, were mostly Nitisols [17,18]. Soil samples were taken from a 60 m2 circular plot in the experimental field. Five sub-sample sites were located; the first was at the centre. Two sub-sample points were selected at locations on a line through the plot centre along the crop rows, and two on a line orthogonal to the first through the plot centre. The ‘long’ axis of the sample array (with sample locations at 5.64 and 4.89 m) was oriented in the direction of crop rows, with the ‘short axis’ (with sample locations at 3.99 and 2.82 m) perpendicular to the crop rows. A single soil sub-sample was collected at each of the five sub-sample points with a Dutch auger with a flight of length 150 mm and diameter of 50 mm. Any plant material adhering to the auger was carefully removed, and the five sub-samples were stored in a single bag [19].

2.4. Soil Mineral Analysis

Soil sample digestion was performed following aqua regia digestion for the extraction of trace elements method (ISO 11466) (ISO, 1995). Briefly, 3 mL of 36% HCl and 9 mL of 70% HNO3 were added in a microwave digestion tube containing 0.5 g of a ground soil sample. The digestion vessels were then transferred to the cavity of the microwave unit and the digestion was started at 185 °C and continued for 30 min. The digested sample supernatant was filtered carefully and diluted to 50 mL in a volumetric flask. CRM Wageningen-WEPAL ISE-850 (Calcareous soil) was used as a certified laboratory reference material and % mineral recovery was calculated. Blanks were also analysed at the same time. A three-step sequential extraction scheme for the fractionation of sulphur (S) was followed, using 0.01 M KNO3, 0.016 M KH2PO4 and 10% tetra methyl ammonium hydroxide (TMAH) to determine soluble, exchangeable and organically-bound S fractions, respectively. The detailed procedure for soil sample collection, mineral analysis and three-step sequential extraction is reported elsewhere [19]. The soil mineral concentrations of each experimental site are presented in Table 2. The total calcium, potassium, boron, sulphur and iron contents of the soil samples were significantly different among the two locations and slope positions. The recovery for all minerals is between the acceptable ranges (85–120%).

2.5. Agronomic Data Collection

The plant height, total tiller number, productive tiller number (number of basal tillers which bear mature ears), finger length of the longest spike and number of fingers per main ear were measured at the 50% maturity stage, which is after ~130 days after germination (International Board for Plant Genetic Resources [20]). Grain yield at 12% average moisture and biomass at 18% average moisture were taken (from the eight central rows) on a plot basis and then converted to a hectare basis. The plant height was measured from the ground to the tip of the inflorescence (ear). Finger length was measured from the base to the tip of the longest spike on the main tiller.

2.6. Data Analysis

Data collected for all agronomic quantitative characters were subjected to analysis of variance (ANOVA) using R software version 3.3.2 (R: A Language and Environment for Statistical Computing, R Foundation for Statistical Computing). The major descriptive statistics such as mean, range and standard deviation of each trait for the study genotypes, fertilizer levels, study location and slope positions were computed. Slope, fertilizer level and genotype were treated as fixed effects, whereas season, block within farm, farm within location and location were treated as random effects. Yield and biomass data were transformed to natural logarithms, as the dispersion of the random effects on the original scale appeared to increase with the fitted value. A comparison of means was done using Tukey’s post hoc test (p < 0.001, 0.01, 0.05 and 0.1).

3. Result

Yield and Biomass Effects
Finger millet yield and biomass per hectare for each fertilizer treatment, genotype, location and slope position are presented in Figure 2, Figure 3, Figure 4 and Figure 5. The total and productive tiller numbers, number of fingers per main ear, plant height and finger lengths (cm) for each fertilizer treatment, genotype, location and slope are presented in Table 3 and Table 4. Yield and biomass showed a wide variation, ranging from 94 to 3828 kg and from 6.25 to 242.97 quintals per hectare, respectively. The maximum yield of the NPKS at the recommended rate in the current experiment (3594 kg ha−1) was much higher than the national average [14] of 2504 kg. The finger number per main ear, total tiller number and productive tiller number ranged between 1 and 14, 1 and 16 and 1 and 14, respectively. The plant height and finger length ranged between 4 and 120 and 3 and 17 cm, respectively.
A significant response from the Meba genotype to the combined FeSO47H2O and ZnSO47H2O fertilizer application at the Gojjam hill slope was exhibited; the average yield was increased by 51.6% (Table 5). The Diga-01 genotype responded significantly to FeSO47H2O fertilizers at the Arsi Negelle hill slope position; an 18.3% average yield enhancement was recorded. A significant response was observed from the Urji genotype to ZnSO47H2O fertilizers at the Gojjam hill slope position; a 27.6% average yield increase was observed. Irrespective of locations, slope position and genotype, grain yield was enhanced by 20% due to the soil application of FeSO47H2O fertilizer.
Strong evidence (p < 0.001) was exhibited for the fertilizer’s effect on finger millet yield irrespective of location, slope and genotype (Table 5). Similarly, the genotype shows strong evidence (p < 0.001) of effect on yield over location, slope and fertilizer. Moderate evidence (p < 0.05) has been seen for a slope position effect on finger millet yield irrespective of location, fertilizer application and genotype (Table 5). However, there is no evidence for the effect on yield due to the interaction of fertilizer and genotype (Table 5).
The fertilizer shows strong evidence (p < 0.001) of effect on finger millet biomass irrespective of location, slope and genotype (Table 6). Some evidence (p < 0.05) has been seen for a slope position effect on biomass irrespective of location, fertilizer and genotype (Table 6). Similarly, a slight genotype effect (p < 0.05) on biomass irrespective of location, slope and fertilizer was observed. However, the interaction of fertilizer and genotype exhibited no effect on biomass (Table 6).
Genotypes differed significantly in both the yield (p < 0.001) and biomass (p < 0.05) of finger millet, showing the average result of Diga-01 > Meba > Urji. Similarly, fertilizer treatment significantly (p < 0.001) affected both the yield and biomass of finger millet, showing the average results of T5 > T1 > T3 > T2 > T4 and T3 > T1 > T2 > T5 >T4, respectively.
Strong evidence (p < 0.001) was seen for the fertilizer’s effect on finger millet plant height as well as on finger length irrespective of location, slope and genotype. The genotype shows strong evidence (p < 0.001) for its effect on finger length and for some effect on plant height (p < 0.05). Slope position shows weak evidence (p < 0.1) for its effect on plant height.

4. Discussion

The present study reports finger millet genotypic responses to Zn and Fe agronomic biofortification, location and slope position in yield and biomass. Irrespective of genotype, locations and slope positions, grain yield was enhanced by 20% due to the soil application of FeSO4 fertilizer. However, different finger millet genotypes responded differently to both fertilizer treatment and location with respect to yield and yield traits. This suggests that finger millet genotypes differ in their ability to remobilize and retranslocate deposited Zn and Fe, which plays a critical role in the improvement of the partitioning of carbohydrates from the leaves to the reproductive parts, affecting the yield and yield attributes. Therefore, the current finding should be taken into consideration in evaluating cereal genotypes for their responses to agronomic biofortification. To our knowledge, there is no available previous data on finger millet with Zn, Fe, or combined fertilizer, with genotype, location, and slope position effects, on grain yield and yield traits. Thus, this experiment is the first of its kind to report the triple impact of Zn and Fe agronomic biofortification, genotype, and environment (location and slope position) on the grain yield and biomass of finger millet. However, previous studies show that different finger millet genotypes responded differently to NPK fertilization in India [21], to phosphorus fertilizer in locations in Kenya [22], and to location in Ethiopia [23]. On the other hand, wheat and rice genotypes responded differently to Zn fertilization in Turkey [8] and to Zn fertilization as well as climate in India [24], respectively.

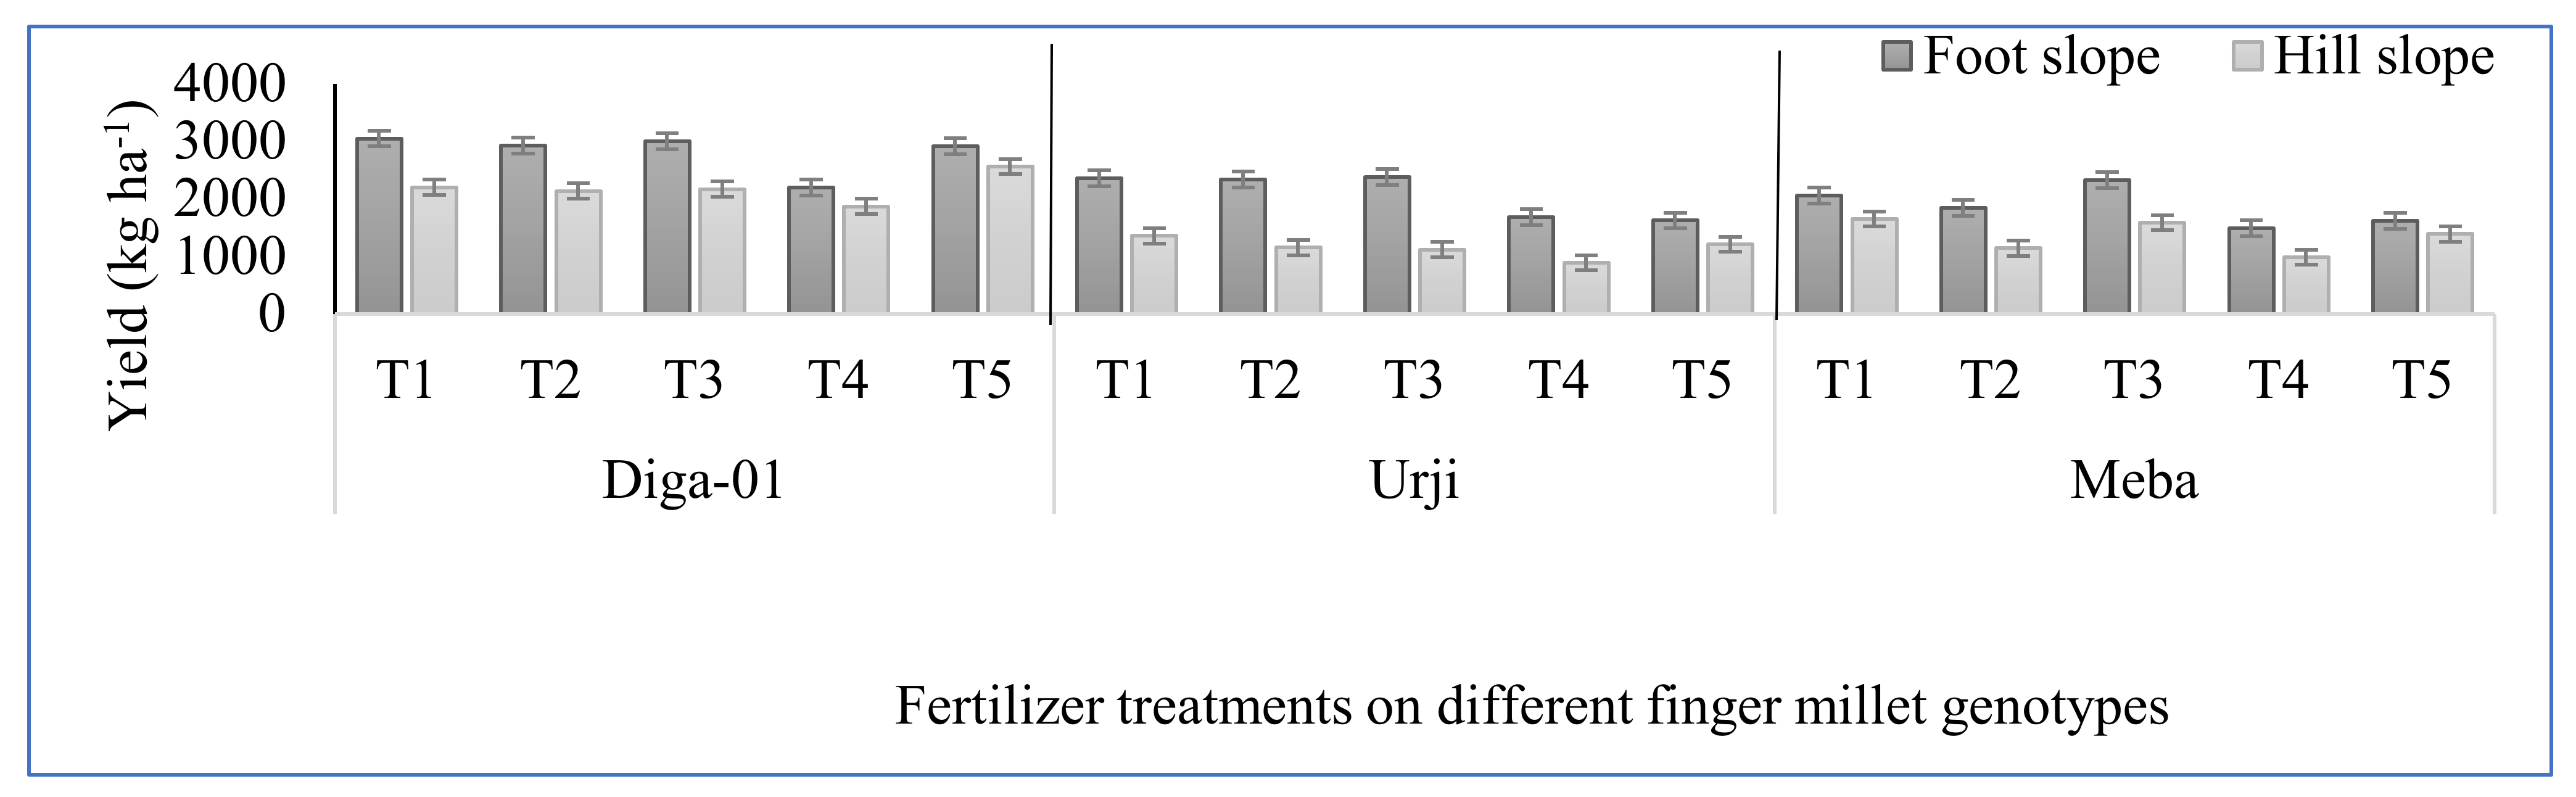
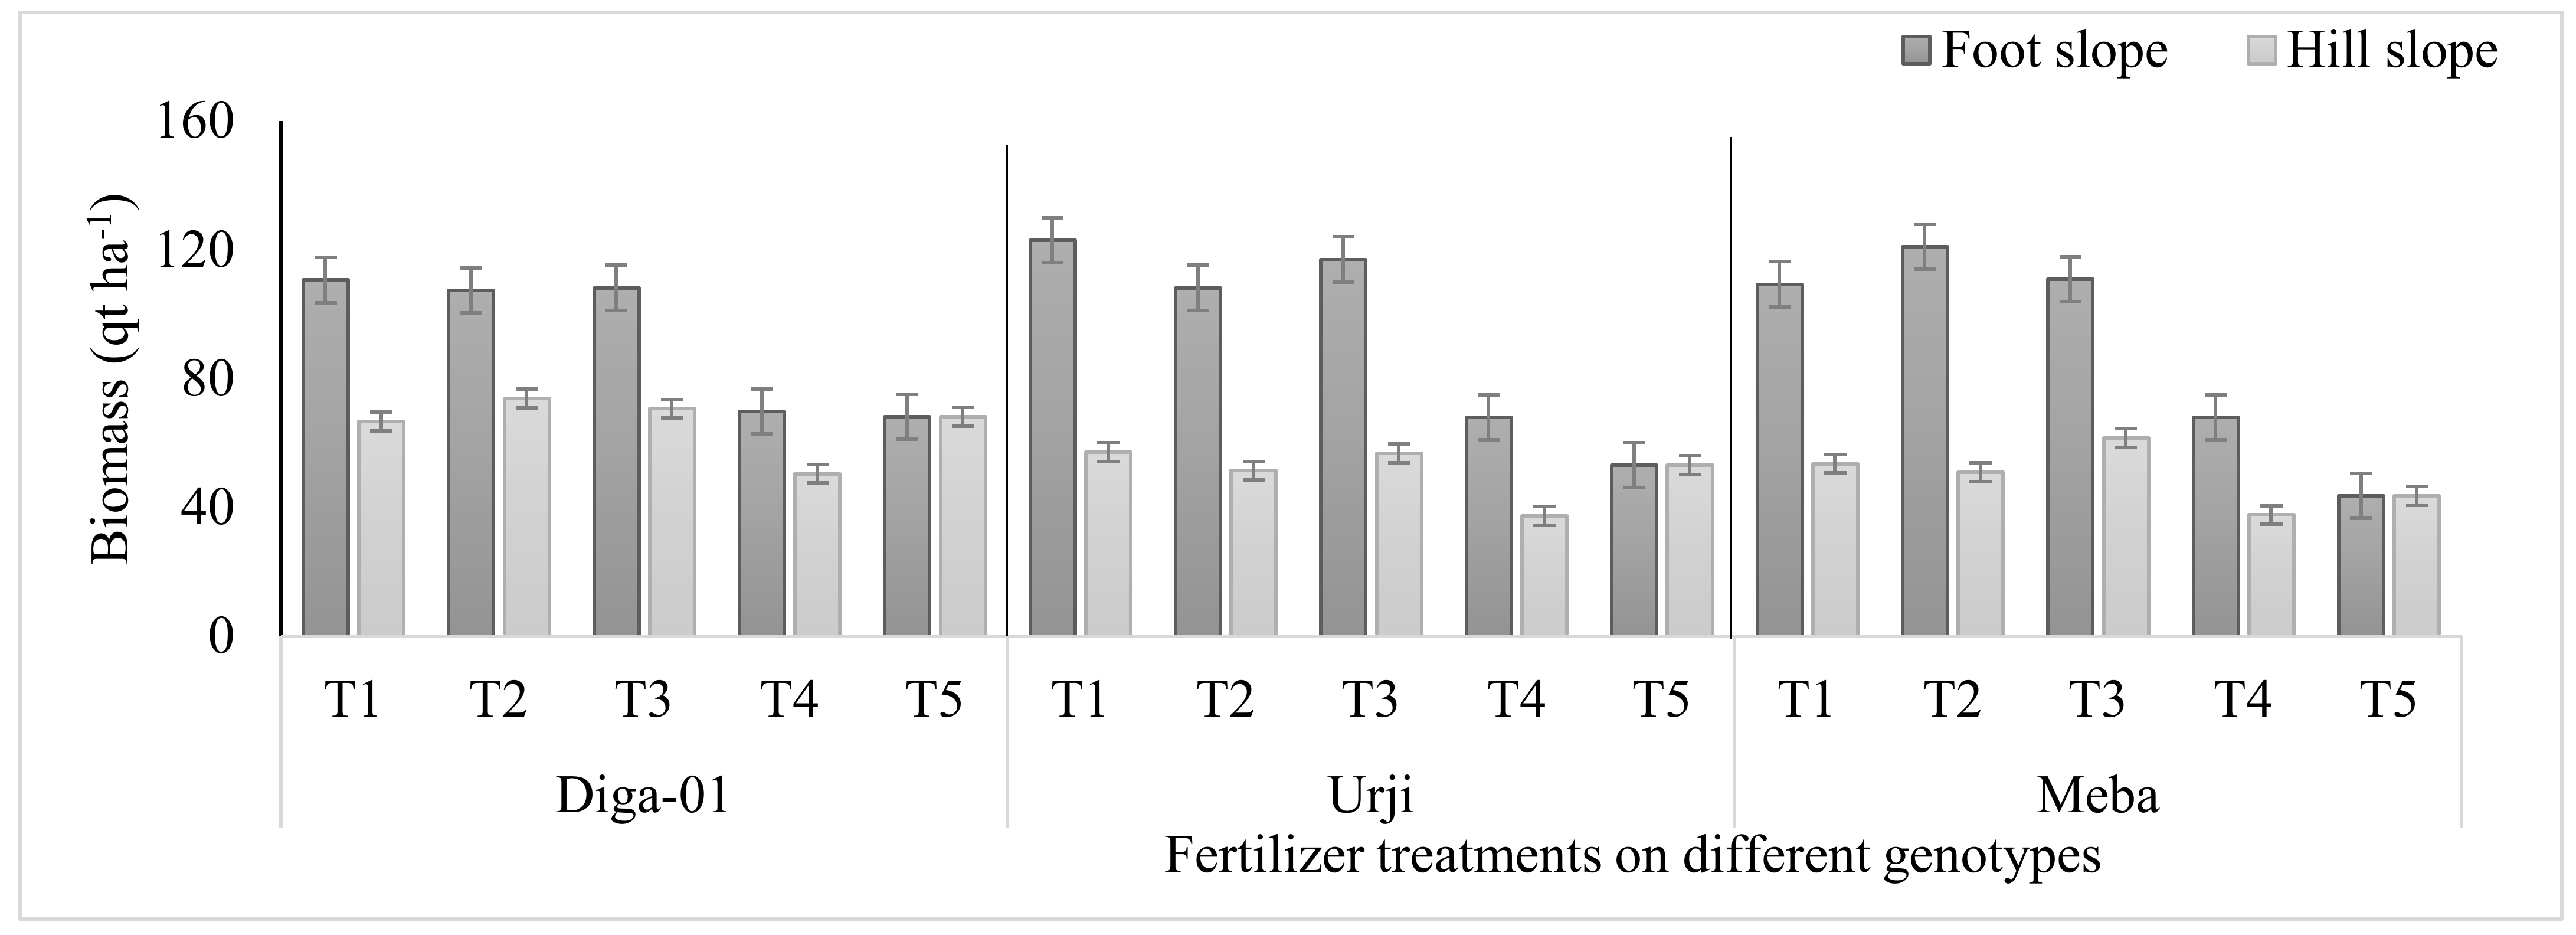
4.1. Finger Millet Genotypic Response to Zn Fertilizer towards Yield Affected by Location and Slope Position

The present study indicates that the Urji genotype responds significantly to ZnSO4 fertilizers at the Gojjam hill slope position, where a 27.6% yield increase was observed. The possible reason behind the fact that finger millet responded well at the Gojjam hill slope position to Zn fertilization is that the soil sulphur concentration is significantly higher at the Gojjam hill slope position (Table 1), since sulphur is reported to enhance the solubility of Zn and its uptake by the plant [25]. On the other hand, the application of ZnSO4 fertilizers significantly increased the total and productive tiller number for the Urji genotype at the hill slope position (Table 4), and this might have also played a major role in the yield increase. There are no available previous data that explore the impact of Zn fertilization on finger millet grain yield. However, previous research on wheat, rice, maize, sorghum, etc, has explored the effect of Zn fertilization on grain yield. A study from India showed a 14.2% yield increase as a result of the application of Zn fertilization [26]. Similarly, Phattarakul et al. [27] reported an increase of 10% in crop yield in their experiment, which was conducted in China and India. Another experiment from India indicated a 23.5% increase in grain yield by applying Zn fertilization [28]. An increase in yield of up to 33% was observed as a result of the application of Zn fertilizer [24]. Narwal et al. [29] also found a 5% yield enhancement by applying Zn fertilizer. Overwhelming evidence from all over the world indicates that the application of Zn fertilizer improves crop yields [1,2,8,30,31,32,33,34,35,36,37,38,39,40,41,42,43,44,45]. The positive response of yields in cereal to Zn fertilization in both current and previous studies is possibly due to the enhancement of plants’ available Zn for uptake [8], which in turn helps the plants achieve better protein breakdown and enzyme activation, resulting in higher vegetative growth and yield increases [28]. However, one study from Thailand and Turkey shows little or insignificant effect of Zn fertilizer application on yield [27]. The irresponsiveness of rice to Zn fertilization in a previous study was possibly due to the absence of sulphur fertilization, since sulphur has been reported to enhance the solubility of Zn and its uptake by spring wheat [25]. In addition to that, a lower soil Zn concentration was reported (ranging from 0.5 to 6.5 mg kg−1 in a previous study, in contrast to 85 to 105 mg kg−1 in the present study). The other possibility might be that different crop genotypes responded differently to Zn fertilizer treatment, climate and environment (location and slope position), as was witnessed in the current as well as previous studies [8,23,24,45].

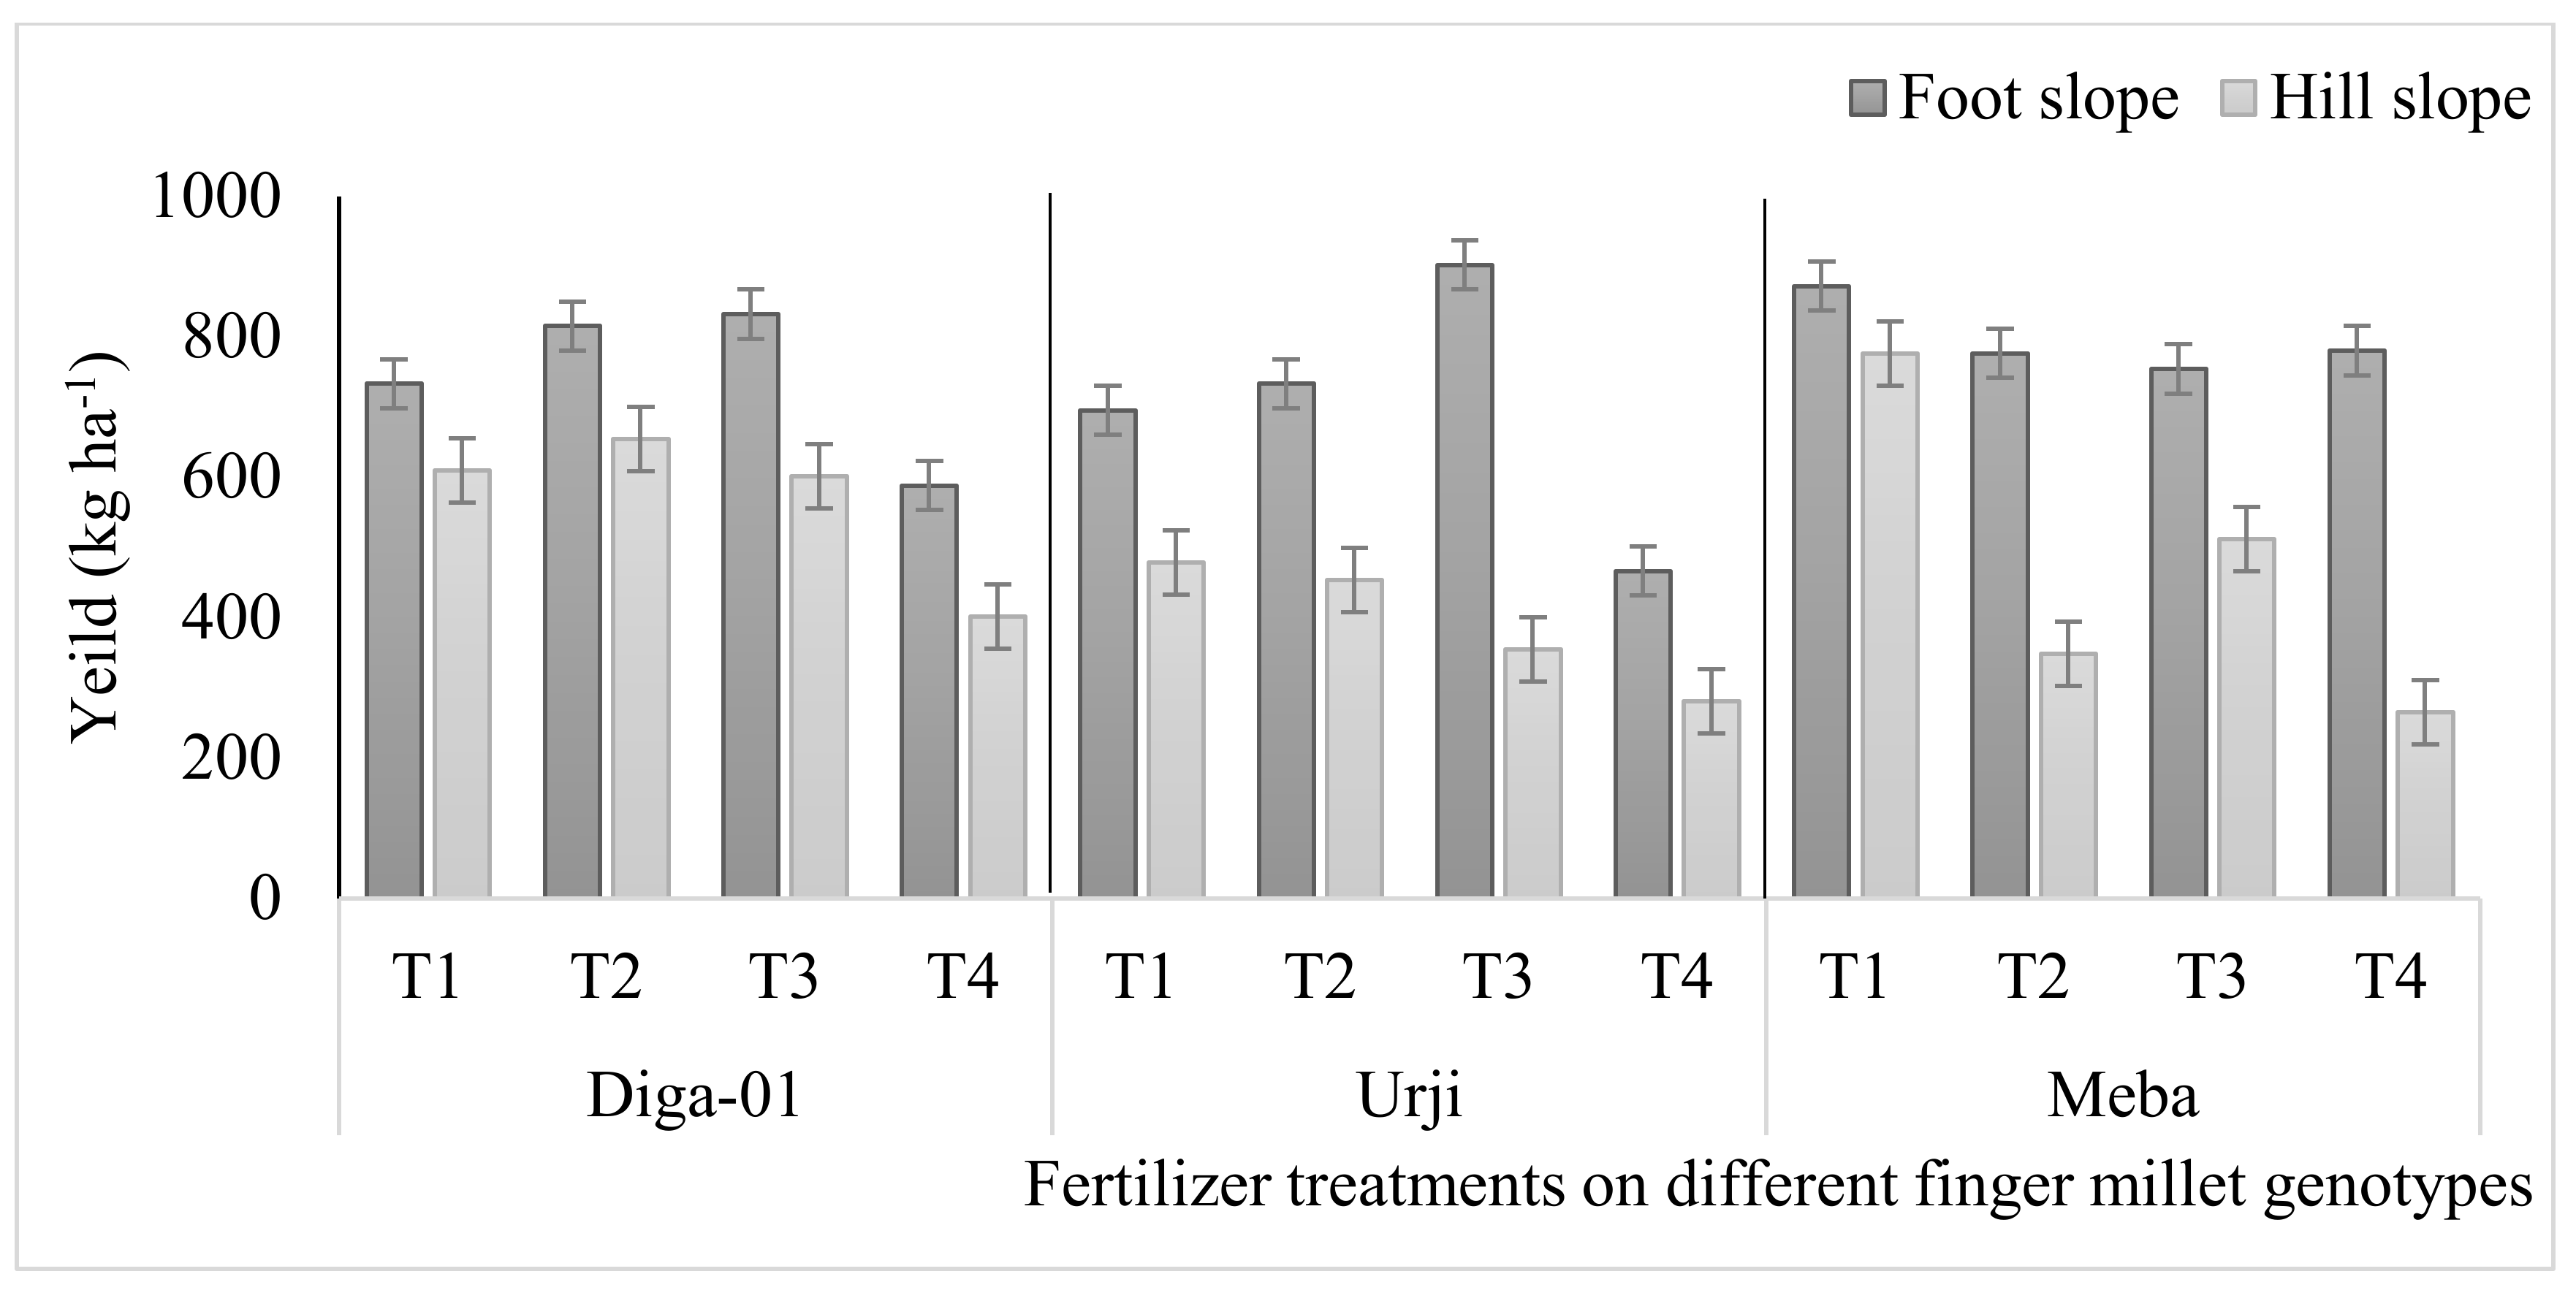
4.2. Finger Millet Genotypic Response to Fe Fertilizer towards Yield Affected by Location and Slope Position

The present study indicates that the Diga-01 genotype responded significantly to FeSO4 fertilizer application at the Arsi Negelle hill slope position, in which an 18.3% average yield enhancement was recorded. The possible reason behind the fact that finger millet responded well at the Arsi Negelle hill slope position to Fe fertilization is that the soil potassium concentration is significantly higher at the Arsi Negelle hill slope position (Table 1), since it is reported that potassium seems to have a very specific role in the plant for the maximum utilization of Fe [46,47]. On the other hand, application of FeSO4 fertilizers significantly increased the total and productive tiller number for the Diga-01 genotype at the hill slope position (Table 3), and this might also play a major role in yield increase. Even though no data are available for Fe fertilization’s impact on finger millet grain yield, a few previous experiments on wheat, barley and oats have investigated the effect of Fe fertilization on grain yield and are discussed with the current result. The agronomic biofortification of Fe fertilizer is less well studied as compared to Zn fertilizer. For instance, a study from India indicated an enhancement of 13% in yield due to the application of Fe fertilizer [29]. The positive response of yield to Fe fertilization in both current and previous studies is possibly due to the enhancement of plant-available/soluble Fe for uptake [8], which in turn helps the plant achieve better chlorophyll synthesis, protein and carbohydrate metabolism and enzyme activation, resulting in better vegetative growth and yield increases [48]. However, studies from Turkey and Canada on Fe biofortification showed no yield improvement [30,49]. This might be due to three possible reasons: the first reason could be that, in general, different crops and genotypes responded differently to mineral fertilization as well as location [1,23,24]. The second possibility is that when applied to calcareous soils, Fe rapidly converted into unavailable forms, and the poor mobility of Fe in phloem makes the Fe fertilization impact limited or unsuccessful [2,44]. It is also possibly due to the graminaceous species’ release of phytosiderophores (Fe-mobilizing compounds) to solubilize and absorb Fe from calcareous soils with low Fe concentrations; thus, they can maintain adequate plant growth by satisfying Fe demand without the requirement for Fe fertilization [50,51].

5. Conclusions

Finger millet genotypes greatly influenced the response to agronomic biofortification of Zn and Fe fertilizer in the present study, which indicates the varied yield and yield traits performances of the genotypes across different environments (location and slope position). This reveals the vitality of experimenting on finger millet genotypes’ responses to Zn and Fe fertilizer in different environments (location and slope positions) prior to a scale-up for mass production. The soil application of 20 kg of FeSO47H2O per hectare along with the recommended rate of NPKS could be an excellent agronomic biofortification strategy to enhance the yields of all genotypes in the study areas and in areas with similar agro-ecologies. Moreover, the soil application of 20 kg ZnSO47H2O and of a combined 20 kg FeSO47H2O and 25 kg ZnSO47H2O in Urji and Meba, respectively, at the Gojjam hill slope and in areas with similar agro-ecologies, could be a premium agronomic biofortification strategy to improve finger millet grain yield. Future studies as well as the development of programs on agronomic biofortification should consider environmental (location and slope position) effects in addition to the main fertilizer effect, which is a gap in the current knowledge.

Supplementary Materials

The following supporting information can be downloaded at: https://www.mdpi.com/article/10.3390/agronomy13061452/s1.

Author Contributions

D.T., D.G., E.J.M.J., R.M.L., T.A. and M.R.B.: conceptualization. D.T.: data collection, supervision, and original draft preparation. D.T. and T.A.: experimental design. D.T. and E.H.B.: soil sample preparation and analysis. D.T., D.G. and R.M.L.: statistical analysis. D.T., D.G., E.J.M.J., R.M.L., E.H.B., L.W., T.A. and M.R.B.: writing—review and editing. All authors have read and agreed to the published version of the manuscript.

Funding

This work was also supported, in part, by the Bill & Melinda Gates Foundation [INV-009129]. Under the grant conditions of the Foundation, a Creative Commons Attribution 4.0 Generic License has already been assigned to the Author-Accepted Manuscript version that might arise from this submission. Funding was also provided by USAID: Feed the Future. The funders had no role in the design, execution, analyses or interpretation of the data.

Data Availability Statement

Not applicable.

Acknowledgments

The authors would like to thank the Amhara and Oromia regional states agriculture bureau, the Melkasa and Bako Agricultural Research Centres, the International Crop Research Institute for the Semi-Arid Tropics, Roman Dale, the data collectors, and the supervisors and participating farmers.

Conflicts of Interest

The authors declare no conflict of interest.

References

  1. Cakmak, I.; Pfeiffer, W.H.; McClafferty, B. Biofortification of durum wheat with zinc and iron. Cereal Chem. 2010, 87, 10–20. [Google Scholar] [CrossRef]
  2. Cakmak, I. Enrichment of cereal grains with zinc: Agronomic or genetic biofortification? Plant Soil 2008, 302, 1–17. [Google Scholar] [CrossRef]
  3. García-Bañuelos, M.L.; Sida-Arreola, J.P.; Sánchez, E. Biofortification-promising approach to increasing the content of iron and zinc in staple food crops. J. Elem. 2014, 19, 865–888. [Google Scholar]
  4. Graham, R.D.; Welch, R.M. Breeding for Staple Food Crops with High Micronutrient Density; International Food Policy Research Institute: Washington, DC, USA, 1996; Volume 3, pp. 14–16. [Google Scholar]
  5. Ma, G.; Jin, Y.; Li, Y.; Zhai, F.; Kok, F.J.; Jacobsen, E.; Yang, X. Iron and zinc deficiencies in China: What is a feasible and cost-effective strategy? Public Health Nutr. 2008, 11, 632–638. [Google Scholar] [CrossRef] [PubMed]
  6. Stein, A.J.; Nestel, P.; Meenakshi, J.V.; Qaim, M.; Sachdev, H.P.S.; Bhutta, Z.A. Plant breeding to control zinc deficiency in India: How cost-effective is biofortification? Public Health Nutr. 2007, 10, 492–501. [Google Scholar] [CrossRef]
  7. Velu, G.; Ortiz-Monasterio, I.; Cakmak, I.; Hao, Y.; Singh, R.Á. Biofortification strategies to increase grain zinc and iron concentrations in wheat. J. Cereal Sci. 2014, 59, 365–372. [Google Scholar] [CrossRef]
  8. Yilmaz, A.; Ekiz, H.; Torun, B.; Gultekin, I.; Karanlik, S.; Bagci, S.A.; Cakmak, I. Effect of different zinc application methods on grain yield and zinc concentration in wheat cultivars grown on zinc-deficient calcareous soils. J. Plant Nutr. 1997, 20, 461–471. [Google Scholar] [CrossRef]
  9. Mortvedt, J.J.; Gilkes, R.J. Zinc fertilisers. In Zinc in Soil and Plants; Robson, A.D., Ed.; Springer: Dordrecht, The Netherlands, 1993; pp. 33–44. [Google Scholar]
  10. Gupta, S.M.; Arora, S.; Mirza, N.; Pande, A.; Lata, C.; Puranik, S.; Kumar, J.; Kumar, A. Finger millet: A “certain” crop for an “uncertain” future and a solution to food insecurity and hidden hunger under stressful environments. Front. Plant Sci. 2017, 8, 643. [Google Scholar] [CrossRef]
  11. Lata, C. Advances in Omics for Enhancing Abiotic Stress Tolerance in Millets. Proc. Indian Natl. Sci. Acad. 2015, 81, 397–417. [Google Scholar]
  12. Gull, A.; Jan, R.; Nayik, G.A.; Prasad, K.; Kumar, P. Significance of finger millet in nutrition, health and value added products: A review. Magnesium 2014, 130, 1601–1608. [Google Scholar]
  13. Upadhyaya, H.D.; Gowda, C.L.L.; Reddy, V.G. Morphological diversity in finger millet germplasm introduced from Southern and Eastern Africa. J. SAT Agric. Res. 2007, 3, 1–3. [Google Scholar]
  14. Central Statistical Agency (CSA). Central statistical agency agricultural sample survey. Report on Area and Production of Major Crop. Stat. Bull. 2021, 590, 1. [Google Scholar]
  15. Amede, T.; Gashaw, T.; Legesse, G.; Tamene, L.; Mekonen, K.; Thorne, P.; Schultz, S. Landscape positions dictating crop fertilizer responses in wheat-based farming systems of East African Highlands. Renew. Agric. Food Syst. 2022, 37, 4–16. [Google Scholar] [CrossRef]
  16. Gorfu, D.; Ahmed, E. Crops and agro-ecological zones of Ethiopia. Ethiop. Inst. Agric. Res. 2012, 1, 10–12. [Google Scholar]
  17. Amare, T.; Amede, T.; Abewa, A.; Woubet, A.; Agegnehu, G.; Gumma, M.; Schulz, S. Remediation of acid soils and soil property amelioration via Acacia decurrens-based agroforestry system. Agrofor. Syst. 2022, 96, 329–342. [Google Scholar] [CrossRef]
  18. Mekonnen, Z.; Woldeamanuel, T.; Kassa, H. Socio-ecological vulnerability to climate change/variability in central rift valley, Ethiopia. Adv. Clim. Change 2019, 10, 9–20. [Google Scholar] [CrossRef]
  19. Gashu, D.; Nalivata, P.C.; Amede, T.; Ander, E.L.; Bailey, E.H.; Botoman, L.; Chagumaira, C.; Gameda, S.; Haefele, S.M.; Hailu, K.; et al. The nutritional quality of cereals varies geospatially in Ethiopia and Malawi. Nature 2021, 594, 71–76. [Google Scholar] [CrossRef]
  20. International Board for Plant Genetic Resources. Descriptors for Finger Millet (Eleusine coracana (L.) Gaertn); International Board for Plant Genetic Resources: Rome, Italy, 1985; pp. 20–35. [Google Scholar]
  21. Nevse, G.P.; Chavan, L.S.; Jagtap, D.N. Performance of Finger millet (Eleusine coracana [L.] Gaertn) to age of seedlings, FYM and fertilizer levels. J. Indian Soc. Coast. Agric. Res. 2013, 31, 64–70. [Google Scholar]
  22. Wafula, W.N.; Korir, K.N.; Ojulong, H.F.; Siambi, M.; Gweyi-Onyango, J.P. Finger millet (Eleusine coracana L.) grain yield and yield components as influenced by phosphorus application and variety in Western Kenya. Trop. Plant Res. 2016, 3, 673–680. [Google Scholar] [CrossRef]
  23. Simion, T.; Markos, S.; Samuel, T. Evaluation of finger millet (Eleusine coracana (L). Gaertn.) varieties for grain yield in lowland areas of southern Ethiopia. Cogent Food Agric. 2020, 6, 1788895. [Google Scholar] [CrossRef]
  24. Saha, S.; Chakraborty, M.; Padhan, D.; Saha, B.; Murmu, S.; Batabyal, K.; Seth, A.; Hazra, G.C.; Mandal, B.; Bell, R.W. Agronomic biofortification of zinc in rice: Influence of cultivars and zinc application methods on grain yield and zinc bioavailability. Field Crops Res. 2017, 210, 52–60. [Google Scholar] [CrossRef]
  25. Cui, Y.; Wang, Q. Interaction effect of zinc and elemental sulfur on their uptake by spring wheat. J. Plant Nutr. 2005, 28, 639–649. [Google Scholar] [CrossRef]
  26. Pal, V.; Singh, G.; Dhaliwal, S.S. Agronomic biofortification of chickpea with zinc and iron through application of zinc and urea. Commun. Soil Sci. Plant Anal. 2019, 50, 1864–1877. [Google Scholar] [CrossRef]
  27. Phattarakul, N.; Rerkasem, B.; Li, L.J.; Wu, L.H.; Zou, C.Q.; Ram, H.; Sohu, V.S.; Kang, B.S.; Surek, H.; Kalayci, M.; et al. Biofortification of rice grain with zinc through zinc fertilization in different countries. Plant Soil 2012, 361, 131–141. [Google Scholar] [CrossRef]
  28. Hussain, S.T.; Bhat, M.A.; Hussain, A.; Dar, S.A.; Dar, S.H.; Ganai, M.A.; Telli, N.A. Zinc fertilization for improving grain yield, zinc concentration and uptake in different rice genotypes. J. Pharmacogn. Phytochem. 2018, 7, 287–291. [Google Scholar]
  29. Narwal, R.P.; Malik, R.S.; Dahiya, R.R. Addressing variations in status of a few nutritionally important micronutrients in wheat crop. In Proceedings of the 19th World Congress of Soil Science, Soil Solutions for a Changing World, Brisbane, Australia, 1–6 August 2010; pp. 1–6. [Google Scholar]
  30. Aciksoz, S.B.; Yazici, A.; Ozturk, L.; Cakmak, I. Biofortification of wheat with iron through soil and foliar application of nitrogen and iron fertilizers. Plant Soil 2011, 349, 215–225. [Google Scholar] [CrossRef]
  31. Cakmak, I. Enrichment of fertilizers with zinc: An excellent investment for humanity and crop production in India. J. Trace Elem. Med. Biol. 2009, 23, 281–289. [Google Scholar] [CrossRef]
  32. Cakmak, I.; Kalayci, M.; Kaya, Y.; Torun, A.A.; Aydin, N.; Wang, Y.; Arisoy, Z.; Erdem, H.A.; Yazici, A.; Gokmen, O.; et al. Biofortification and localization of zinc in wheat grain. J. Agric. Food Chem. 2010, 58, 9092–9102. [Google Scholar] [CrossRef]
  33. Cakmak, I. HarvestPlus zinc fertilizer project: HarvestZinc. Better Crops 2012, 96, 17–19. [Google Scholar]
  34. Haileselassie, B.; Stomph, T.J.; Hoffland, E. Teff (Eragrostis tef) production constraints on Vertisols in Ethiopia: Farmers’ perceptions and evaluation of low soil zinc as yield-limiting factor. Soil Sci. Plant Nutr. 2011, 57, 587–596. [Google Scholar] [CrossRef]
  35. Jat, S.L.; Shivay, Y.S.; Parihar, C.M. Dual purpose summer legumes and zinc fertilization for improving productivity and zinc utilization in aromatic hybrid rice (Oryza sativa). Indian J. Agron. 2011, 56, 328–333. [Google Scholar]
  36. Kumar, N.; Salakinkop, S.R. Agronomic biofortification of maize with zinc and iron micronutrients. Mod. Concepts Dev. Agron. 2018, 1, 2–5. [Google Scholar]
  37. Mishra, J.S.; Hariprasanna, K.; Rao, S.S.; Patil, J.V. Biofortification of post-rainy sorghum (Sorghum bicolor) with zinc and iron through fertilization strategy. Indian J. Agric. Sci. 2015, 85, 721–724. [Google Scholar]
  38. Pooniya, V.; Shivay, Y.S. Summer green-manuring crops and zinc fertilization on productivity and economics of basmati rice (Oryza sativa L.). Arch. Agron. Soil Sci. 2012, 58, 593–616. [Google Scholar] [CrossRef]
  39. Prasad, S.K.; Singh, M.K.; Singh, R.E.N.U. Effect of nitrogen and zinc fertilizer on pearl millet (Pennisetum glaucum) under agri-horti system of eastern Uttar Pradesh. Significance 2014, 400, 1–5. [Google Scholar]
  40. Saleem, I.; Javid, S.; Bibi, F.; Ehsan, S.; Niaz, A.; Ahmad, Z.A. Biofortification of maize grain with zinc and iron by using fertilizing approach. J. Agric. Ecol. 2016, 7, 1–6. [Google Scholar] [CrossRef]
  41. Shivay, Y.S.; Kumar, D.; Prasad, R. Effect of zinc-enriched urea on productivity, zinc uptake and efficiency of an aromatic rice–wheat cropping system. Nutr. Cycl. Agroecosyst. 2008, 81, 229–243. [Google Scholar] [CrossRef]
  42. Shivay, Y.S.; Prasad, R.; Rahal, A. Relative efficiency of zinc oxide and zinc sulphate-enriched urea for spring wheat. Nutr. Cycl. Agroecosyst. 2008, 82, 259–264. [Google Scholar] [CrossRef]
  43. Zhang, J.; Wu, L.H.; Wang, M.Y. Iron and zinc biofortification in polished rice and accumulation in rice plant (Oryza sativa L.) as affected by nitrogen fertilization. Acta Agric. Scand. B Soil Plant Sci. 2008, 58, 267–272. [Google Scholar]
  44. Zhang, Y.; Shi, R.; Rezaul, K.M.; Zhang, F.; Zou, C. Iron and zinc concentrations in grain and flour of winter wheat as affected by foliar application. J. Agric. Food Chem. 2010, 58, 12268–12274. [Google Scholar] [CrossRef]
  45. Zou, C.Q.; Zhang, Y.Q.; Rashid, A.; Ram, H.; Savasli, E.; Arisoy, R.Z.; Ortiz-Monasterio, I.; Simunji, S.; Wang, Z.H.; Sohu, V.; et al. Biofortification of wheat with zinc through zinc fertilization in seven countries. Plant Soil 2012, 361, 119–130. [Google Scholar] [CrossRef]
  46. Asrı, F.Ö.; Sönmez, S. Reflection of different application of potassium and iron fertilization on tomato yield and fruit quality in soilless medium. J Food Agric. Environ. 2010, 8, 426–429. [Google Scholar]
  47. Wu, L.B.; Holtkamp, F.; Wairich, A.; Frei, M. Potassium ion channel gene OsAKT1 affects iron translocation in rice plants exposed to iron toxicity. Front. Plant Sci. 2019, 10, 579. [Google Scholar] [CrossRef] [PubMed]
  48. Mahler, R.L. Nutrients Plants Require for Growth; College of Agricultural and Life Science—CIS, University of Idaho: Moscow, ID, USA, 2004; p. 1124. [Google Scholar]
  49. Marschner, H.; Römheld, V.; Kissel, M. Different strategies in higher plants in mobilization and uptake of iron. J. Plant Nutr. 1986, 9, 695–713. [Google Scholar] [CrossRef]
  50. Römheld, V. The role of phytosiderophores in acquisition of iron and other micronutrients in graminaceous species: An ecological approach. Plant Soil 1991, 130, 127–134. [Google Scholar] [CrossRef]
  51. Dotaniya, M.L.; Meena, H.M.; Lata, M.; Kumar, K. Role of phytosiderophores in iron uptake by plants. Agric. Sci. Digest. 2013, 33, 73–76. [Google Scholar]
Figure 1. Map showing the study sites locations in Amhara and Oromia regions of Ethiopia.
Agronomy 13 01452 g001
Figure 2. Effect of fertilizer treatment on yield (kg) of finger millet genotypes at Arsi Negelle as affected by slope position (average data for two seasons). T1: 25 kg ZnSO47H2O, 20 kg FeSO47H2O, 131 kg NPS, 60 kg K, 54 kg urea ha−1; T2: 25 kg ZnSO47H2O, 131 kg NPS, 60 kg K, 54 kg urea ha−1; T3: 131 kg NPS, 60 kg K, 54 kg urea ha−1; T4: 30% of T3; T5: 20 kg FeSO47H2O, 131 kg NPS, 60 kg K, 54 kg urea ha−1.
Agronomy 13 01452 g002
Figure 3. Effect of fertilizer treatment on yield (kg) of finger millet genotypes at Gojjam as affected by slope position. T1: 25 kg ZnSO47H2O, 20 kg FeSO47H2O, 131 kg NPS, 60 kg K, 54 kg urea ha−1; T2: 25 kg ZnSO47H2O, 131 kg NPS, 60 kg K, 54 kg urea ha−1; T3: 131 kg NPS, 60 kg K, 54 kg urea ha−1; T4: 30% of T3.
Agronomy 13 01452 g003
Figure 4. Effect of fertilizer on biomass (quintal) of finger millet genotypes at Arsi Negelle as affected by slope position (average data for two seasons). T1: 25 kg ZnSO47H2O, 20 kg FeSO47H2O, 131 kg NPS, 60 kg K, 54 kg urea ha−1; T2: 25 kg ZnSO47H2O, 131 kg NPS, 60 kg K, 54 kg urea ha−1; T3: 131 kg NPS, 60 kg K, 54 kg urea ha−1; T4: 30% of T3; T5: 20 kg FeSO47H2O, 131 kg NPS, 60 kg K, 54 kg urea ha−1.
Agronomy 13 01452 g004
Figure 5. Biomass (quintal) of finger millet genotypes at Gojjam as affected by zinc and iron fertilization. T1: 25 kg ZnSO47H2O, 20 kg FeSO47H2O, 131 kg NPS, 60 kg K, 54 kg urea ha−1; T2: 25 kg ZnSO47H2O, 131 kg NPS, 60 kg K, 54 kg urea ha−1; T3: 131 kg NPS, 60 kg K, 54 kg urea ha−1; T4: 30% of T3.
Agronomy 13 01452 g005
Table 1. Elemental application of nutrients in kg per hectare.
TreatmentsZnFeNPSK
T15.5432.13.5915.8931.2
T25.5-32.13.597.6431.2
T3--32.13.595.2431.2
T4--9.631.11.579.36
T5-432.13.5913.4931.2
T1: 25 kg ZnSO47H2O, 20 kg FeSO47H2O, 131 kg NPS, 60 kg K, 54 kg urea ha −1; T2: 25 kg ZnSO47H2O, 131 kg NPS, 60 kg K, 54 kg urea ha −1; T3: 131 kg NPS, 60 kg K, 54 kg urea ha −1; T4: 30% of T3; T5: 20 kg FeSO47H2O, 131 kg NPS, 60 kg K, 54 kg urea ha −1.
Table 2. Mineral concentrations (mg kg−1) of soil from the finger millet agronomic biofortification experimental sites in Ethiopia.
LocationSlopeBMgPSKCaFeZn
Arsi NegelleFoot3.9 ± 0.79 A2052 ± 472061 ± 49122.7 ± 0.43227 ± 185 A4662 ± 481 A26918 ± 1149 A89 ± 7
Hill3.0 ± 0.70 B1728 ± 2401725 ± 240105.8 ± 7.32729 ± 448 B4050 ± 918 B23952 ± 1804 B105 ± 10
Mean3.4 ± 0.95 a1890 ± 259 a1893 ± 264 a114.3 ± 10.3 a2978 ± 464 a4356 ± 870 a25435 ± 2320 a97 ± 13 a
GojjamFoot1.0 ± 0.37 C1731 ± 1311731 ± 131136.6 ± 6 C934 ± 33 C1185 ± 149 C107973 ± 3372 C81 ± 4
Hill0.1 ± 0.08 D1597 ± 1671597 ± 167207.1 ± 42.8 D859 ± 85 D1668 ± 430 D124304 ± 5913 D104 ± 11
Mean0.55 ± 0.5 b1664 ± 180 a1664 ± 180 a171.8 ± 47.3 b897 ± 82 b1426 ± 440 b116138 ± 10383 b92 ± 16 a
Note: Results labelled with different small letters are significantly different for location and those with different capital letters are significantly different for slope at the 0.05 probability level.
Table 3. Effect of fertilizer treatment on yield traits of finger millet genotypes at Arsi Negelle as affected by slope position.
Foot SlopeHill Slope
GenotypeFertilizerTotal Tiller NumberProductive Tiller NumberFinger No/Main EarPlant Height (cm)Finger Length (cm)Total Tiller NumberProductive Tiller NumberFinger No/Main EarPlant Height (cm)Finger Length (cm)
Diga-01T14.58 ± 1.884.4 ± 1.96.0 ± 1.468.6 ± 14.28.0 ± 1.64.8 ± 1.74.5 ± 1.75.8 ± 1.854.3 ± 8.87.3 ± 1.3
T24.54 ± 1.494.1 ± 1.36.5 + 271.8 ± 21.67.6 ± 1.55.1 ± 1.54.7 ± 1.75.8 ± 1.456.9 ± 7.67.4 ± 1.3
T34.46 ± 1.724.2 ± 1.66.4 ± 1.770.8 ± 16.28.1 ± 1.75.0 ± 1.94.7 ± 1.75.4 ± 1.457.2 ± 7.77.3 ± 1.3
T45.63 ± 2.225.4 ± 2.26.3 ± 1.657.2 ± 127.6 ± 1.34.5 ± 1.44.2 ± 1.25.2 ± 1.149.9 ± 7.37.6 ± 1.3
T55.5 ± 1.95.0 ± 1.66.0 ± 2.458.1 ± 8.88.0 ± 1.55.2 ± 24.8 ± 1.94.4 ± 0.854.4 ± 7.67.2 ± 1.4
UrjiT14.38 ± 1.583.9 ± 1.67.1 ± 2.264.6 ± 16.47.7 ± 1.44.9 ± 1.94.1 ± 1.57.3 ± 1.852.1 ± 7.27.9 ± 1
T24.86 ± 1.744.3 ± 1.57.9 ± 1.865.6 ± 18.28.3 ± 1.54.9 ± 2.34.3 ± 1.77.4 ± 1.851.8 ± 8.37.6 ± 1.4
T34.81 ± 1.96 4.3 ± 27.6 ± 1.664.8 ± 13.47.9 ± 1.75.4 ± 2 4.5 ± 1.47.2 ± 1.953.0 ± 8.37.4 ± 1.3
T45.6 ± 2.95.2 ± 2.87.8 ± 1.556.2 ± 13.78.3 ± 1.75.6 ± 2.64.9 ± 2.57.0 ± 1.647.1 ± 6.86.6 ± 1.2
T55.0 ± 2.24.1 ± 1.96.7 ± 1.349.0 ± 9.77.5 ± 25.4 ± 34 ± 1.86.8 ± 1.848.4 ± 7.96.8 ± 1.7
MebaT14.94 ± 2.24.1 ± 1.65.8 ± 1.363.5 ± 12.85.8 ± 1.15.3 ± 24.5 ± 1.65.7 ± 1.756.0 ± 7.35.4 ± 1.1
T25.35 ± 2.84.5 ± 1.66.1 ± 1.665.7 ± 116.2 ± 1.35.2 ± 1.94.3 ± 1.65.6 ± 1.253.6 ± 95.7 ± 0.9
T35.06 ± 1.664.5 ± 1.56.2 ± 1.164.0 ± 17.15.8 ± 1.15.2 ± 1.94.1 ± 1.65.6 ± 1.253.3 ± 8.65.6 ± 1.1
T45.0 ± 2.24.7 ± 2.16.0 ± 1.456.8 ± 12.75.7 ± 1.15.9 ± 2.44.6 ± 1.95.9 ± 1.447.0 ± 8.95.2 ± 0.8
T54.7 ± 1.44.0 ± 15.6 ± 1.3 50.4 ± 6.95.3 ± 0.87.2 ± 25.8 ± 2.15.9 ± 1.244.8 ± 12.55.4 ± 0.9
Table 4. Effect of fertilizer treatment on yield traits of finger millet genotypes at Gojjam as affected by slope position.
Foot SlopeHill Slope
GenotypeFertilizerTotal Tiller NumberProductive Tiller NumberFinger No/Main EarPlant Height (cm)Finger Length (cm)Total Tiller NumberProductive Tiller NumberFinger No/Main EarPlant Height (cm)Finger Length (cm)
Diga-01T11.35 ± 0.61.31 ± 0.66.1 ± 1.565.1 ± 17.19.8 ± 1.61.56 ± 0.71.45 ± 0.75.7 ± 146.5 ± 69.2 ± 1.1
T21.41 ± 0.81.34 ± 0.85.3 ± 1.261.3 ± 12.99.6 ± 1.91.83 ± 0.91.77 ± 0.95.2 ± 0.844.2 ± 79.5 ± 1.9
T31.38 ± 0.61.31 ± 0.65.8 ± 1.266.2 ± 9.19.8 ± 1.51.45 ± 0.71.39 ± 0.75.2 ± 1.244.0 ± 6.98.8 ± 1.1
T41.36 ± 0.41.29 ± 0.45.1 ± 0.957.4 ± 10.89.7 ± 1.91.44 ± 0.61.35 ± 0.64.8 ± 142.3 ± 10.47.7 ± 1.4
UrjiT11.29 ± 0.51.22 ± 0.57.3 ± 2.166.0 ± 15.29.9 ± 2.11.77 ± 0.81.67 ± 0.87.4 ± 1.148.4 ± 7.29.9 ± 1.7
T21.38 ± 0.61.27 ± 0.68.1 ± 1.877.4 ± 19.110.4 ± 1.72.2 ± 1.81.98 ± 1.87.2 ± 0.949.9 ± 510.1 ± 1.4
T31.41 ± 0.81.35 ± 0.87.6 ± 1.770.5 ± 13.510.0 ± 1.91.56 ± 0.81.45 ± 0.86.6 ± 1.747.5 ± 8.19.5 ± 1.1
T41.34 ± 0.51.28 ± 0.56.1 ± 1.952.4 ± 18.29.0 ± 1.81.9 ± 1.21.85 ± 1.26.2 ± 1.842.4 ± 9.68.8 ± 1.3
MebaT11.24 ± 0.51.17 ± 0.54.8 ± 0.870.3 ± 7.97.6 ± 1.41.74 ± 11.67 ± 14.7 ± 0.760.1 ± 7.67.5 ± 1.6
T21.33 ± 0.61.25 ± 0.64.9 ± 169.0 ± 11.78.2 ± 1.41.55 ± 0.61.45 ± 0.64.7 ± 1.252.0 ± 9.96.7 ± 2.2
T31.42 ± 0.71.37 ± 0.74.8 ± 170.4 ± 11.17.5 ± 1.51.5 ± 0.91.5 ± 0.95.0 ± 1.257.3 ± 9.27.4 ± 2
T41.44 ± 0.71.38 ± 0.74.7 ± 1.560.3 ± 117.2 ± 1.31.8 ± 1.21.8 ± 1.24.2 ± 1.151.3 ± 9.26.9 ± 1.6
Table 5. Effect of fertilizer treatment, genotype and slope position on finger millet yield.
Sum SqMean SqNumDFDenDFF ValuePr(>F)
Slope position0.7870.78713.0059.02600.05734 #
Fertilizer7.21681.80424274.96620.69096.382 × 10−15 ***
Genotype10.30135.15062274.49159.0686<2.2 × 10⁻¹⁶ ***
Fertilizer:genotype0.85880.10738275.9931.23110.2807
Significance codes: *** <0.001; # < 0.1.
Table 6. Effect of fertilizer treatment, genotype and slope position on finger millet biomass.
Sum SqMean SqNumDFDenDFF ValuePr(>F)
Slope position1.12581.125813.00413.58850.03453 *
Fertilizer13.88913.47234274.51641.9113<2 × 10⁻¹⁶ ***
Genotype0.53670.26842274.0363.23920.0407 *
Fertilizer:genotype0.73990.09258274.8731.11630.3522
Significance codes: *** <0.001; *< 0.05.
Disclaimer/Publisher’s Note: The statements, opinions and data contained in all publications are solely those of the individual author(s) and contributor(s) and not of MDPI and/or the editor(s). MDPI and/or the editor(s) disclaim responsibility for any injury to people or property resulting from any ideas, methods, instructions or products referred to in the content.

