The Impact of Divalent Cations on the Enrichment of Soluble Saccharides in Primary Sea Spray Aerosol
by

Steven R. Schill
1,2, 
Susannah M. Burrows
3,
Elias S. Hasenecz
4,
Elizabeth A. Stone
4 and
Timothy H. Bertram
2,* 1
Department of Chemistry and Biochemistry, University of California San Diego, La Jolla, CA 92093, USA
2
Department of Chemistry, University of Wisconsin Madison, Madison, WI 53706, USA
3
Atmospheric Sciences & Global Change Division, Pacific Northwest National Laboratory, Richland, WA 99354, USA
4
Department of Chemistry, University of Iowa, Iowa City, IA 52242, USA
*
Author to whom correspondence should be addressed.
Atmosphere 2018, 9(12), 476; https://doi.org/10.3390/atmos9120476
Submission received: 31 October 2018
/
Revised: 26 November 2018
/
Accepted: 1 December 2018
/
Published: 4 December 2018
(This article belongs to the Special Issue Ocean Contributions to the Marine Boundary Layer Aerosol Budget)
Abstract
:Field measurements have shown that sub-micrometer sea spray aerosol (SSA) is significantly enriched in organic material, of which a large fraction has been attributed to soluble saccharides. Existing mechanistic models of SSA production struggle to replicate the observed enhancement of soluble organic material. Here, we assess the role for divalent cation mediated co-adsorption of charged surfactants and saccharides in the enrichment of soluble organic material in SSA. Using measurements of particle supersaturated hygroscopicity, we calculate organic volume fractions for molecular mimics of SSA generated from a Marine Aerosol Reference Tank. Large enhancements in SSA organic volume fractions (Xorg > 0.2) were observed for 50 nm dry diameter (dp) particles in experiments where cooperative ionic interactions were favorable (e.g., palmitic acid, Mg2+, and glucuronic acid) at seawater total organic carbon concentrations (<1.15 mM C) and ocean pH. Significantly smaller SSA organic volume fractions (Xorg < 1.5 × 10⁻³) were derived from direct measurements of soluble saccharide concentrations in collected SSA with dry diameters <250 nm, suggesting that organic enrichment is strongly size dependent. The results presented here indicate that divalent cation mediated co-adsorption of soluble organics to insoluble surfactants at the ocean surface may contribute to the enrichment of soluble saccharides in SSA. The extent to which this mechanism explains the observed enhancement of saccharides in nascent SSA depends strongly on the concentration, speciation, and charge of surfactants and saccharides in the sea surface microlayer.
1. Introduction
Oceans cover more than 70% of Earth’s surface and serve as a major source of natural aerosol particles resulting from wave breaking processes. Sea spray aerosol (SSA) are important drivers for global climate and regional atmospheric chemistry as they directly scatter incoming solar radiation [1], serve as cloud condensation [2,3] and ice nuclei [4,5,6] (CCN and IN), and provide interfaces for chemical reactions [7,8]. Each of these processes depends on SSA chemical composition, size, morphology, and phase. Previous laboratory and field investigations have shown that the chemical composition of SSA is a complex function of chemical [9,10,11,12] and biological processes occurring in the surface ocean [10,13,14,15,16,17]. SSA chemical composition is also dependent on the physics of wave breaking, which determines the distribution of organic material at the air-sea interface and how it is transported from the ocean surface into aerosol particles [10,18,19,20].
In contrast to the high seawater salt concentrations (475 mM Cl−) [19,21,22,23,24], the total organic carbon concentration of seawater is routinely less than 100 μM C [12,25,26,27,28,29,30], rising to several hundred μM C during intense phytoplankton blooms [11,19,25,31,32,33]. It has been shown that SSA are highly enriched in organic material [15,21,34], where submicron SSA organic mass fractions can exceed 0.9 during bloom periods [15], and the organic species are often water soluble [19,35,36,37]. For example, saccharides comprise 7–20% of organic aerosol mass in ambient aerosol collected over the Northeast Pacific Ocean [38], and a substantial saccharide-like, ocean-derived organic signature was shown to account for 68% of the submicron aerosol organic mass of ambient aerosol filter samples collected over the North Atlantic Ocean [35]. Similar results have been shown for particles collected over the Southeast Pacific Ocean and at coastal sites in northern Alaska (Barrow) and Northeastern North America (Appledore Island and Chebogue Point) [35]. In a recent laboratory study, where aerosols were generated in a wave channel [14], saccharides (primarily polysaccharides) accounted for 11% of the fine (PM2.5) aerosol organic mass [19]. These values are in good agreement with the ambient measurements of clean marine aerosol by Russell et al. [35,39].
A wide range of saccharides have been identified in the ocean, including dissolved free monosaccharides, polysaccharides, sugar alcohols, and monosaccharide anhydrates [40,41,42], with varying composition dependent on marine biological activity [43,44,45,46,47]. These saccharides account for approximately 20% of dissolved organic carbon (DOC), with polysaccharides as the dominant form (71% of total saccharides) near the ocean surface, and monosaccharides more prevalent in the deep ocean [48,49]. Most analytical techniques used to detect saccharides do not account for charged compounds such as uronic acids, so these values are typically treated as lower limits. The relative abundance of charged saccharides is thought to be smaller than that of the free monosaccharides [50,51,52]. Moreover, of particular interest to this study, divalent metal cations have been shown to link organic material and form gel particles [44].
There is increasing evidence that many marine polysaccharides are surface-active [52,53] and may play an important role in bubble bursting at the ocean surface [54] and the resulting SSA composition [35,36,37]. For example, Frossard et al. [37] used the location of the hydroxyl group infrared absorption peak in the FTIR analysis of collected atmospheric marine aerosol to deduce the contribution of monosaccharides and disaccharides relative to polysaccharides in SSA. They found that SSA generated from biologically productive ocean water was more strongly characterized by monosaccharides and disaccharides, whereas seawater more closely resembled polysaccharides. This suggests that larger saccharides may preferentially stay in seawater during aerosol production, leading to an outsized impact of monosaccharides and disaccharides on the composition of SSA relative to their concentrations in the bulk and surface water.
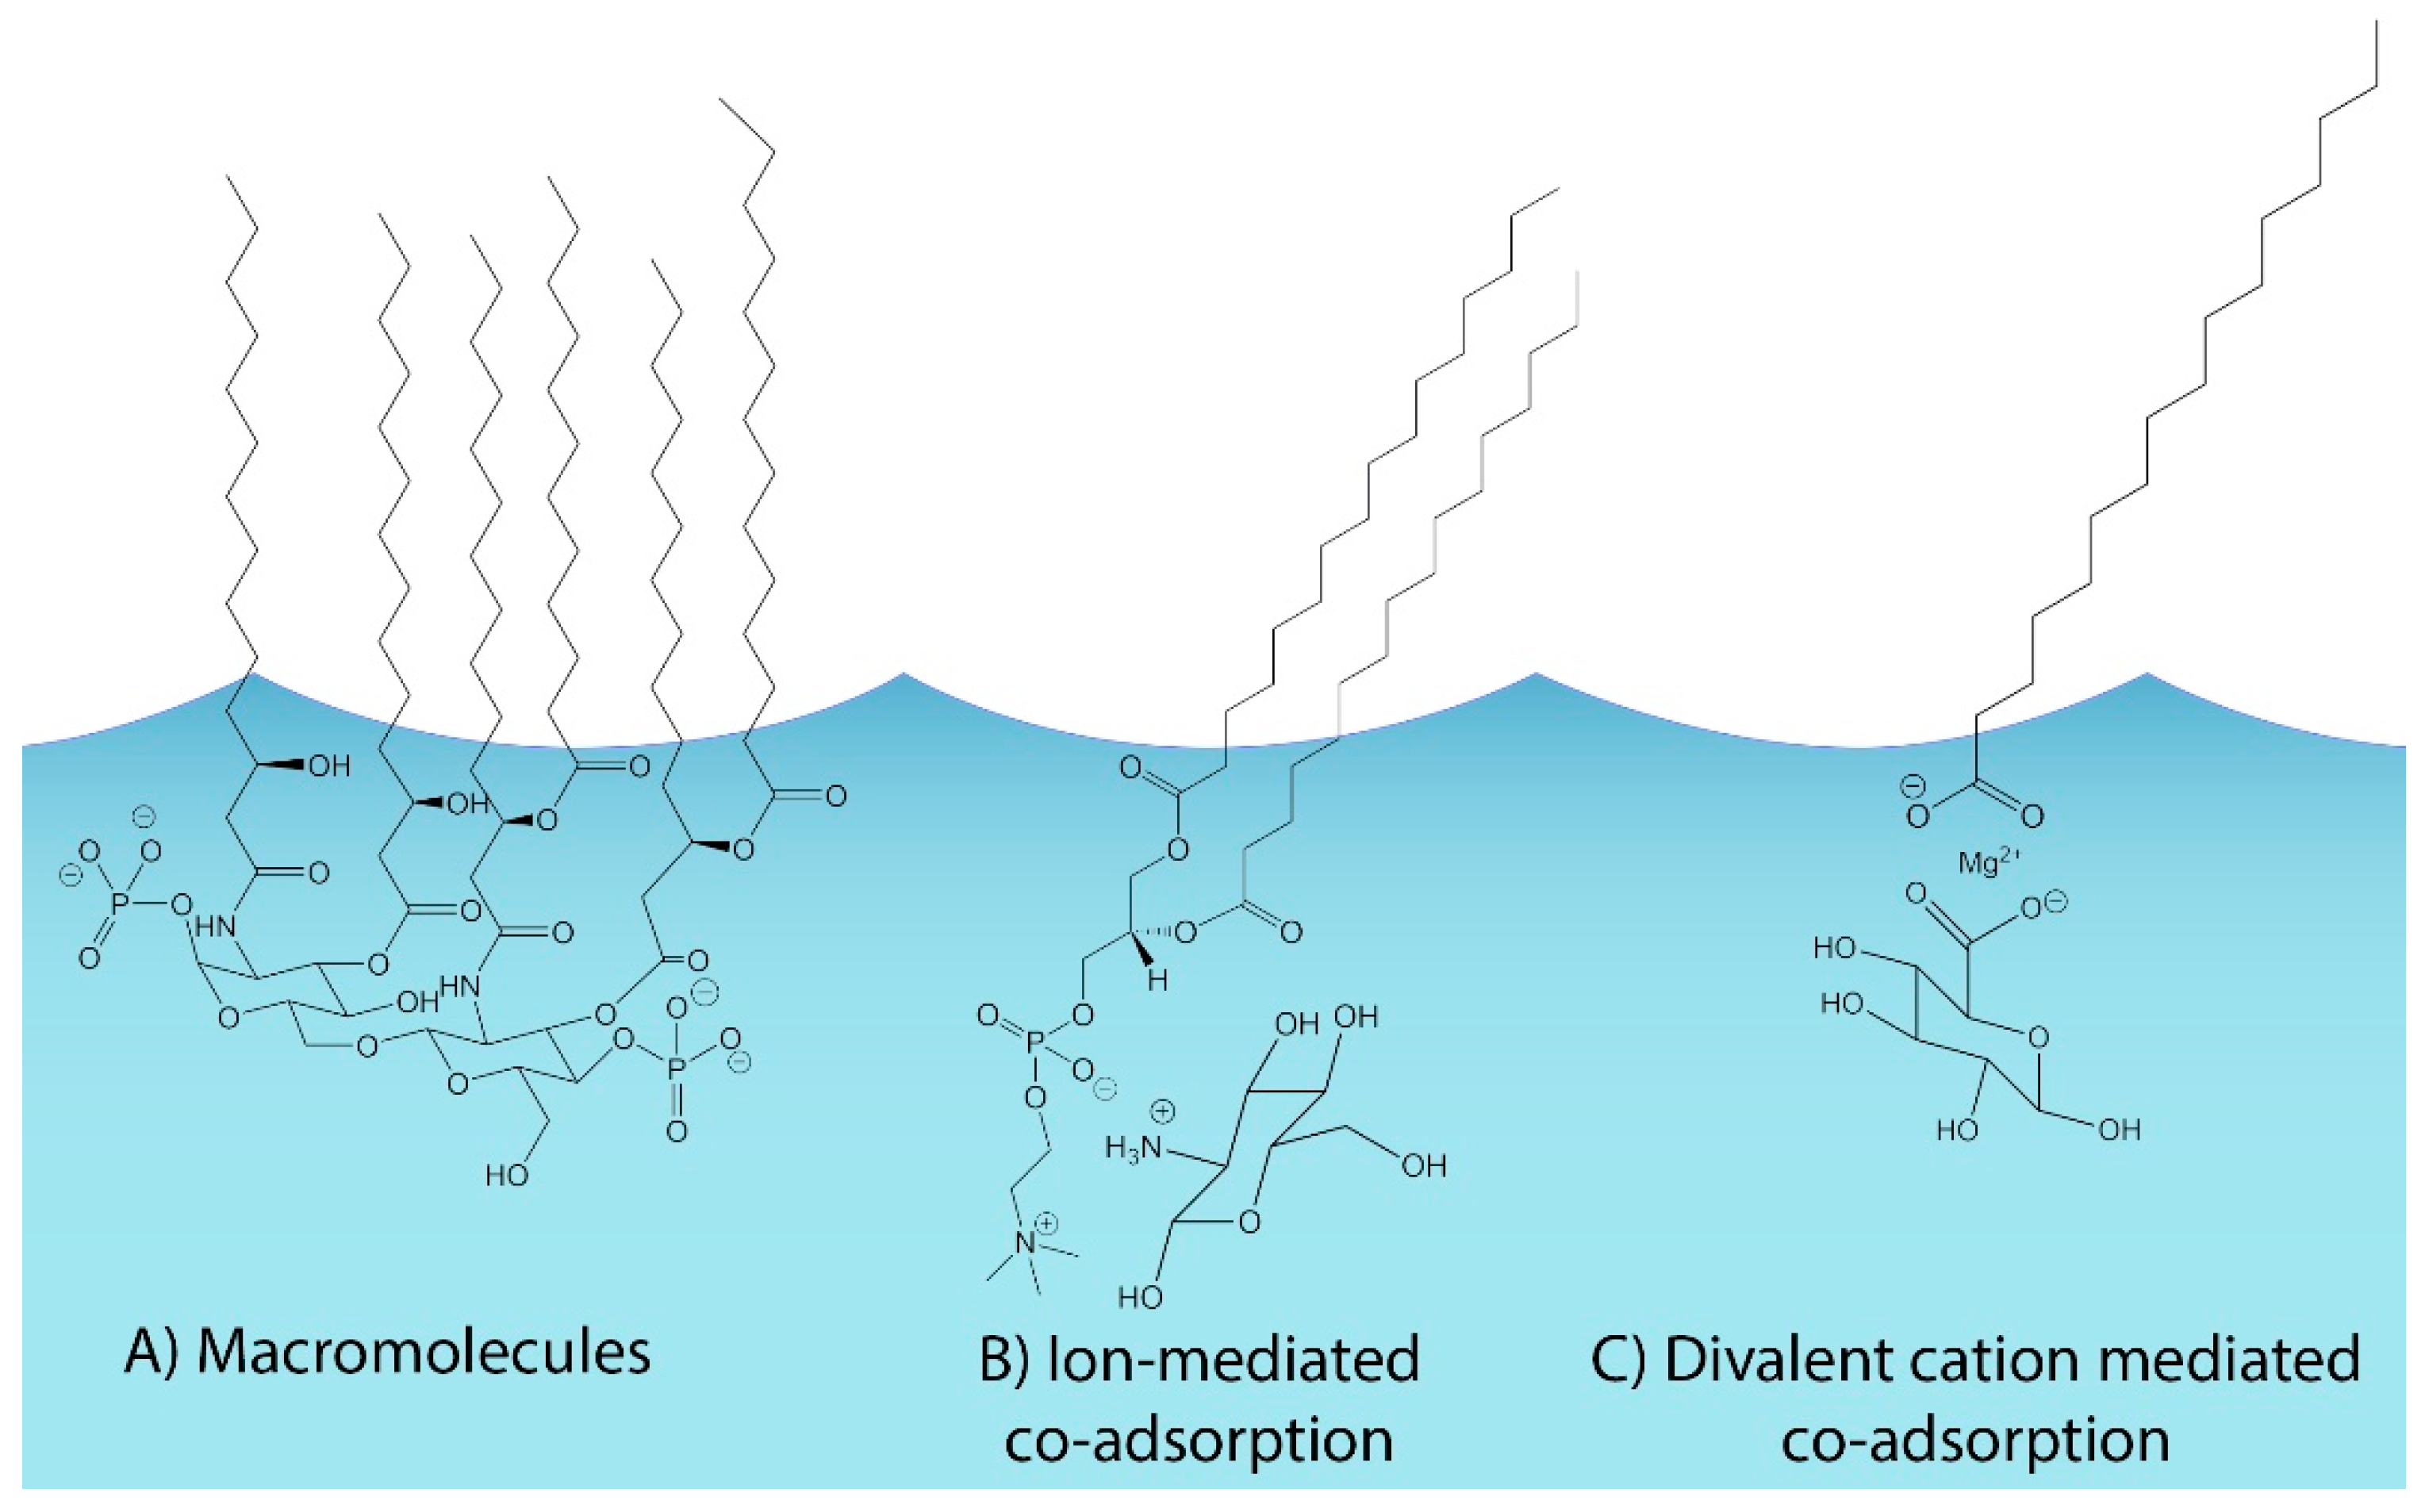
Despite growing evidence for the role of soluble saccharides in SSA, current mechanistic models of SSA production (e.g., Burrows et al., 2014) cannot replicate the observed enhancement in highly soluble organic material. It is commonly assumed that the distribution of organic compounds within the sea surface microlayer (SSML) is driven by solubility and surface activity, where insoluble organics are concentrated at the air-sea interface and soluble organic species, such as biologically-derived saccharides, are more evenly distributed through the SSML. One idea for explaining the observed enrichment of soluble organics in SSA is that they are covalently bonded to lipid head groups, such as in lipopolysaccharides (LPS). Chemical processing and/or enzymatic breakdown of a compound such as LPS in SSA would result in an observed enrichment of soluble saccharides in SSA, as illustrated in Figure 1A. This mechanism would also be expected to produce high concentrations of phosphate groups in SSA, which have been observed for bubble-bursting processes in surface waters [54] and in SSA [55].
It has also been suggested that the enrichment of water-soluble organics in SSA is due to the enrichment of surface-active material in the SSML, as well as on bubble surfaces. Burrows et al. [56] used a Langmuir adsorption equilibrium model to describe the interactions of compounds in the bulk ocean with the surfaces of bubbles entrained into the water column by wave breaking events. This approach replicates the seasonal and geographic variability in aerosol organic mass, but routinely underestimates observations of organic mass fractions (OMF) over a wide range of chlorophyll concentrations [56]. To account for this, a second model iteration [57] considered the possibility of ionic interactions between the insoluble and soluble organics, and a second layer of co-operatively adsorbed soluble saccharides was added to the original layer of insoluble organics in the model SSML (Figure 1B). The addition of the co-adsorption mechanism increases model-derived SSA organic mass fractions [57], leading to better agreement with ambient observations. To assess the validity of this idea, a series of sum-frequency generation (SFG) experiments with dipalmitoylphosphatidylcholine (DPPC, pKa = 3.8 [58,59]) and glucosamine (pKa = 7.58 [60]) were conducted. These experiments showed that glucosamine altered the surface structure of the DPPC monolayer, and that the Langmuir isotherm adequately described the magnitude of this effect. These results confirmed that the proposed mechanism relying on ionic interactions to bind compounds with varying solubility at the ocean surface was feasible, but it is important to note that because the pKa of the saccharide ultimately determines the extent of ionization, these experiments were conducted at a pH much lower (pH = 5.5) than that of the ocean (pH = 8.1) [61] to ensure complete ionization of glucosamine. This mechanism is most relevant to saccharide compounds that readily ionize at ocean pH, which significantly decreases the scope of compounds that will participate.
In this manuscript, we test the role that divalent cations play in mediating the transfer of soluble saccharides to SSA (Figure 1C). This work extends the concept of ionically-mediated co-operative adsorption of soluble saccharides to a largely insoluble SSML at the surface of a synthetic ocean matrix, with model compounds appropriate to ocean-relevant pH that have been observed previously [62]. Palmitic acid (pKa = 8.6–8.8 [63]) and glucuronic acid (pKa = 2.93 [64]) were chosen as proxies for the insoluble surfactant and soluble saccharide, respectively. It is important to note that the presence of salt ions in solution has been shown to interact with the carboxylic acid head group of fatty acids [65,66] which decreases the effective pKa. For this reason, both compounds used in this study were expected to form anions in solution at pH 8, and we hypothesized that divalent metal cations play a critical role, by acting as an ionic bridge between insoluble and soluble organic molecules that is necessary for the transfer of soluble saccharides to the SSA.
2. Experiments
2.1. Generation of Synthetic Sea Spray Aerosol
Synthetic sea spray experiments were conducted using a Marine Aerosol Reference Tank (MART) system, which has been described previously [67,68]. Briefly, the MART consists of a plexiglass tank filled with 120 L of artificial seawater. A centrifugal pump periodically circulates water from the bottom of the tank to a top-mounted spillway, creating a plunging sheet of water that impinges on the seawater surface and generates synthetic SSA emissions. The generation process produces particle size distributions that are similar to those produced from wave breaking in a wave channel, and is therefore thought to be analogous to wave breaking in the ocean [67]. Nitrogen was used both as a carrier gas and for dilution due to the high concentrations (Np > 20,000 cm−1) of SSA generated with this technique.
Each experiment consisted of two sequential additions to a synthetic ocean matrix: (i) a soluble organic proxy (e.g., saccharide), and (ii) an insoluble surfactant proxy (e.g., surfactant). The specific compounds added to the MART and their concentration following addition are listed in Table 1. Artificial seawater was generated from Milli-Q water (EMD Millipore, Burlington, MA, USA; PN Z00QSV001) and reagent grade salts including sodium chloride (Sigma-Aldrich, St. Louis, MO, USA; PN S9888), magnesium chloride hexahydrate (Sigma-Aldrich, M9272), and calcium chloride dihydrate (Sigma-Aldrich, 223506). The soluble organic proxy was then added to the MART, as either glucose (C6H12O6; Sigma-Aldrich D9434, pKa = 12.28 [69]) or glucuronic acid (C6H10O7/C6H9O7−; Sigma-Aldrich G5269; pKa = 2.93 [64]), selected for their similar saccharide backbones but dissimilar ionic properties. Lastly, palmitic acid (C16H32O2; Sigma-Aldrich P0500, pKa = 8.6–8.8 [63]) was added to each experimental matrix as a proxy for an insoluble surfactant. Due to the low solubility of palmitic acid, it was dissolved in chloroform and spread on the surface of the MART as in Tang et al. [65]. Trace chloroform promptly evaporated from the surface and did not impact the experiments discussed here. Moreover, sufficient palmitic acid was added to generate a monolayer across the entire surface of the MART. The concentration of salts and organic compounds added to the MART were precise to within 2% and 4% by mass, respectively. After each addition, aerosols were generated in the MART, where continuous measurements of particle hygroscopicity were made for 8 h, followed by 16 h of particle filter sampling for offline chemical analysis.
2.2. Determination of Aerosol Supersaturated Hygroscopicity
In this study, we use determinations of aerosol supersaturated hygroscopicity as a high-throughput, online analysis technique for detecting changes in particle composition; specifically, the enrichment of soluble organics in SSA generated from a synthetic ocean matrix. Direct measurements of soluble organic enrichment for SSA at sizes relevant to cloud formation (dp < 200 nm) is difficult as most techniques require large amounts of aerosol mass to provide quantitative results. For example, the required sampling time to generate sufficient aerosol mass (dp < 200 nm) to exceed method detection limits is on the order of 8–12 h for the MART aerosol generation system described here [67,68]. In comparison, measurements of size resolved supersaturated particle hygroscopicity are intimately linked to chemical composition [70] and provide a high throughput technique for observing changes in particle composition in real time. Supersaturated hygroscopicity is a function of solubility, molecular weight, and surface tension, with strong differentiation occurring between the broad classes of inorganic, soluble salts (more hygroscopic), and insoluble organic compounds (less hygroscopic) [71]. As such, this technique is well suited for investigating changes in organic and inorganic volume fraction for particles generated from two-component mixtures.
Cloud condensation nuclei (CCN) activation efficiency fCCN(s), i.e., the fraction of particles of a given size that grow into droplets when exposed to a specific water supersaturation (s), was measured for all SSA particles generated from the MART and model aerosol generated by a constant output atomizer (TSI, Shoreview, MN, USA, Model 3076). Measurements of fCCN(s) were made using a size-resolved cloud condensation nuclei (SR-CCN) system, consisting of three stages: (i) aerosol particle generation, (ii) size selection, and (iii) measurement of CCN active fraction. The aerosol sources have been described in detail above. Monodisperse particles were selected from the polydisperse distribution according to their mobility diameters using a differential mobility analyzer (DMA; TSI Inc, Shoreview, MN, USA, Model 3071) with a sheath:sample flow rate ratio of 10:1. The resulting aerosol stream was subsequently split between a condensation particle counter (CPC; TSI Inc, Shoreview, MN, USA, Model 3787) measuring total aerosol count, and a CCN counter (CCNc; Droplet Measurement Technologies (DMT), Boulder, CO, USA, Model CCN-100) counting cloud active aerosols as a function of supersaturation. The CCN active fraction (fCCN) was measured as a function of supersaturation to generate CCN activation efficiency spectra (fCCN(s)). From these spectra, measurements of a selected particle diameter (dp) and the critical supersaturation at which 50% of the particle population has activated (scrit) are converted to a single hygroscopicity parameter, κ [72].
Hygroscopicity factors (κ) for the pure compounds used in this study were determined by aerosolizing compounds using a constant output atomizer (TSI Inc, Shoreview, MN, USA, Model 3076). Nitrogen was used as an inert carrier gas to generate and transport aerosol particles from aqueous stock solutions, through silica gel diffusion dryers, and to a cloud condensation nuclei counter instrument (Droplet Measurement Technologies (DMT), Boulder, CO, USA, Model CCN-100) paired with size selection and operated in scanning supersaturation mode. Each solution was less than 1 L in volume, and the dissolved concentration of each solution was selected so that monodisperse particle number concentrations were approximately 200–1000 cm−1.
In general, changes in κ over the course of each experiment can be attributed to deviations in the chemical composition of aerosols generated from each matrix. For internally-mixed aerosol populations where each particle is a homogeneous mixture with the same representative composition, κ-Köhler theory (using the ZSR-mixing rule) [73] predicts that the observed κ-value will be a combination of the pure κ-values, weighted by the volume fractions of the individual components [72]. Observed κ-values from the sequential addition experiments were constrained by measured κ-values for the pure components to estimate the volume fractions of organics in the generated SSA.
2.3. Ion Exchange Chromatography Analysis
Aerosols were generated from the sequential addition experiments using the MART system, and particles < 250 nm in diameter, the minimum size cut selected for best consistency with the 50 nm particles analyzed with the SR-CCN, were deposited onto a quartz fiber filter for offline analysis using a Sioutas Personal Cascade Impactor (PCIS; SKC Ltd, Dorset, UK, Model 225-370). Particle-free, inert, low humidity (RH < 15%) room air from a zero-air generator (ZAG, Sabio, Round Rock, TX, USA, Model 1001) was used for dilution during PCIS sample collection, which was performed at a flow rate of 9 slpm. Samples were stored frozen and later extracted into ultra-pure water (Thermo, BARNSTED EasyPure-II; 18.2 MΩ resistivity) from whole 37 mm quartz fiber filters for analysis via ion exchange chromatography [19]. An aqueous extraction proved sufficient for all samples, which were filtered prior to analysis (WhatmanPuradisc 25 mm syringe filters).
Aqueous extractions were analyzed by ion exchange chromatography (Dionex-ICS5000). For saccharide analysis, a Dionex CarboPac PA20 column was used. For glucose, the mobile phase consisted initially of 200 mM sodium hydroxide (NaOH) with a gradient up to 450 mM NaOH from 7 to 10 min. For glucuronic acid, an isocratic mobile phase of 190 mM NaOH and 190 mM sodium acetate was used. In both cases, the flow rate was 0.48 mL min−1. An electrochemical detector (Thermo) was used for detection. Saccharides were quantified against self-prepared seven-point calibration curves of glucose (Sigma) and glucuronic acid (Alpha Aesar). For anion analysis, a Dionex IonPac AS22 anion column was used. The mobile phase consisted of 4.5 mM sodium carbonate (Na2CO3) and 1.4 mM sodium bicarbonate (NaHCO3) at a flow rate of 1.2 mL min−1. For cation analysis, a Dionex IonPac CS12A cation column was used. The mobile phase consisted of 20 mM methanesulfonic acid and flowed at 0.5 mL min−1. A conductivity detector (Thermo) was used for detection and was preceded by a self-regenerating suppressor (AERS 500 for anions and CERS 500 for cations). Anions and cations were identified against authentic standards (Dionex) and quantified with seven-point calibration curves. All the reported ambient concentrations (nmol/sccm) correspond to ambient temperature and pressure and have been field blank subtracted. Air volumes were calculated from the average of initial and final flow rates and total sampling time of the PCIS.
3. Results
3.1. Supersaturated Hygroscopicity of Pure SSA Mimics
The chemical composition of SSA particles composed of a two-component mixture of known compounds can be inferred from the κ-values of the pure compounds using the κ volume-mixing rule. There are limited studies of κ-value measurements for SSA organic mimics [68,74,75]. Although some studies have characterized the kinetic limitations of water uptake of saccharides [76,77], to our knowledge the κ-values reported here are the first reported measurements of κ for glucose and glucuronic acid. We determined κ for glucose to be 0.272 ± 0.005 and κ for glucuronic acid to be 0.244 ± 0.006. These values represent the mean ± standard deviation (1σ) for triplicate measurements. Given that palmitic acid is effectively insoluble in water, we take the κ-value for palmitic acid to be effectively 0, based on the work of Petters and Kreidenweiss [72]. At present, it is not clear what the κ-value for the proposed palmitate-Mg2+-glucuronic acid complex should be. As a first order assumption, we assume it to be the linear combination of the two organic constituents in the analysis that follows.
3.2. Supersaturated Hygroscopicity of MART Generated SSA
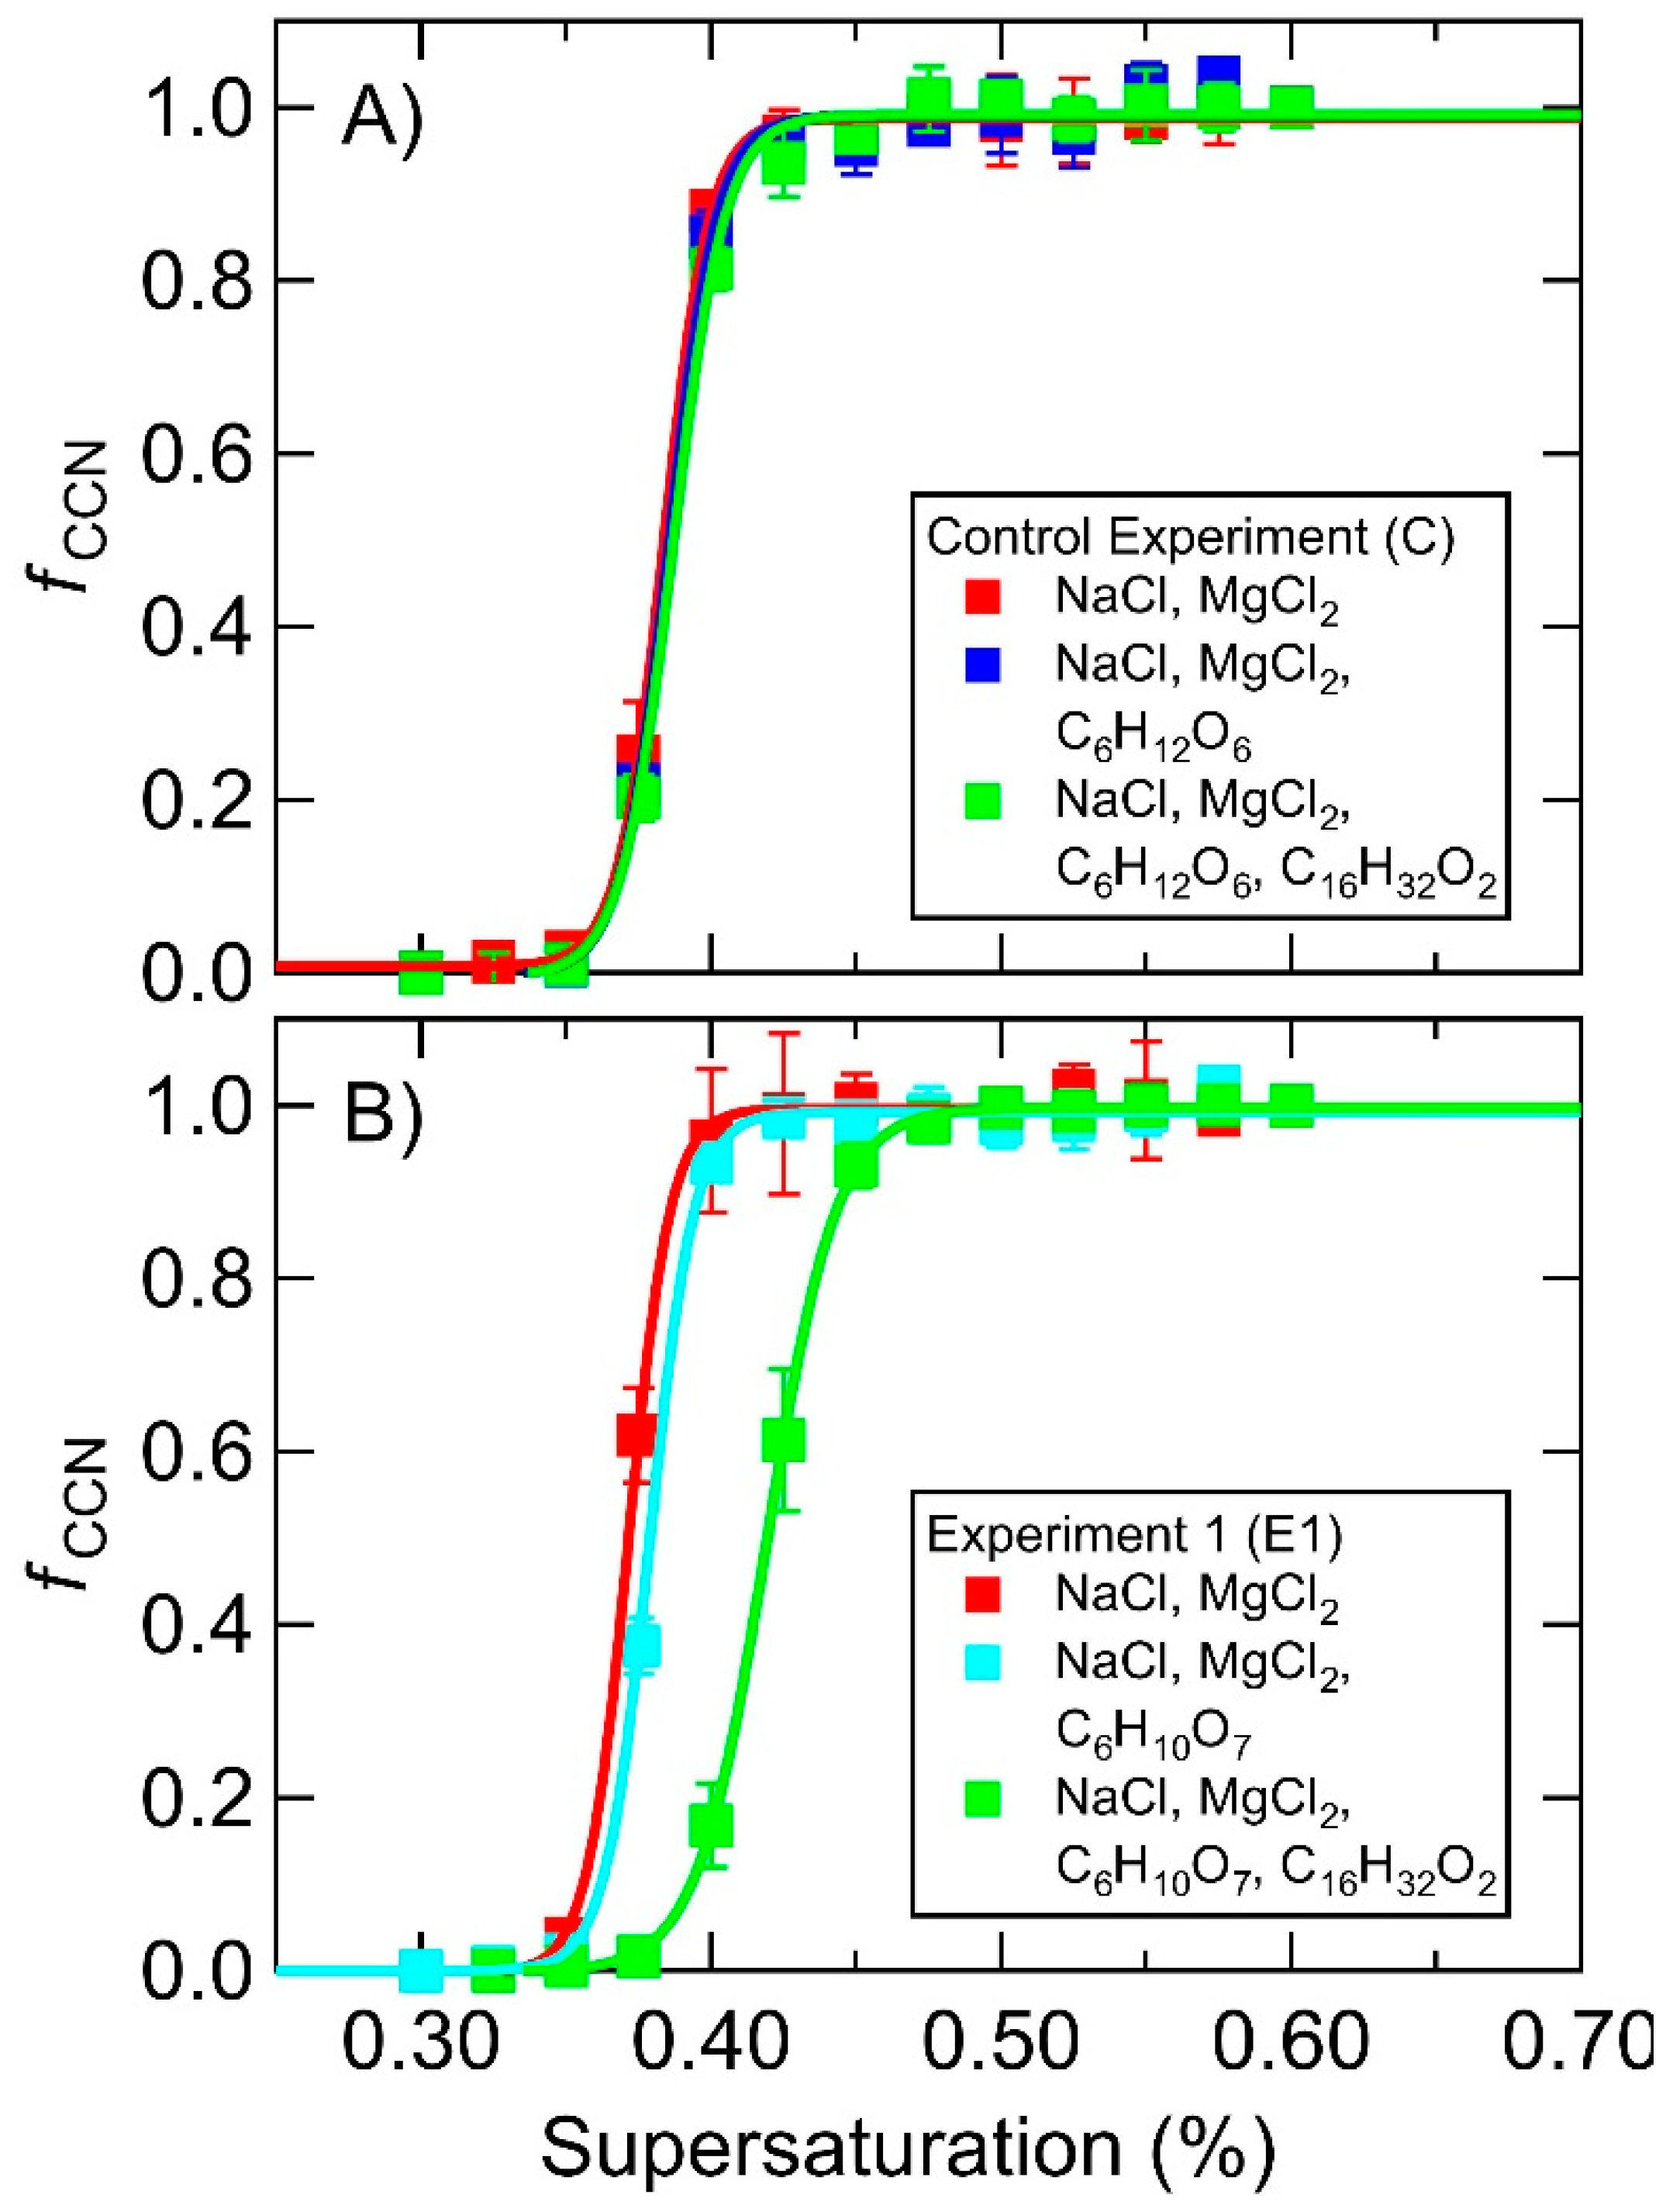
In each MART experiment the starting synthetic ocean consisted only of sea salts and the measured κ-values were in excess of 0.75. The starting κ-values for each experiment varied slightly due to small deviations in the relative concentrations of salts. Each experiment consisted of the sequential addition of a soluble organic (e.g., glucose) followed by the addition of an insoluble surfactant (e.g., palmitic acid). To test the hypothesis that soluble organic enrichment in SSA could be a result of ionic interactions between soluble organics and insoluble surfactants, a control experiment was designed by pairing glucose (pKa = 12.28 [69], neutral in solution) with palmitic acid (pKa = 8.6–8.8 [63], anionic in solution). At ocean pH (8.1), no ionic interactions would be expected as glucose is charge neutral. The CCN activation spectra (Control, Figure 2A) show no evidence for a statistically significant change upon addition of glucose to the MART, corresponding to no significant change in the measured κ-value. This implies that the relative abundance of glucose in the aerosol particles was negligible compared to the salt, in agreement with the relative bulk concentrations of approximately 600 mM salt and 95 μM glucose (Table 1), which correspond to a mixing rule-derived estimated change in κ on the order of the uncertainty of the κ measurement. Furthermore, addition of palmitic acid also resulted in no change to the measured κ-value, indicating that the presence of palmitic acid alone at the concentrations present in this experiment, as well as the palmitic acid deposition technique using chloroform, did not affect aerosol hygroscopicity.
Experiment 1 (E1, Figure 2B) was designed to probe potential ionic interactions between glucuronic acid (pKa = 2.93 [64], anionic in a solution of pH = 8.0) and palmitic acid in the presence of divalent metal cations. In this case there was a slight shift of the CCN activation curve to higher supersaturations upon addition of glucuronic acid, corresponding to a slight decrease in the measured κ-value. Upon addition of palmitic acid, this effect was far more dramatic. The resulting suppression in hygroscopicity implies pronounced enhancement of organic material in the aerosol particles upon addition of the palmitic acid. Based on the results of the control experiment, we interpret this as evidence for ionic interactions between the saccharide and the surfactant that act to concentrate the soluble organic at the surface of the synthetic ocean matrix where it is ejected to the aerosol phase.
3.3. SSA Organic Enrichment
To calculate the enrichment in organic material in the SSA from measurements of SSA hygroscopicity (κ), we assume that κ follows a linear mixing rule [72] (Equation (1)) where X is the volume fraction of each aerosol component.
κobs = κsaltxsalt + κorgXorg
The initial hygroscopicity value (κ) for particles generated in the MART experiments depends on the relative amounts of individual salts in the sea spray particle (e.g., Na+, Mg2+, Ca2+). For calculations performed here and shown in Table 2, we use the initial measured value for κsalt. In the control experiment, no significant change in the measured κ-value was observed following addition of glucose or palmitic acid to the MART. This suggests very little enrichment of organic material (Xorg ≈ 0; κsalt ≈ 1) in the aerosol, as the hygroscopicity of the particle remains dominated by the high concentrations of salt in the system. For the paired case of glucuronic acid and palmitic acid (experiment 1) a 4% decrease in κ was observed following the addition of glucuronic acid, and a further 21% decrease in κ was observed upon addition of the surfactant. This decrease in hygroscopicity suggests enhancement of organics in the aerosol and supports the mechanism of a saccharide layer co-operatively adsorbed to the insoluble surfactant layer at the surface of the mock ocean matrix. It should also be noted that external mixing can be observed with supersaturated hygroscopicity measurements, as shown by Schill et al. [68], but was not observed for any of the experiments in this study.
Utilizing the κ mixing rule (Equation (1)) [72], which assumes internal mixing, the 21% decrease in κ corresponds to an organic volume fraction of 0.229 for the 50 nm particles analyzed. Based on the shape of the CCN activation curves, there was no evidence for an externally mixed population of particles at 50 nm. This calculation assumes that the organic volume fraction has a 1:1 molar equivalence of glucuronic acid and palmitic acid for the final addition step, and that κorganic = 0.068. Under these assumptions, the organic volume fraction of the particle is 61% palmitic acid and 39% glucuronic acid. As a lower limit if we assume κorganic = 0, the retrieved organic volume fraction would be 0.210.
To determine the effect of the divalent metal cation on the selective transfer of soluble saccharides, we replaced magnesium with calcium, which is known to have a greater binding affinity for palmitic acid [65]. Concentrations of each metal cation were selected to be representative of ocean conditions. As shown in Table 3, the calculated organic volume fraction (calculated relative to the starting κ for each salt matrix) was 0.32 for experiment 2 (E2), which is comparable to that of the Mg2+ experiments, despite the fact that the concentration of Ca2+ was an order of magnitude smaller than the concentration of Mg2+ used in experiment 1.
A final experiment (E3) utilizing glucuronic acid and palmitic acid was designed to shut-off the organic enhancement mechanism by removing the divalent cations from the salt mix. However, a 13% decrease in κ (indicative of organic enhancement) was observed in E3. This may be attributable to the trace divalent metal cations present in the water supply and as impurities in the monovalent salts. It is possible that an additional chelation could more effectively shut down the organic enhancement, though the addition of a chelating agent would complicate the interpretation of the hygroscopicity results significantly.
3.4. Quantitative Measurements of Saccharides in SSA
Aerosol particles generated in the MART were collected via an impactor for offline analysis to quantitatively assess saccharide enrichment in SSA, as discussed in Section 2.3. IEC measurements of the saccharide-to-salt molar ratios in SSA, for dry diameters (dp) < 250 nm, were made for each stage of the MART experiments. The saccharide-to-salt molar ratios ranged from 3 × 10⁻⁵ to 7 × 10⁻⁴, which is comparable to the bulk water ratio (Table 1, 7 × 10⁻⁴), and organic mass fractions ranged from 1 × 10⁻³ to 8 × 10⁻³ across all experiments. To directly compare with hygroscopicity measurements, the saccharide volume fraction (Xsaccharide) was obtained from IEC measurements according to Equation (2), where nsaccharide and nsalt is the collection of volume-normalized moles of saccharide and salt respectively, M is the molar mass, and ρ is the density.
Table 3 shows tabulated Xsaccharide, IEC values for each addition in the MART experiments. Volume fractions of glucose in the control experiment were approximately one order of magnitude greater than those measured for experiments with glucuronic acid. Little variation with no apparent trend was observed in the glucose volume fraction after each addition in the control experiment. In E1 and E2, an increase in glucuronic volume fraction was observed, particularly after the addition of the surfactant. These correspond to a 5× and 3.5× increase in total saccharide mass for E1 and E2, respectively, compared to increases in aerosol mass (60 nm < dp < 250 nm) of 1.4× and 1.6×, which demonstrates glucuronic acid enrichment in both experiments. E3 was also associated with saccharide enrichment despite the absence of added divalent cations, though the effect was weaker with an increase in total saccharide mass of 1.8× compared to an increase in aerosol mass (60 nm < dp < 250 nm) of 1.6×.
4. Discussion
4.1. Comparison of Hygroscopicity and Chromatography Derived SSA Organic Volume Fractions
To compare the aerosol organic volume fractions calculated from hygroscopicity measurements (Xorg, κ) with the saccharide volume fractions calculated from IEC measurements (Xsaccharide, IEC), we first need to convert Xsaccharide, IEC to Xorg, IEC by accounting for palmitic acid assumed to be present in a 1:1 molar ratio with glucuronic acid in the final addition. Calculations of Xorg,IEC for experiment 1 (E1) correspond to 4.3 × 10⁻⁴ and 1.52 × 10⁻³ for the addition of glucuronic acid and palmitic acid, respectively, to artificial seawater.
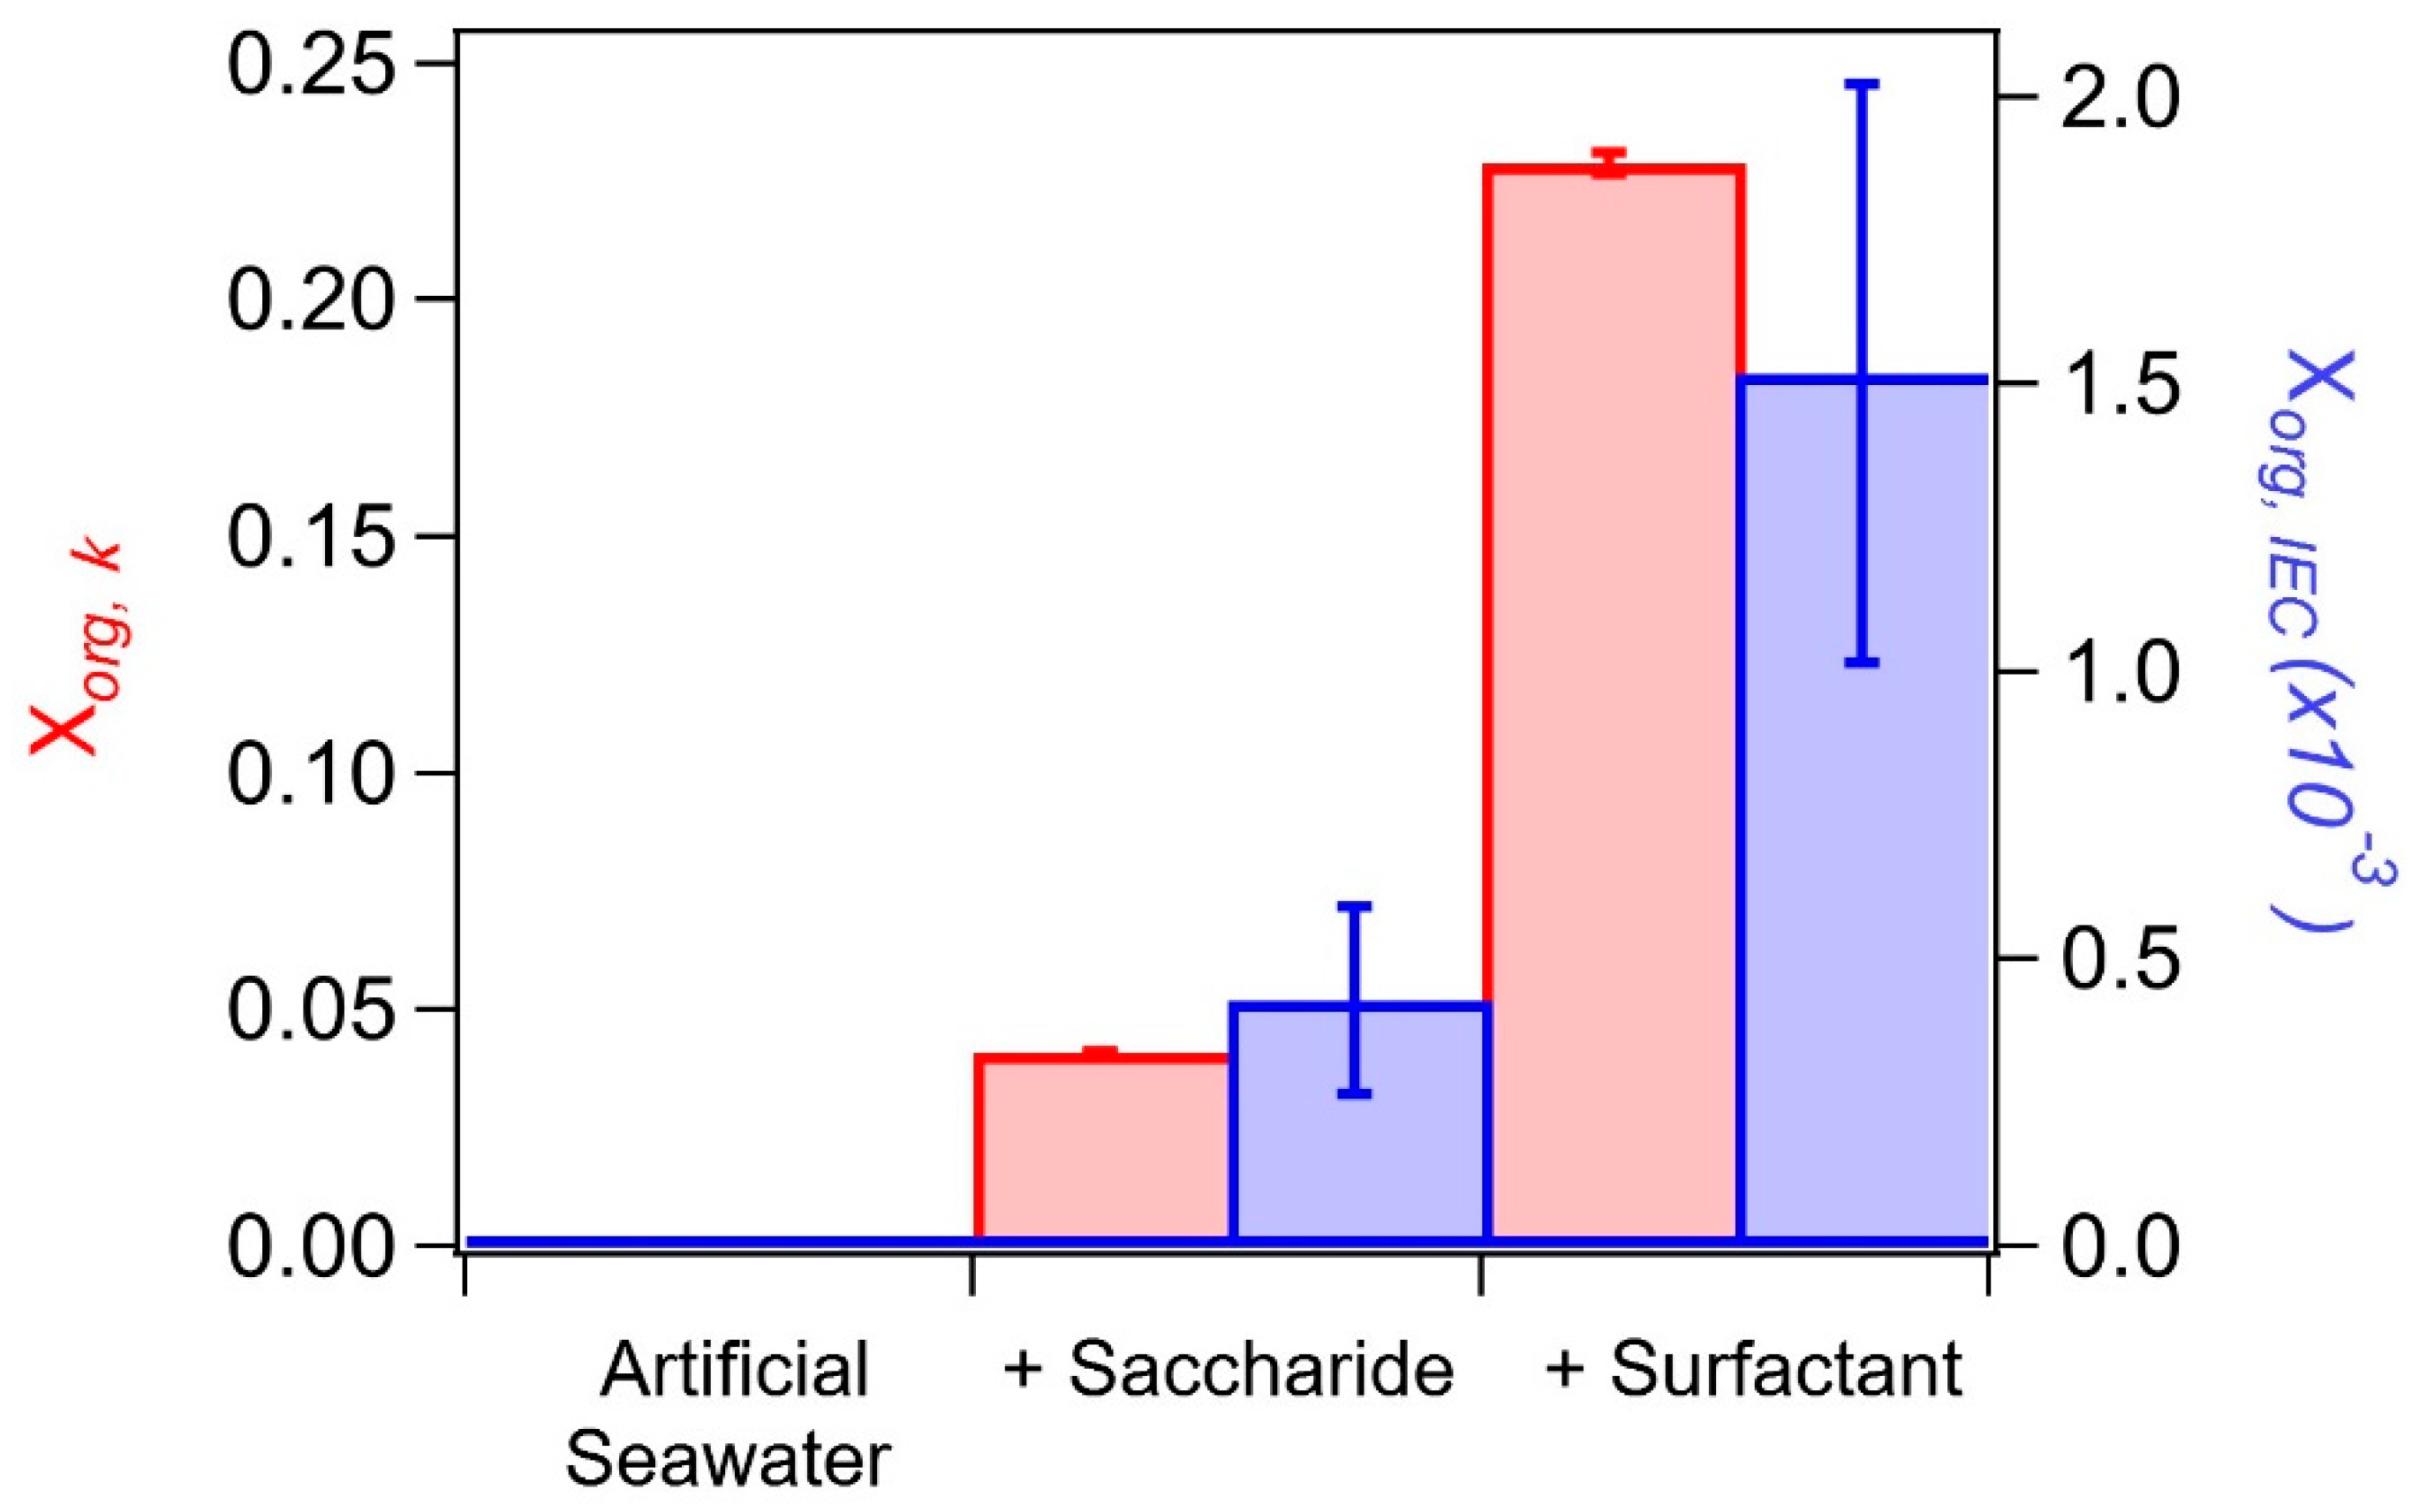
The comparison of Xorg, κ with Xorg, IEC is shown in Figure 3 for the salt water, and salt water with subsequent additions of glucuronic acid and palmitic acid (E1). The relative change in Xorg between the two experiments is in strong agreement, where Xorg increases substantially upon addition of the surfactant. However, as shown in Figure 3, the two determinations differ by almost a factor of 100.
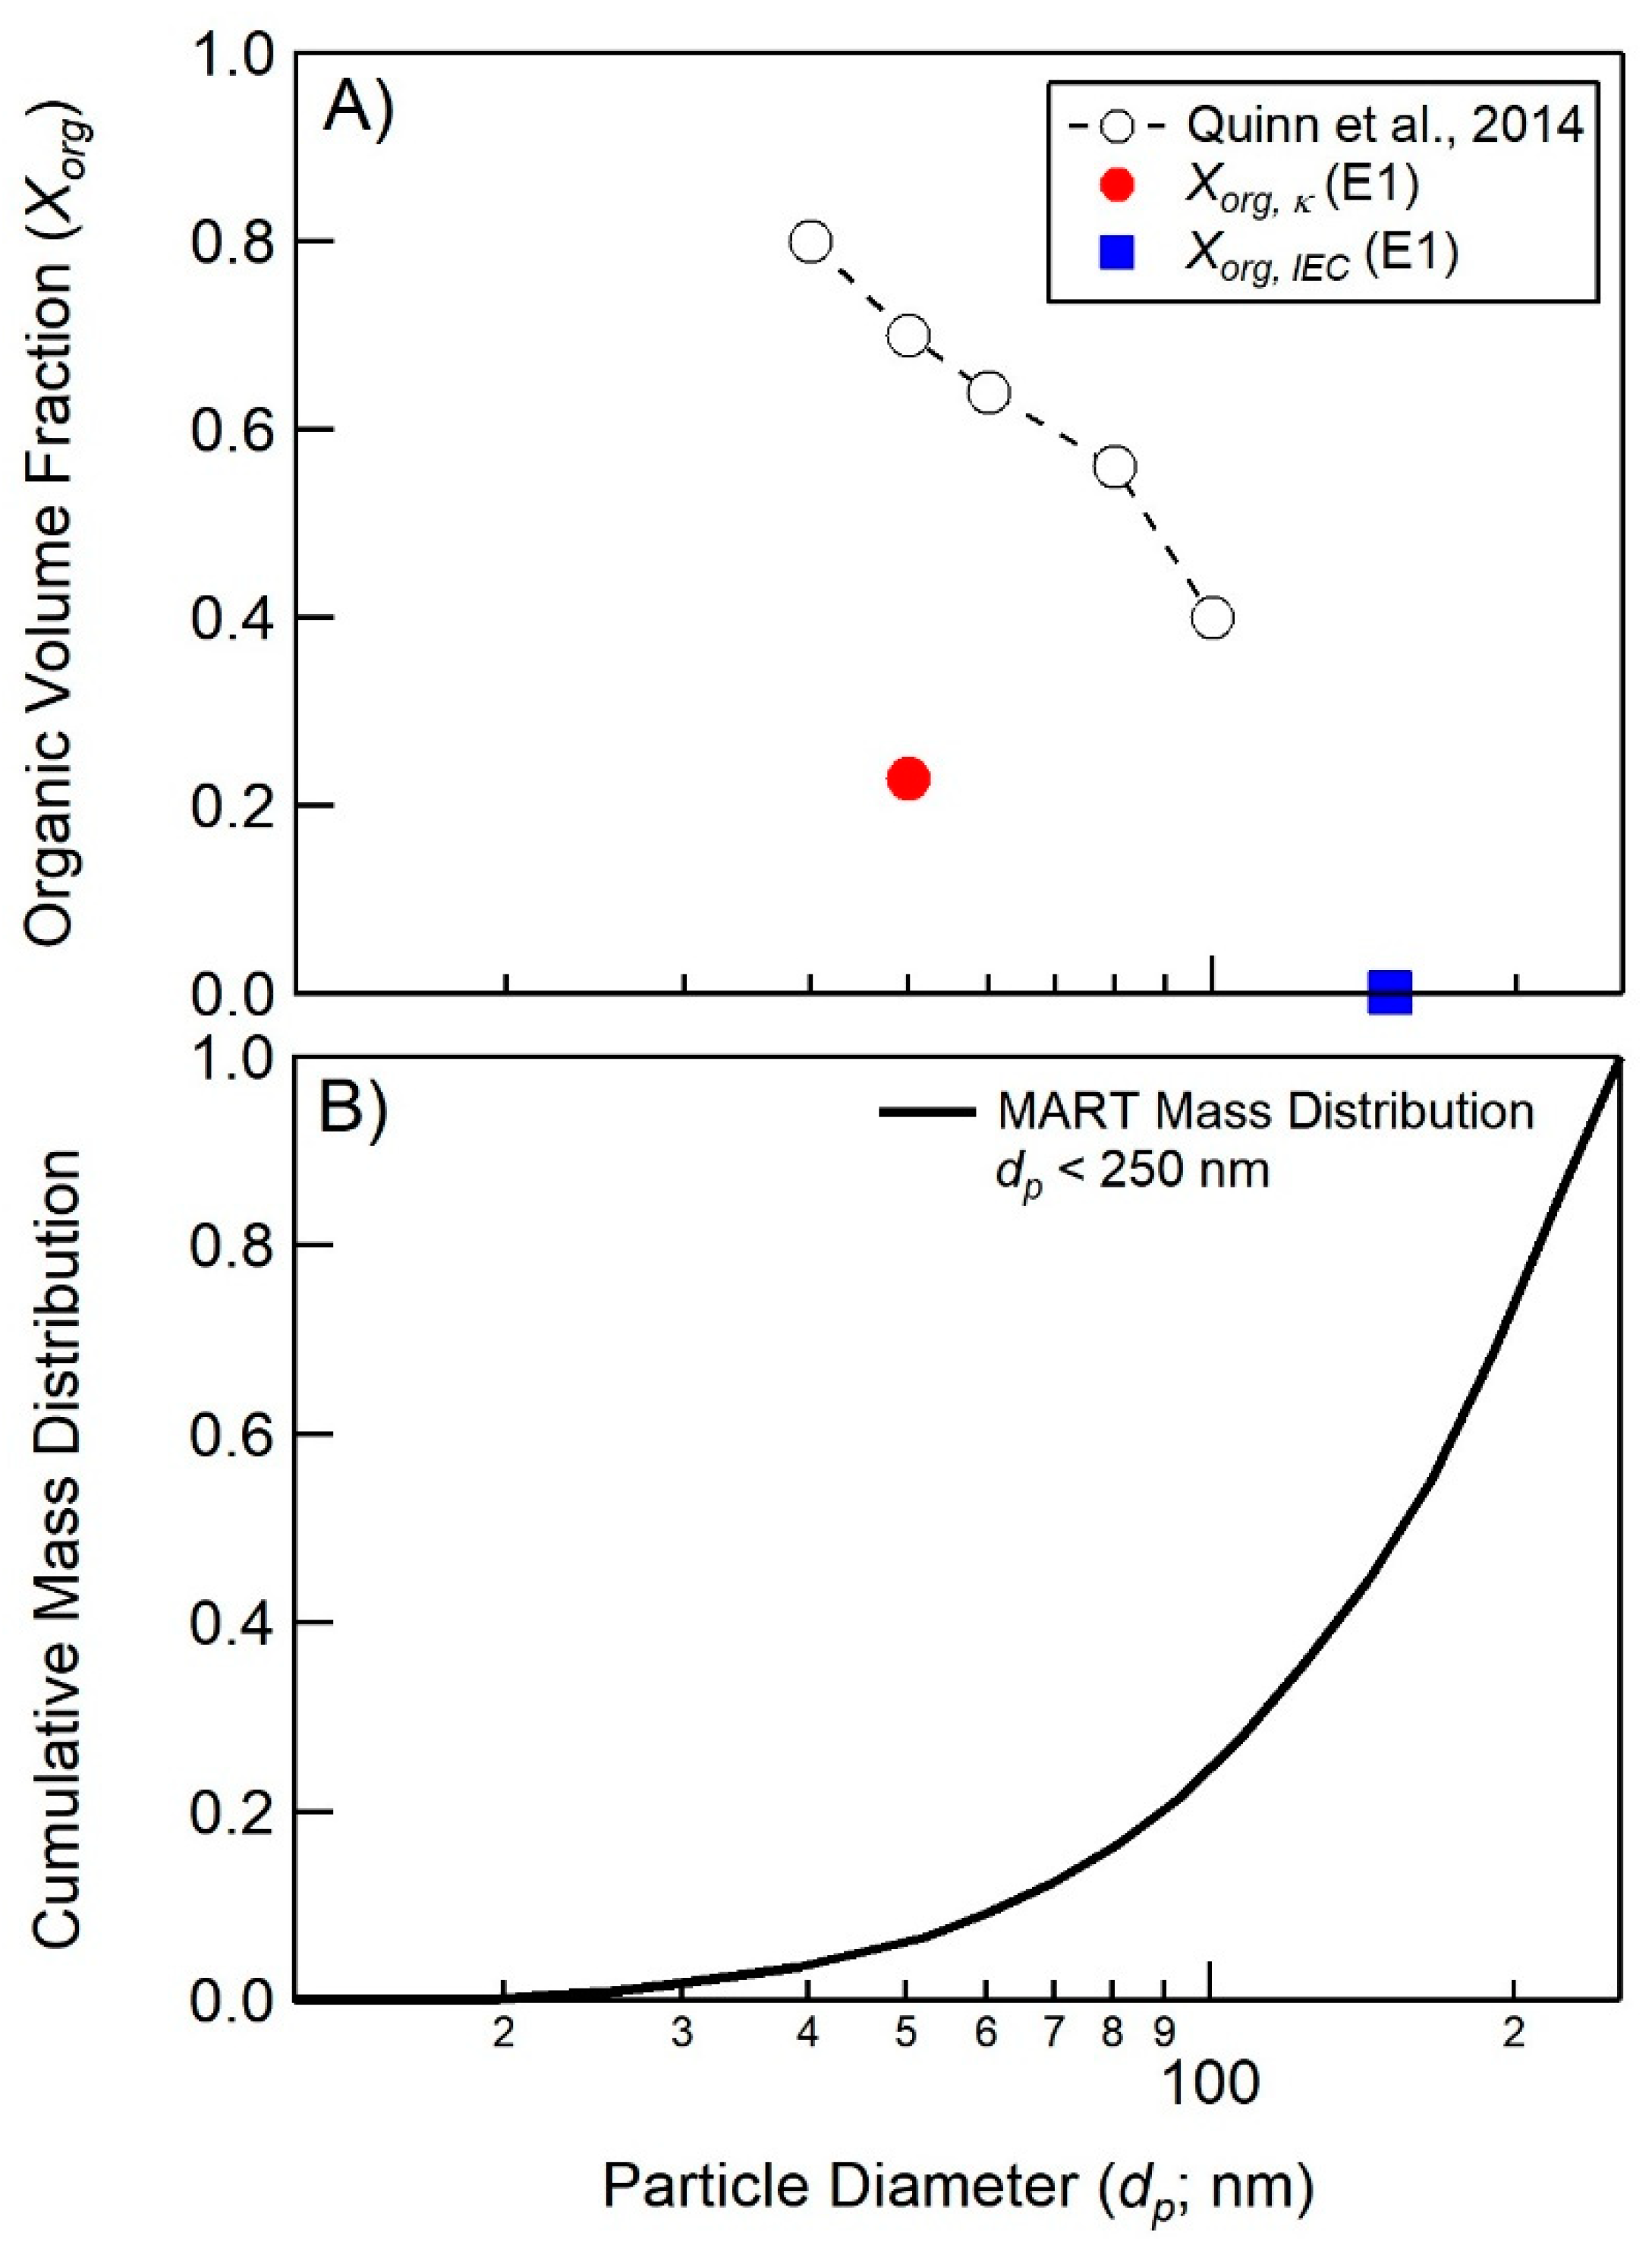
Calculations of Xorg, κ for 50 nm (dp) particles range from 0.004–0.323 for the sequential addition MART experiments in this study. For reference, calculations of organic volume fractions from hygroscopicity measurements made on SSA generated from seawater in the Atlantic Ocean [10] indicate substantial enrichment in organic material, and a strong size dependence in Xorg, κ.
The most notable difference between Xorg, IEC values in this study and Xorg, κ is the particle size regime over which the measurements are made. Measurements of Xorg by IEC (dp < 250 nm) are strongly influenced by particles of much larger diameters and mass, that are expected to be significantly less enriched in organic material. As shown in Figure 4B, particles with a diameter less than 50 nm contribute roughly 5% to the sub-250 nm mass for the typical SSA size distribution generated in the MART [78]. A strong size dependent enrichment in organic material could explain some of the disagreement between Xorg, IEC and Xorg, κ.
4.2. Connections between Organic Volume Fractions and SSA Formation Mechanisms
In what follows, we interpret the SSA organic mass fractions derived in Section 4 using the Langmuir adsorption equilibrium model developed in Burrows et al. [57]. Specifically, we use determinations of Xorg, κ for the control experiment (glucose + palmitic acid) and experiment 1 (glucuronic acid + palmitic acid) to assess the role that SSML composition may play in bubble film stabilization and thickness (l) and ultimately the organic mass fraction of nascent SSA. For the control experiment, we assume that glucose does not play a significant role in bubble film stabilization and that the fractional surface coverage (ΘPA) of palmitic acid on the bubble film cap is 1. A fractional surface coverage of 1 at the surface of the quiescent MART is supported by the concentration of palmitic acid added to the MART (35 μM) relative to the surface area of the MART (4180 cm2); however, ΘPA for the bubble film cap could be significantly smaller due to palmitic acid scavenging in the MART and non-equilibrium partitioning of palmitic acid on both sides of the bubble cap.
We first calculate the organic mass fraction in the bubble film cap, using Equation (3), where mPA, bub and mNaCl are the masses of palmitic acid and salt in the bubble cap, respectively.
The organic mass fraction derived from the Langmuir adsorption equilibrium model is a function of: the fractional surface coverage (ΘPA), mean molecular area (aPA), and molecular weight (MPA) of the organic component, here palmitic acid. For palmitic acid, we take aPA = 20 Å2 molecule−1 and MPA = 254 g mol−1. The model is also a function of ocean salinity (s = 0.035 kg kg−1) and density (ρSW = 1.025 kg L−1). The constant factor (n = 2) indicates that the bubble film cap has two air-water interfaces, which are assumed to be equally coated by the organic film.
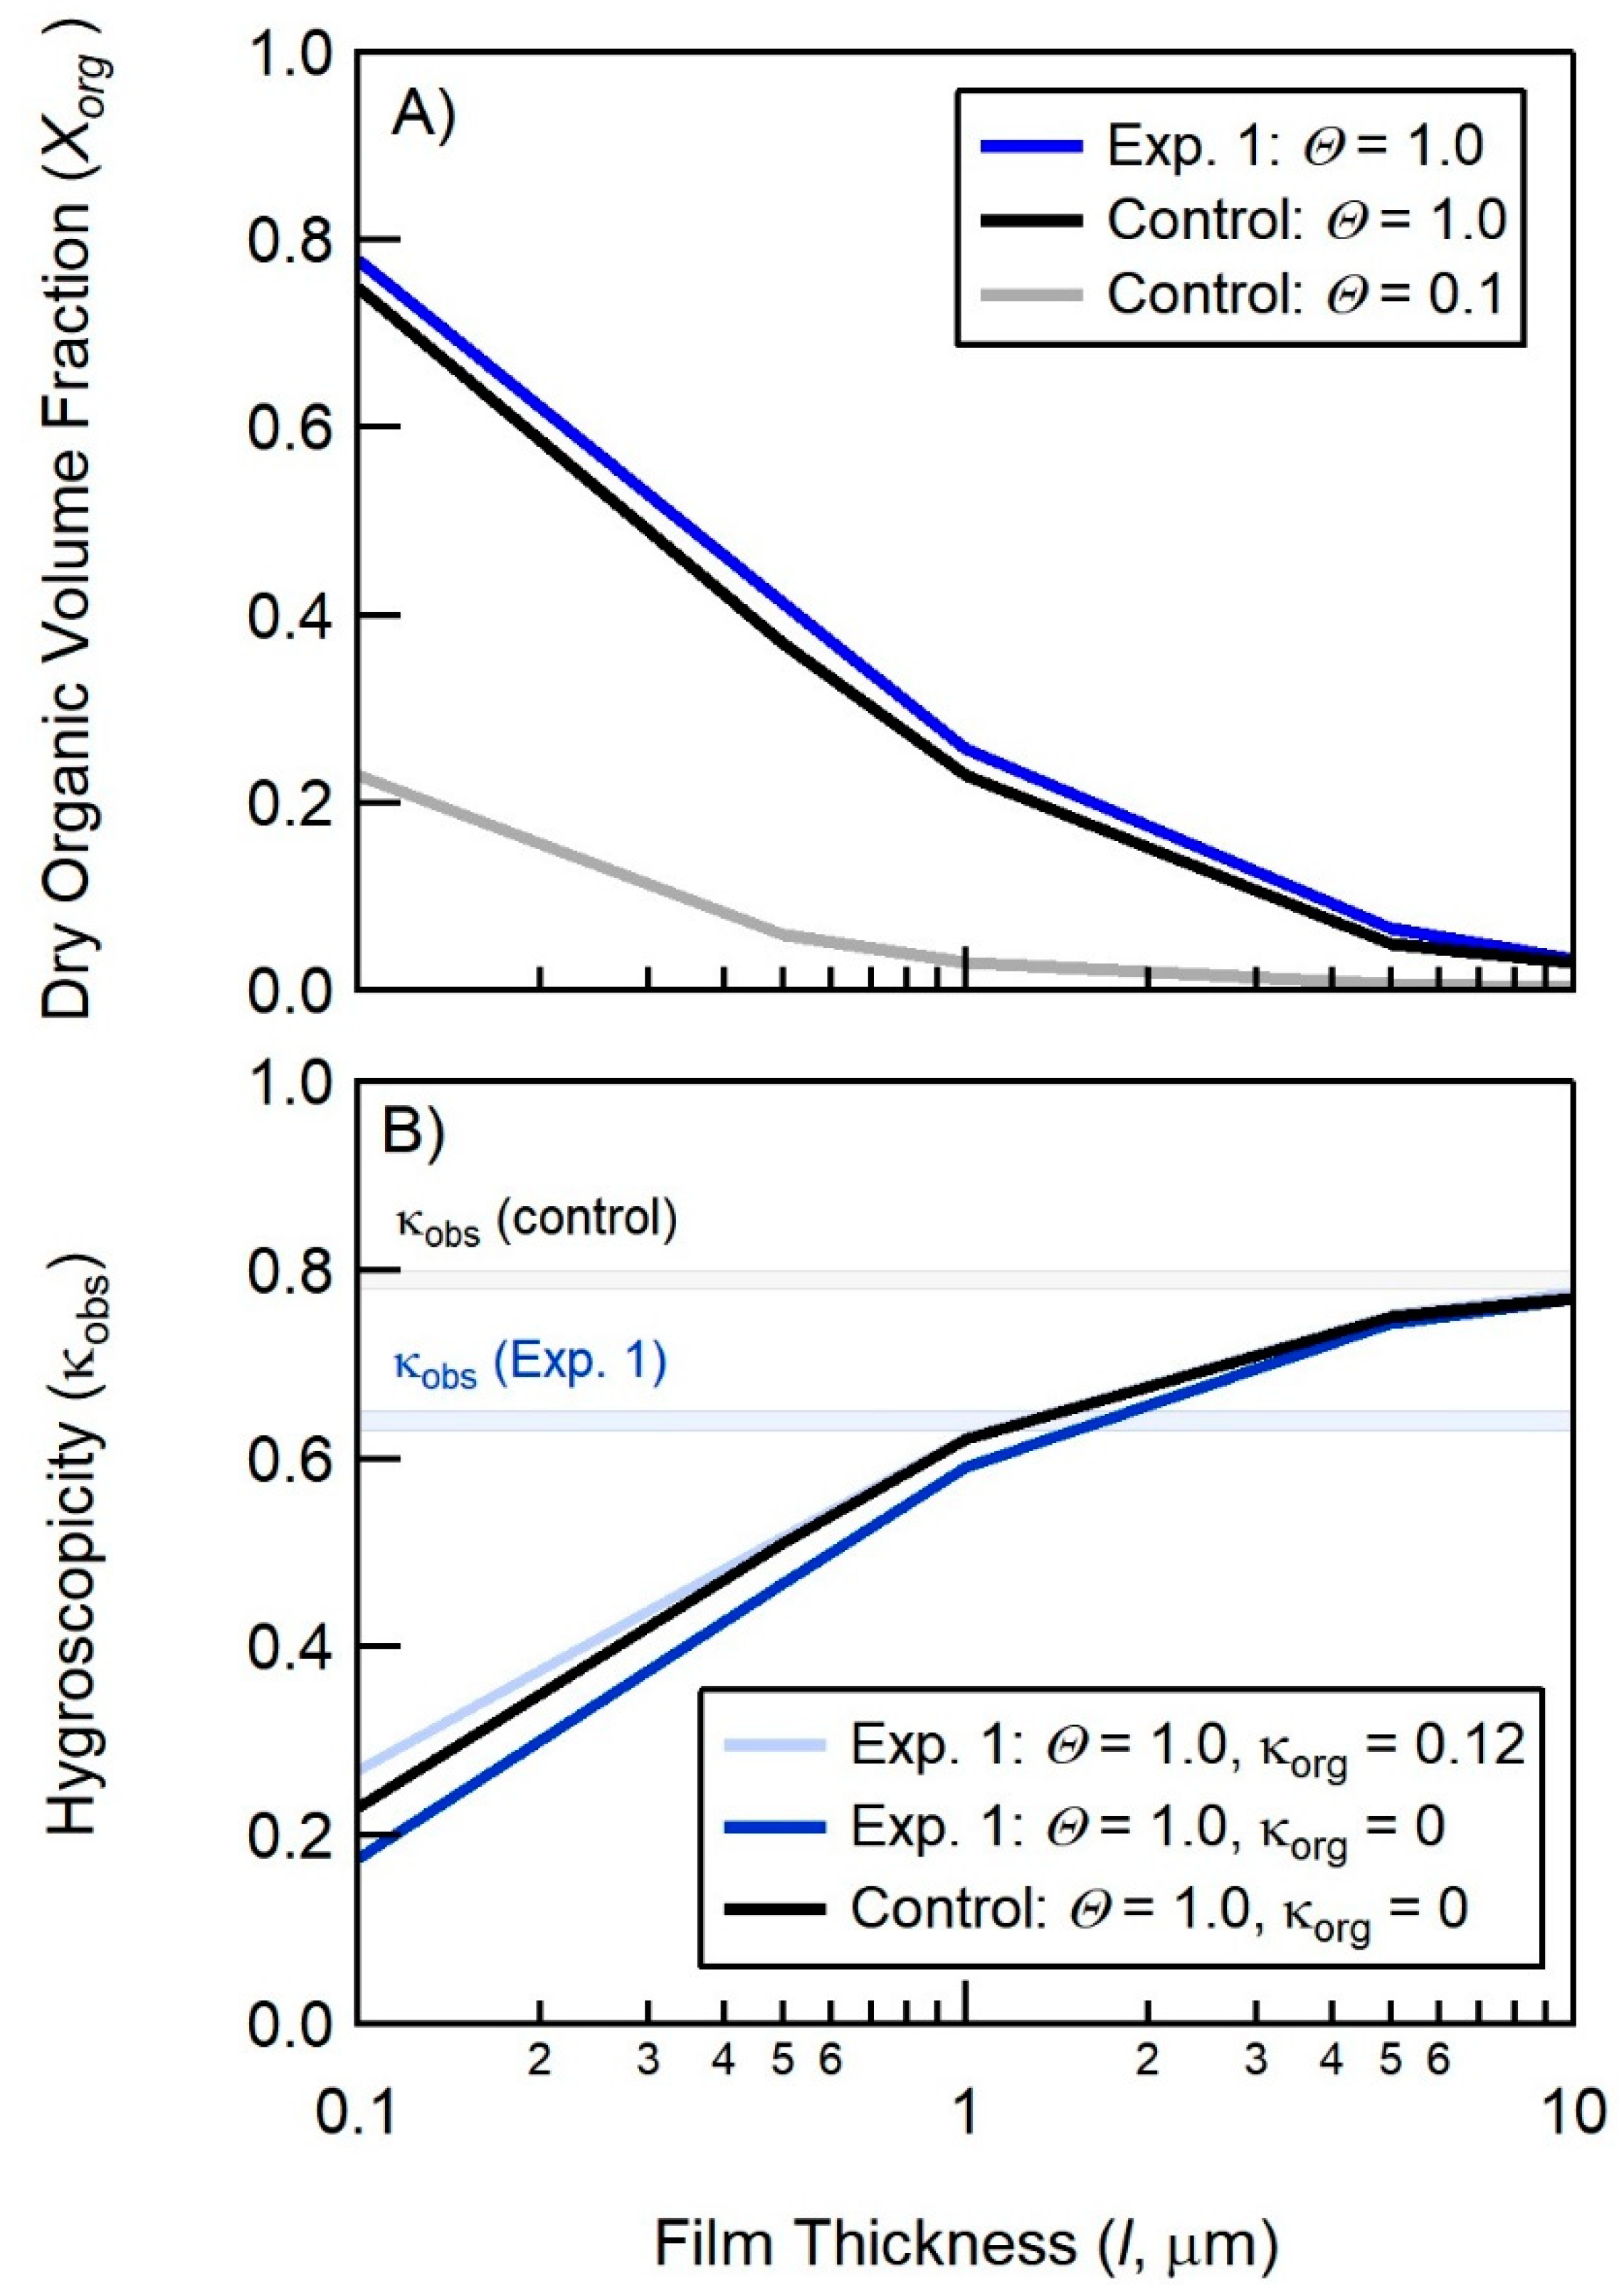
The organic mass fraction can be converted to a dry organic volume fraction (using the density of palmitic acid, ΘPA = 0.853 g cm−3), and then to a κ-value via Equation (1). Figure 5 shows the calculated organic volume fractions (Xorg) and κ-values for the addition of palmitic acid to the salt water in the MART as a function of ΘPA and l, where κorg = 0 for palmitic acid and we take κsalt to be the initial measured κ-value prior to the addition of organic material to the MART (κsalt = κinitial = 0.75).
Figure 5B shows that when assuming a fully-coated surface (ΘPA = 1), the model would require a thick film cap (l > 10 μm) at the point of rupture in order to match the hygroscopicity measured in the control experiment. This is significantly thicker than the film cap for the insoluble surfactant, Triton X-100, which was determined by Modini et al. to range between 0.05 and 0.5 μm for surface tensions of 24 mN m−1 [79]. A film cap thickness of 5 μm is slightly larger than the high end of the range in l observed for NaCl solutions (0.5–2 μm) observed by Modini et al., 2013. However, as noted by Modini et al., insoluble surfactants (such as palmitic acid) can serve to destabilize bubbles thus decreasing bubble lifetime and increasing film cap thickness at bubble rupture [80,81].
To model the results of experiment 1, we assume that glucuronic acid binds in a 1:1 molar ratio with palmitate at the air-water interface via an Mg2+ bridge, to form a palmitic acid and glucuronic acid complex (PA + GA) that has a molecular weight of 448 g mol−1 and a mean molecular area of 20 Å2 molecule−1. Figure 5A (dark blue line) shows the resulting change in the organic volume fraction due to the increase in MPA+GA. Figure 5B shows the resulting change in κ, when assuming the hygroscopicity is a linear combination of the PA and GA values (κorg = 0.12; light blue line), or assuming the lower limit (κorg = 0; dark blue line). The increase in organic volume fraction (Figure 5A) is offset by the increase in κorg from 0 to 0.12 (Figure 5B), suggesting that the formation of a PA+GA complex should have a minimal impact on κ if all other factors remained constant (i.e., surface coverage, film thickness, and mean molecular area). However, as described in Section 4, we measured a suppression of hygroscopicity from κinitial = 0.80 to κmeasured = 0.63 following the addition of 95 μM of glucuronic acid and 35 μM palmitic acid. Even assuming the lower limit of κorg = 0, we find that the modeled hygroscopicity decreases from 0.75 to 0.74 (Figure 5B, light blue line), which does not account for the suppression in hygroscopicity observed in the experiment.
An alternative explanation of the reduction in hygroscopicity is that the substitution of glucuronic acid for glucose may change the bubble film properties. For example, it is feasible that the presence of glucuronic acid may stabilize the bubble film cap, leading to a reduction in bubble film thickness at the point of rupture. As shown in Figure 5B, a reduction in bubble film thickness from 10 μm to 1 μm could account for the observed change in hygroscopicity, holding all other factors constant.
Given this analysis, we suggest that direct measurements of organic mass fractions in nascent SSA, combined with concurrent measurements of bubble film thickness and surfactant fractional surface coverage, would provide meaningful constraints for mechanistic models of organic matter enrichment in nascent SSA, such as the Langmuir adsorption equilibrium model [57].
5. Conclusions
Marine SSA were generated in a laboratory setting from a synthetic ocean matrix containing soluble (saccharide) and insoluble (surfactant) organic compounds to assess the role of divalent cation mediated co-adsorption of charged surfactants and saccharides in the enrichment of soluble saccharides in SSA. Measurements of aerosol hygroscopicity and saccharide concentration were made to assess the presence of organics in sub 250 nm particles. Statistically significant enrichment was observed in 50 nm particles for systems with cooperative ionic interactions (e.g., palmitic acid, Mg2+, and glucuronic acid), which may have important implications for aerosol composition and their subsequent impact on climate. The results presented here support the proposed mechanism of ion-mediated co-adsorption of soluble organics to insoluble surfactants at the ocean surface, however this mechanism is likely not solely responsible for the enrichment of soluble organic material in SSA. This proposed mechanism is further supported by the critical role of the divalent metal cation, which in this study greatly impacted the observed level of enrichment. The extent to which this mechanism contributes to the observed enhancement in saccharides in nascent SSA depends strongly on the speciation and charge of soluble saccharides in the SSML.
Author Contributions
Conceptualization, S.R.S., S.M.B. and T.H.B.; Data curation, S.R.S., S.M.B. and T.H.B.; Formal analysis, S.R.S., S.M.B., E.S.H., E.A.S. and T.H.B.; Funding acquisition, T.H.B.; Methodology, S.R.S., S.M.B., E.A.S. and T.H.B.; Project administration, S.R.S. and T.H.B.; Supervision, T.H.B.; Validation, S.R.S., S.M.B., E.S.H. and E.A.S.; Visualization, S.M.B.; Writing-original draft, S.R.S.; Writing-review & editing, S.R.S., E.S.H., E.A.S. and T.H.B.
Funding
This work was funded by the National Science Foundation through the Center for Aerosol Impacts on Climate and the Environment under Grant No. CHE 1801971. Any opinions, findings, and conclusions or recommendations expressed in this material are those of the authors and do not necessarily reflect the views of the National Science Foundation. S.M.B. was supported by the U.S. DOE Office of Science (BER).
Acknowledgments
The authors thank Jamie Schauer for helpful discussions pertaining to the PCIS aerosol collection, and Bethany Wellen and Heather Allen for helpful discussions pertaining to working with palmitic acid.
Conflicts of Interest
The authors declare no conflict of interest. The funders had no role in the design of the study; in the collection, analyses, or interpretation of data; in the writing of the manuscript, or in the decision to publish the results.
References
- Boucher, O.; Randall, D.; Artaxo, P.; Bretherton, C.; Feingold, G.; Forster, P.; Kerminen, V.-M.; Kondo, Y.; Liao, H.; Lohmann, U.; et al. Clouds and Aerosols. In Climate Change 2013: The Physical Science Basis. Contribution of Working Group I to the Fifth Assessment Report of the Intergovernmental Panel on Climate Change; Cambridge University Press: Cambridge, UK; New York, NY, USA, 2013. [Google Scholar]
- Aitken, J. XII.—On Dust, Fogs, and Clouds. Earth Environ. Sci. Trans. R. Soc. Edinb. 1881, 30, 337–368. [Google Scholar] [CrossRef]
- Andreae, M.O.; Rosenfeld, D. Aerosol-cloud-precipitation interactions. Part 1. The nature and sources of cloud-active aerosols. Earth Sci. Rev. 2008, 89, 13–41. [Google Scholar] [CrossRef]
- DeMott, P.J.; Hill, T.C.J.; McCluskey, C.S.; Prather, K.A.; Collins, D.B.; Sullivan, R.C.; Ruppel, M.J.; Mason, R.H.; Irish, V.E.; Lee, T.; et al. Sea spray aerosol as a unique source of ice nucleating particles. Proc. Natl. Acad. Sci. USA 2016, 113, 5797–5803. [Google Scholar] [CrossRef] [PubMed]
- Schnell, R.C. Ice Nuclei Produced by Laboratory Cultured Marine Phytoplankton. Geophys. Res. Lett. 1975, 2, 500–502. [Google Scholar] [CrossRef]
- Wilson, T.W.; Ladino, L.A.; Alpert, P.A.; Breckels, M.N.; Brooks, I.M.; Browse, J.; Burrows, S.M.; Carslaw, K.S.; Huffman, J.A.; Judd, C.; et al. A marine biogenic source of atmospheric ice-nucleating particles. Nature 2015, 525, 234–238. [Google Scholar] [CrossRef] [PubMed] [Green Version]
- Ryder, O.S.; Campbell, N.R.; Morris, H.; Forestieri, S.; Ruppel, M.J.; Cappa, C.; Tivanski, A.; Prather, K.; Bertram, T.H. Role of Organic Coatings in Regulating N2O5 Reactive Uptake to Sea Spray Aerosol. J. Phys. Chem. A 2015, 119, 11683–11692. [Google Scholar] [CrossRef]
- Ault, A.P.; Guasco, T.L.; Baltrusaitis, J.; Ryder, O.S.; Trueblood, J.V.; Collins, D.B.; Ruppel, M.J.; Cuadra-Rodriguez, L.A.; Prather, K.A.; Grassian, V.H. Heterogeneous Reactivity of Nitric Acid with Nascent Sea Spray Aerosol: Large Differences Observed between and within Individual Particles. J. Phys. Chem. Lett. 2014, 5, 2493–2500. [Google Scholar] [CrossRef]
- Forestieri, S.D.; Cornwell, G.C.; Helgestad, T.M.; Moore, K.A.; Lee, C.; Novak, G.A.; Sultana, C.M.; Wang, X.; Bertram, T.B.; Prather, K.A.; et al. Linking variations in sea spray aerosol particle hygroscopicity to composition during two microco sm experiments. Atmos. Chem. Phys. 2016, 16, 9003–9018. [Google Scholar] [CrossRef]
- Quinn, P.K.; Bates, T.S.; Schulz, K.S.; Coffman, D.J.; Frossard, A.A.; Russell, L.M.; Keene, W.C.; Kieber, D.J. Contribution of sea surface carbon pool to organic matter enrichment in sea spray aerosol. Nat. Geosci. 2014, 7, 228–232. [Google Scholar] [CrossRef]
- Collins, D.B.; Bertram, T.H.; Sultana, C.M.; Lee, C.; Axson, J.L.; Prather, K.A. Phytoplankton blooms weakly influence the cloud forming ability of sea spray aerosol. Geophys. Res. Lett. 2016, 43, 9975–9983. [Google Scholar] [CrossRef]
- Aluwihare, L.I.; Repeta, D.J.; Chen, R.F. A major biopolymeric component to dissolved organic carbon in surface sea water. Nature 1997, 387, 166–169. [Google Scholar] [CrossRef]
- Hoffman, E.J.; Duce, R.A. Factors Influencing Organic-Carbon Content of Marine Aerosols—Laboratory Study. J. Geophys. Res. Oceans Atmos. 1976, 81, 3667–3670. [Google Scholar] [CrossRef]
- Wang, X.F.; Sultana, C.M.; Trueblood, J.; Hill, T.C.J.; Malfatti, F.; Lee, C.; Laskina, O.; Moore, K.A.; Beall, C.M.; McCluskey, C.S.; et al. Microbial Control of Sea Spray Aerosol Composition: A Tale of Two Blooms. ACS Cent. Sci. 2015, 1, 124–131. [Google Scholar] [CrossRef] [PubMed]
- O’Dowd, C.D.; Facchini, M.C.; Cavalli, F.; Ceburnis, D.; Mircea, M.; Decesari, S.; Fuzzi, S.; Yoon, Y.J.; Putaud, J.P. Biogenically driven organic contribution to marine aerosol. Nature 2004, 431, 676–680. [Google Scholar]
- Langmann, B.; Scannell, C.; O’Dowd, C. New Directions: Organic matter contribution to marine aerosols and cloud condensation nuclei. Atmos. Environ. 2008, 42, 7821–7822. [Google Scholar] [CrossRef]
- Mochida, M.; Kitamori, Y.; Kawamura, K. Fatty acids in the marine atmosphere: Factors governing their concentrations and evaluation of organic films on sea-salt particles. J. Geophys. Res. Atmos. 2002, 107, AAC 1-1–AAC 1-10. [Google Scholar] [CrossRef]
- Cochran, R.E.; Jayarathne, T.; Stone, E.A.; Grassian, V.H. Selectivity across the Interface: A Test of Surface Activity in the Composition of Organic-Enriched Aerosols from Bubble Bursting. J. Phys. Chem. Lett. 2016, 7, 1692–1696. [Google Scholar] [CrossRef]
- Jayarathne, T.; Sultana, C.M.; Lee, C.; Malfatti, F.; Cox, J.L.; Pendergraft, M.A.; Moore, K.A.; Azam, F.; Tivanski, A.V.; Cappa, C.D.; et al. Enrichment of Saccharides and Divalent Cations in Sea Spray Aerosol During Two Phytoplankton Blooms. Environ. Sci. Technol. 2016, 50, 11511–11520. [Google Scholar] [CrossRef]
- O’Dowd, C.D.; De Leeuw, G. Marine aerosol production: A review of the current knowledge. Phil. Trans. R. Soc. Lond. A Math. Phys. Eng. Sci. 2007, 365, 1753–1774. [Google Scholar] [CrossRef]
- Keene, W.C.; Maring, H.; Maben, J.R.; Kieber, D.J.; Pszenny, A.A.P.; Dahl, E.E.; Izaguirre, M.A.; Davis, A.J.; Long, M.S.; Zhou, X.; et al. Chemical and physical characteristics of nascent aerosols produced by bursting bubbles at a model air-sea interface. J. Geophys. Res. Atmos. 2007, 112. [Google Scholar] [CrossRef] [Green Version]
- Barker, D.R.; Zeitlin, H. Metal-Ion Concentrations in Sea-Surface Microlayer and Size-Separated Atmospheric Aerosol Samples in Hawaii. J. Geophys. Res. 1972, 77, 5076–5086. [Google Scholar] [CrossRef]
- Holland, H.D. The Chemistry of Atmosphere and Oceans; John Wiley & Sons Inc.: Hoboken, NJ, USA, 1978. [Google Scholar]
- Sarmiento, J.L.; Gruber, N. Ocean Biogeochemical Dynamics; Princeton University Press: Princeton, NJ, USA, 2006. [Google Scholar]
- Lee, C.; Sultana, C.M.; Collins, D.B.; Santander, M.V.; Axson, J.L.; Malfatti, F.; Cornwell, G.C.; Grandquist, J.R.; Deane, G.B.; Stokes, M.D.; et al. Advancing Model Systems for Fundamental Laboratory Studies of Sea Spray Aerosol Using the Microbial Loop. J. Phys. Chem. A 2015, 119, 8860–8870. [Google Scholar] [CrossRef] [PubMed]
- McCarthy, M.D.; Hedges, J.I.; Benner, R. Major bacterial contribution to marine dissolved organic nitrogen. Science 1998, 281, 231–234. [Google Scholar] [CrossRef] [PubMed]
- DeLong, E.F.; Preston, C.M.; Mincer, T.; Rich, V.; Hallam, S.J.; Frigaard, N.; Martinez, A.; Sullivan, M.B.; Edwards, R.; Brito, B.R.; et al. Community genomics among stratified microbial assemblages in the ocean’s interior. Science 2006, 311, 496–503. [Google Scholar] [CrossRef] [PubMed]
- Aristegui, J.; Duarte, C.M.; Agusti, S.; Doval, M.; Alvarez-Salgadi, X.A.; Hansell, D.A. Dissolved organic carbon support of respiration in the dark ocean. Science 2002, 298, 1967. [Google Scholar] [CrossRef] [PubMed] [Green Version]
- Peltzer, E.T.; Hayward, N.A. Spatial and temporal variability of total organic carbon along 140 degrees W in the equatorial Pacific Ocean in 1992. Deep Sea Res. Part II Top. Stud. Oceanogr. 1996, 43, 1155–1180. [Google Scholar] [CrossRef]
- Copinmontegut, G.; Avril, B. Vertical-Distribution and Temporal Variation of Dissolved Organic-Carbon in the North-Western Mediterranean-Sea. Deep Sea Res. Part I Oceanogr. Res. Pap. 1993, 40, 1963–1972. [Google Scholar] [CrossRef]
- Kirchman, D.L.; Suzuki, Y.; Garside, C.; Ducklow, H.W. High Turnover Rates of Dissolved Organic-Carbon during a Spring Phytoplankton Bloom. Nature 1991, 352, 612–614. [Google Scholar] [CrossRef]
- Norrman, B.; Zweifel, U.L. Production and Utilization of Dissolved Organic-Carbon during an Experimental Diatom Bloom. Limnol. Oceanogr. 1995, 40, 898–907. [Google Scholar] [CrossRef]
- Gobler, C.J.; Sanudo-Wilhelmy, S.A. Cycling of colloidal organic carbon and nitrogen during an estuarine phytoplankton bloom. Limnol. Oceanogr. 2003, 48, 2314–2320. [Google Scholar] [CrossRef] [Green Version]
- Facchini, M.C.; Rinaldi, M.; Decesari, S.; Carbone, C.; Finessi, E.; Mircea, M.; Fuzzi, S.; Ceburnis, D.; Flanagan, R.; Nilsson, E.D.; et al. Primary submicron marine aerosol dominated by insoluble organic colloids and aggregates. Geophys. Res. Lett. 2008, 35. [Google Scholar] [CrossRef] [Green Version]
- Russell, L.M.; Hawkins, L.N.; Frossard, A.A.; Quinn, P.K.; Bates, T.S. Carbohydrate-like composition of submicron atmospheric particles and their production from ocean bubble bursting. Proc. Natl. Acad. Sci. USA 2010, 107, 6652–6657. [Google Scholar] [CrossRef] [PubMed]
- Hawkins, L.N.; Russell, L. Polysaccharides, Proteins, and Phytoplankton Fragments: Four Chemically Distinct Types of Marine Primary Organic Aerosol Classified by Single Particle Spectromicroscopy. Adv. Meteorol. 2010, 2010, 14. [Google Scholar] [CrossRef]
- Frossard, A.A.; Russell, L.M.; Burrows, S.M.; Elliott, S.M.; Bates, T.S.; Quinn, P.K. Sources and composition of submicron organic mass in marine aerosol particles. J. Geophys. Res. Atmos. 2014, 119, 12977–13003. [Google Scholar] [CrossRef]
- Crahan, K.K.; Hegg, D.A.; Covert, D.S. Speciation of organic aerosols in the tropical mid-pacific and their relationship to light scattering. J. Atmos. Sci. 2004, 61, 2544–2558. [Google Scholar] [CrossRef]
- Aller, J.Y.; Radway, J.C.; Kilthau, W.P.; Bothe, D.W.; Wilson, T.W.; Vailancourt, R.D.; Quinn, P.K.; Coffman, D.J.; Murray, B.J.; Knopf, D.A. Size-resolved characterization of the polysaccharidic and proteinaceous components of sea spray aerosol. Atmos. Environ. 2017, 154, 331–347. [Google Scholar] [CrossRef] [Green Version]
- van Pinxteren, M.; Muller, C.; Iinuma, Y.; Stolle, C.; Herrmann, H. Chemical Characterization of Dissolved Organic Compounds from Coastal Sea Surface Micro layers (Baltic Sea, Germany). Environ. Sci. Technol. 2012, 46, 10455–10462. [Google Scholar] [CrossRef]
- Compiano, A.M.; Romano, J.; de la Giraudiere, I.; Laborde, P. Monosaccharide Composition of Suspended Organic Particulate Matter in Relation to Its Origin. Oceanol. Acta 1993, 16, 135–144. [Google Scholar]
- Compiano, A.M.; Romno, J.; Garabetian, F.; Laborde, P.; de la Giraudierea, I. Monosaccharide Composition of Particulate Hydrolyzable Sugar Fraction in Surface Microlayers from Brackish and Marine Waters. Mar. Chem. 1993, 42, 237–251. [Google Scholar] [CrossRef]
- Haug, A.; Myklestad, S. Polysaccharides of Marine Diatoms with Special Reference to Chaetoceros Species. Mar. Boil. 1976, 34, 217–222. [Google Scholar] [CrossRef]
- Verdugo, P.; Alldredge, A.L.; Azam, F.; Kirchman, D.L.; Passow, U.; Santschi, P.H. The oceanic gel phase: A bridge in the DOM-POM continuum. Mar. Chem. 2004, 92, 67–85. [Google Scholar] [CrossRef]
- Ittekkot, V. Variations of Dissolved Organic-Matter during a Plankton Bloom—Qualitative Aspects, Based on Sugar and Amino-Acid Analyses. Mar. Chem. 1982, 11, 143–158. [Google Scholar] [CrossRef]
- Ittekkot, V.; Degens, E.T.; Brockmann, U. Monosaccharide Composition of Acid-Hydrolyzable Carbohydrates in Particulate Matter during a Plankton Bloom. Limnol. Oceanogr. 1982, 27, 770–776. [Google Scholar] [CrossRef]
- Liebezeit, G.; Bolter, M.; Brown, I.F.; Dawson, R. Dissolved Free Amino-Acids and Carbohydrates at Pycnocline Boundaries in the Sargasso Sea and Related Microbial Activity. Oceanol. Acta 1980, 3, 357–362. [Google Scholar]
- Pakulski, J.D.; Benner, R. An Improved Method for the Hydrolysis and Mbth Analysis of Dissolved and Particulate Carbohydrates in Seawater. Mar. Chem. 1992, 40, 143–160. [Google Scholar] [CrossRef]
- Benner, R.; Pakulski, J.D.; McCarthy, M.; Hedges, J.I.; Hatcher, P.G. Bulk Chemical Characteristics of Dissolved Organic-Matter in the Ocean. Science 1992, 255, 1561–1564. [Google Scholar] [CrossRef] [PubMed]
- Mopper, K. Sugars and Uronic-Acids in Sediment and Water from Black Sea and North-Sea with Emphasis on Analytical Techniques. Mar. Chem. 1977, 5, 585–603. [Google Scholar] [CrossRef]
- Sakugawa, H.; Handa, N. Isolation and Chemical Characterization of Dissolved and Particulate Polysaccharides in Mikawa Bay. Geochim. Cosmochim. Acta 1985, 49, 1185–1193. [Google Scholar] [CrossRef]
- Mopper, K.; Zhou, J.; Ramana, K.S.; Passow, U.; Dam, H.G.; Drapeau, D.T. The Role of Surface-Active Carbohydrates in the Flocculation of a Diatom Bloom in a Mesocosm. Deep Sea Res. Part II Top. Stud. Oceanogr. 1995, 42, 47–73. [Google Scholar] [CrossRef]
- Gao, Q.; Leck, C.; Rauschenberg, C.; Matrai, P.A. On the chemical dynamics of extracellular polysaccharides in the high Arctic surface microlayer. Ocean Sci. 2012, 8, 401–418. [Google Scholar] [CrossRef] [Green Version]
- Zhou, J.; Mopper, K.; Passow, U. The role of surface-active carbohydrates in the formation of transparent exopolymer particles by bubble adsorption of seawater. Limnol. Oceanogr. 1998, 43, 1860–1871. [Google Scholar] [CrossRef] [Green Version]
- Cochran, R.E.; Laskina, O.; Jayarathne, T.; Laskin, A.; Laskin, J.; Lin, P.; Sultana, C.; Lee, C.; Moore, K.A.; Cappa, C.D.; et al. Analysis of Organic Anionic Surfactants in Fine and Coarse Fractions of Freshly Emitted Sea Spray Aerosol. Environ. Sci. Technol. 2016, 50, 2477–2486. [Google Scholar] [CrossRef] [PubMed]
- Burrows, S.M.; Ogunro, O.; Frossard, A.A.; Russell, L.M.; Rasch, P.J.; Elliott, S.M. A physically based framework for modeling the organic fractionation of sea spray aerosol from bubble film Langmuir equilibria. Atmos. Chem. Phys. 2014, 14, 13601–13629. [Google Scholar] [CrossRef]
- Burrows, S.M.; Gobrogge, E.; Fu, L.; Link, K.; Elliott, S.M.; Wang, H.; Walker, R. OCEANFILMS-2: Representing coadsorption of saccharides in marine films and potential impacts on modeled marine aerosol chemistry. Geophys. Res. Lett. 2016, 43, 8306–8313. [Google Scholar] [CrossRef]
- Nakahara, H.; Lee, S.; Shoyama, Y.; Shibata, O. The role of palmitic acid in pulmonary surfactant systems by Langmuir monolayer study: Lipid-peptide interactions. Soft Matter 2011, 7, 11351–11359. [Google Scholar] [CrossRef]
- Papahadjopoulos, D. Surface Properties of Acidic Phospholipids—Interaction of Monolayers and Hydrated Liquid Crystals with Uni-and Bi-Valent Metal Ions. Biochim. Biophys. Acta 1968, 163, 240–254. [Google Scholar] [CrossRef]
- Bichsel, Y.; Von Gunten, U. Formation of iodo-trihalomethanes during disinfection and oxidation of iodide containing waters. Environ. Sci. Technol. 2000, 34, 2784–2791. [Google Scholar] [CrossRef]
- Pörtner, H.-O.; Karl, D.M.; Boyd, P.W.; Cheung, W.W.L.; Lluch-Cota, S.E.; Nojiri, Y.; Schmidt, D.N.; Zavialov, P.O. Ocean systems. In Climate Change 2014: Impacts, Adaptation, and Vulnerability. Part A: Global and Sectoral Aspects. Contribution of Working Group II to the Fifth Assessment Report of the Intergovernmental Panel on Climate Change; Cambridge University Press: Cambridge, UK; New York, NY, USA, 2014; pp. 411–484. [Google Scholar]
- Quinn, P.K.; Collins, D.B.; Grassian, V.H.; Prather, K.A.; Bates, T.S. Chemistry and Related Properties of Freshly Emitted Sea Spray Aerosol. Chem. Rev. 2015, 115, 4383–4399. [Google Scholar] [CrossRef] [PubMed]
- Kanicky, J.R.; Poniatowski, A.F.; Mehta, N.R.; Shah, D.O. Cooperativity among molecules at interfaces in relation to various technological processes: Effect of chain length on the pKa of fatty acid salt solutions. Langmuir 2000, 16, 172–177. [Google Scholar] [CrossRef]
- Wang, H.M.; Loganathan, D.; Linhardt, R.J. Determination of the Pka of Glucuronic-Acid and the Carboxy Groups of Heparin by C-13-Nuclear-Magnetic-Resonance Spectroscopy. Biochem. J. 1991, 278, 689–695. [Google Scholar] [CrossRef]
- Tang, C.Y.; Huang, Z.S.A.; Allen, H.C. Binding of Mg2+ and Ca2+ to Palmitic Acid and Deprotonation of the COOH Headgroup Studied by Vibrational Sum Frequency Generation Spectroscopy. J. Phys. Chem. B 2010, 114, 17068–17076. [Google Scholar] [CrossRef] [PubMed]
- Wellen Rudd, B.A.; Vidalis, A.S.; Allen, H.C. Thermodynamic versus Non-Equilibrium Stability of Palmitic Acid Monolayers in Calcium-Enriched Sea Spray Aerosol Proxy Systems. Phys. Chem. Chem. Phys. 2018, 20, 16320–16332. [Google Scholar] [CrossRef] [PubMed]
- Stokes, M.D.; Deane, G.B.; Prather, K.; Bertram, T.H.; Ruppel, M.J.; Ryder, O.S.; Brady, J.M.; Zhao, D. A Marine Aerosol Reference Tank system as a breaking wave analogue for the production of foam and sea-spray aerosols. Atmos. Meas. Tech. 2013, 6, 1085–1094. [Google Scholar] [CrossRef] [Green Version]
- Schill, S.R.; Collins, D.B.; Lee, C.; Morris, H.S.; Novak, G.A.; Prather, K.A.; Quinn, P.K.; Sultana, C.M.; Tivanski, A.V.; Zimmermann, K.; et al. The Impact of Aerosol Particle Mixing State on the Hygroscopicity of Sea Spray Aerosol. ACS Cent. Sci. 2015, 1, 132–141. [Google Scholar] [CrossRef] [PubMed]
- Bhattacharyya, L.; Rohrer, J.S. Applications of Ion Chromatography for Pharmaceutical and Biological Products; John Wiley & Sons, Inc.: Hoboken, NJ, USA, 2012. [Google Scholar]
- Hegg, D.A.; Covert, D.S.; Jonsson, H.H.; Woods, R.K. A simple relationship between cloud drop number concentration and precursor aerosol concentration for the regions of Earth’s large marine stratocumulus decks. Atmos. Chem. Phys. 2012, 12, 1229–1238. [Google Scholar] [CrossRef]
- Farmer, D.K.; Cappa, C.D.; Kreidenweis, S.M. Atmospheric Processes and Their Controlling Influence on Cloud Condensation Nuclei Activity. Chem. Rev. 2015, 115, 4199–4217. [Google Scholar] [CrossRef]
- Petters, M.D.; Kreidenweis, S.M. A single parameter representation of hygroscopic growth and cloud condensation nucleus activity. Atmos. Chem. Phys. 2007, 7, 1961–1971. [Google Scholar] [CrossRef] [Green Version]
- Stokes, R.H.; Robinson, R.A. Interactions in aqueous nonelectrolyte solutions. I. Solute-solvent equilibria. J. Phys. Chem. 1966, 70, 2126–2131. [Google Scholar] [CrossRef]
- Dawson, K.W.; Petters, M.D.; Meskhidze, N.; Suda Petters, S.; Kreidenweis, S.M. Hygroscopic growth and cloud droplet activation of xanthan gum as a proxy for marine hydrogels. J. Geophys. Res. Atmos. 2016, 121, 11803–11818. [Google Scholar] [CrossRef]
- Bertram, T.H.; Cochran, R.E.; Grassian, V.H.; Stone, E.A. Sea spray aerosol chemical composition: Elemental and molecular mimics for laboratory studies of heterogeneous and multiphase reactions. Chem. Soc. Rev. 2018, 47, 2374–2400. [Google Scholar] [CrossRef]
- Zobrist, B.; Soonsin, V.; Luo, B.P.; Krieger, U.K.; Marcolli, C.; Peter, T.; Koop, T. Ultra-slow water diffusion in aqueous sucrose glasses. Phys. Chem. Chem. Phys. 2011, 13, 3514–3526. [Google Scholar] [CrossRef] [PubMed]
- Tong, H.J.; Reid, J.P.; Bones, D.L.; Luo, B.P.; Krieger, U.K. Measurements of the timescales for the mass transfer of water in glassy aerosol at low relative humidity and ambient temperature. Atmos. Chem. Phys. 2011, 11, 4739–4754. [Google Scholar] [CrossRef] [Green Version]
- Prather, K.A.; Bertram, T.H.; Grassian, V.H.; Deane, G.B.; Stokes, M.D.; DeMott, P.J.; Aluwihare, L.I.; Palenik, B.P.; Azam, F.; Seinfeld, J.H.; et al. Bringing the ocean into the laboratory to probe the chemical complexity of sea spray aerosol. Proc. Natl. Acad. Sci. USA 2013, 110, 7550–7555. [Google Scholar] [CrossRef] [PubMed] [Green Version]
- Modini, R.L.; Russell, L.M.; Deane, G.B.; Stokes, M.D. Effect of soluble surfactant on bubble persistence and bubble-produced aerosol particles. J. Geophys. Res. Atmos. 2013, 118, 1388–1400. [Google Scholar] [CrossRef] [Green Version]
- Garrett, W.D. Stabilization of air bubbles at the air-sea interface by surface-active material. Deep Sea Res. Oceanogr. Abstr. 1967, 14, 661–672. [Google Scholar] [CrossRef]
- Ternes, R.L.; Berg, J.C. The effect of monolayer collapse on bubble stability. J. Colloid Interface Sci. 1984, 98, 471–477. [Google Scholar] [CrossRef]
Figure 1.
Conceptual overview of soluble organic distribution in the sea surface microlayer (SSML) for the (A) macromolecule-derived mechanism, shown here as the lipid A head group of lipopolysaccharides (LPS), (B) ion-mediated co-adsorption mechanism put forth by Burrows et al. [57] and (C) divalent cation mediated co-adsorption (this paper).

Figure 2.
Representative CCN activation spectra for the control experiment (panel A) and experiment 1 (panel B) MART experiments consisting of a starting salt matrix (red), addition of 95 μM glucose (dark blue, panel A) or glucuronic acid (light blue, panel B), and subsequent addition of 35 μM palmitic acid (green).

Figure 3.
Aerosol organic volume fraction estimates for the salt water, glucuronic acid, palmitic acid sequential addition MART experiment (E1), calculated from hygroscopicity measurements (Xorg, κ; red, error indicative of standard deviation from triplicate measurements) and IEC measurements (Xorg, IEC; blue, absolute error from IEC measurement).

Figure 4.
(A) Determinations of aerosol organic volume fraction Xorg measurements as a function of dry particle diameter for experiment 1 derived from hygroscopicity (red circle) and IEC measurements (blue square positioned at 50% size cut point). Also shown, are calculations of Xorg derived from hygroscopicity measurements made on SSA generated from seawater in the Atlantic Ocean by Quinn et al. [10]. (B) Cumulative dry aerosol mass distribution for representative, laboratory-generated SSA from Prather et al. [78].

Figure 5.
Modeled dependence of the SSA organic volume fraction (panel A, Xorg) and hygroscopicity (panel B, κ) on the fractional surface coverage of palmitic acid on the bubble film cap (Θ) and the bubble film cap thickness (l) for the addition of palmitic acid and glucose to salt water (Control Experiment, black and gray lines) and the addition of palmitic acid and glucuronic acid to salt water (Experiment 1). The shaded regions in panel B represents the range of measurements of κ.


Table 1.
Water-side concentrations of individual compounds in the Marine Aerosol Reference Tank (MART). Each experiment (control, experiment 1 (E1), experiment 2 (E2), experiment 3 (E3)) was initiated with a synthetic sea salt mixture, followed by sequential additions of soluble (+ saccharide) and insoluble (+ surfactant) organic compounds.
| Artificial Salt Water | + Saccharide † | + Surfactant † | |||||
|---|---|---|---|---|---|---|---|
| Na+ (mM) | Mg2+ (mM) | Ca2+ (mM) | Cl− (mM) | + Glucose (μM) | + Glucuronic Acid (μM) | + Palmitic Acid (μM) | |
| Control | 470 | 145 | 0 | 600 | 95 | 0 | 35 |
| E1 | 470 | 145 | 0 | 600 | 0 | 95 | 35 |
| E2 | 470 | 0 | 10 | 490 | 0 | 95 | 35 |
| E3 | 470 | 0 | 0 | 470 | 0 | 95 | 35 |
† Additions of glucose, glucuronic acid, and palmitic acid all correspond to 575 μM C. Additions were performed sequentially, such that “+ Saccharide” corresponds to artificial seawater and saccharide, and “+ Surfactant” corresponds to artificial seawater, saccharide, and surfactant.
Table 2.
Observed κ-values (3-trial average ± σ), s percent changes in κ (Δ), and corresponding aerosol organic volume fractions (Χorg, κ for each addition of the MART experiments.
Table 2.
Observed κ-values (3-trial average ± σ), s percent changes in κ (Δ), and corresponding aerosol organic volume fractions (Χorg, κ for each addition of the MART experiments.
| Artificial Seawater | + Saccharide † | +Surfactant † | |||||
|---|---|---|---|---|---|---|---|
| κ | κ | Δ | Xorg, κ | κ | Δ | XXorg, κ | |
| Control | 0.749 ± 0.010 | 0.744 ± 0.002 | −1% | 0.007 | 0.734 ± 0.001 | −2% | 0.022 |
| E1 | 0.797 ± 0.005 | 0.767 ± 0.004 | −4% | 0.041 | 0.630 ± 0.009 | −21% | 0.229 |
| E2 | 0.921 ± 0.013 | 0.907 ± 0.014 | −2% | 0.016 | 0.646 ± 0.006 | −30% | 0.323 |
| E3 | 0.892 ± 0.005 | 0.889 ± 0.026 | <−1% | 0.004 | 0.773 ± 0.013 | −13% | 0.144 |
† Additions were performed sequentially, such that “+ Saccharide” corresponds to artificial seawater and saccharide, and “+ Surfactant” corresponds to artificial seawater, saccharide, and surfactant.
Table 3.
Saccharide volume fractions (Xsaccharide, IEC) with propagated absolute errors as determined by IEC and Equation (2) for SSA particles with diameters less than 250 nm for each addition of the MART experiments.
Table 3.
Saccharide volume fractions (Xsaccharide, IEC) with propagated absolute errors as determined by IEC and Equation (2) for SSA particles with diameters less than 250 nm for each addition of the MART experiments.
| Artificial Seawater | + Saccharide | + Surfactant | |
|---|---|---|---|
| Xsaccharide, IEC | Xsaccharide, IEC | Xsaccharide, IEC | |
| Control | 2.7 × 10⁻³ ± 7.3 × 10⁻⁴ | 3.1 × 10⁻³ ± 8.4 × 10⁻⁴ | 2.4 × 10⁻³ ± 7.9 × 10⁻⁴ |
| E1 | ND † | 1.2 × 10⁻⁴ ± 4.6 × 10⁻⁵ | 4.3 × 10⁻⁴ ± 1.4 × 10⁻⁴ |
| E2 | ND † | 1.7 × 10⁻⁴ ± 5.4 × 10⁻⁵ | 4.9 × 10⁻⁴ ± 1.6 × 10⁻⁴ |
| E3 | ND † | 5.5 × 10⁻⁴ ± 1.5 × 10⁻⁴ | 7.4 × 10⁻⁴ ± 2.4 × 10⁻⁴ |
† ND = Not detected.
© 2018 by the authors. Licensee MDPI, Basel, Switzerland. This article is an open access article distributed under the terms and conditions of the Creative Commons Attribution (CC BY) license (http://creativecommons.org/licenses/by/4.0/).
Share and Cite
MDPI and ACS Style
Schill, S.R.; Burrows, S.M.; Hasenecz, E.S.; Stone, E.A.; Bertram, T.H. The Impact of Divalent Cations on the Enrichment of Soluble Saccharides in Primary Sea Spray Aerosol. Atmosphere 2018, 9, 476. https://doi.org/10.3390/atmos9120476
AMA Style
Schill SR, Burrows SM, Hasenecz ES, Stone EA, Bertram TH. The Impact of Divalent Cations on the Enrichment of Soluble Saccharides in Primary Sea Spray Aerosol. Atmosphere. 2018; 9(12):476. https://doi.org/10.3390/atmos9120476
Chicago/Turabian StyleSchill, Steven R., Susannah M. Burrows, Elias S. Hasenecz, Elizabeth A. Stone, and Timothy H. Bertram. 2018. "The Impact of Divalent Cations on the Enrichment of Soluble Saccharides in Primary Sea Spray Aerosol" Atmosphere 9, no. 12: 476. https://doi.org/10.3390/atmos9120476
Note that from the first issue of 2016, this journal uses article numbers instead of page numbers. See further details here.