Rediscovering and Reviving Old Observations and Explanations of Metabolic Scaling in Living Systems


Department of Biology, Juniata College, Huntingdon, PA 16652, USA
Systems 2018, 6(1), 4; https://doi.org/10.3390/systems6010004
Submission received: 16 December 2017
/
Revised: 18 January 2018
/
Accepted: 22 January 2018
/
Published: 29 January 2018
Abstract
:Why the rate of metabolism varies (scales) in regular, but diverse ways with body size is a perennial, incompletely resolved question in biology. In this article, I discuss several examples of the recent rediscovery and (or) revival of specific metabolic scaling relationships and explanations for them previously published during the nearly 200-year history of allometric studies. I carry out this discussion in the context of the four major modal mechanisms highlighted by the contextual multimodal theory (CMT) that I published in this journal four years ago. These mechanisms include metabolically important processes and their effects that relate to surface area, resource transport, system (body) composition, and resource demand. In so doing, I show that no one mechanism can completely explain the broad diversity of metabolic scaling relationships that exists. Multi-mechanistic models are required, several of which I discuss. Successfully developing a truly general theory of biological scaling requires the consideration of multiple hypotheses, causal mechanisms and scaling relationships, and their integration in a context-dependent way. A full awareness of the rich history of allometric studies, an openness to multiple perspectives, and incisive experimental and comparative tests can help this important quest.

1. Introduction
Discovery is the driver of science. Less appreciated is that rediscovery is also an important “jump-starter” in science. By rediscovery, I mean that the original description of a specific phenomenon, or an explanation of it, is reported again by an investigator (or set of investigators), who are unaware of the original discovery. Rediscoveries may occur independently at the same time or different times. A classic example is Mendel’s laws of heredity, proposed in 1866 largely unnoticed (including by Charles Darwin [1]), and then rediscovered independently, at least in part, by De Vries, Correns and Von Tschermak in 1900 [2,3,4]. This rediscovery was especially momentous as it stimulated the birth of modern genetics and became part of a new synthetic theory of evolution [5]. Many rediscoveries have occurred in all of the major fields of science (e.g., [6,7,8,9,10,11,12,13,14]). Revival of old, dormant ideas has also been common. These “sleeping beauties” involve a proposal of a scientific idea “ahead of its time”, and thus with little immediate fanfare, only to be “rediscovered” and revived many years later [15,16].
Why the rediscovery and revival of “new” knowledge has occurred so commonly in science, despite the careful archiving of discoveries in scientific journals, remains little understood and deserves more attention, especially by experts in the history and sociology of science [7,12]. Although I am no such expert, I suggest that rediscovery in science is probably the result of one or more of the following six major influences: (1) publication of an innovative idea or observation in an obscure place, thus causing it to go unnoticed for a long time, (2) a discovery is so novel and (or) discordant with current thought, that it is not appreciated at the time of its origin, sometimes even by the originator him(her)self, and only later is fully recognized and assimilated when the scientific culture becomes more receptive, (3) an idea is prematurely rejected, thus causing it to be forgotten or ignored until it is rediscovered and revived, (4) a tendency of investigators to focus on recent literature that is readily found on the Internet, resulting in the neglect of older, less accessible literature that eventually becomes unappreciated and often forgotten, (5) the exponential growth of the scientific literature, which has made it difficult for investigators to be aware of all relevant literature in their field, and (6) limits on space in scientific journals, thus curtailing citations of the older literature (e.g., for this reason, editors may encourage the selective citation of recent articles).
The purpose of this article is to discuss several key examples of rediscovery in allometry or biological scaling, a field that relates the relative magnitudes of various biological structures and processes to the size of a living system. I believe that this topic is timely and important because the rediscovery and revival of ideas and observations appear to have been especially common in allometric studies [17,18], and in particular those dealing with the scaling of the rate of metabolism (i.e., the transformation of energy and materials in support of various biological processes) in organisms [19], the focus of this article. Several recent papers in the field of metabolic scaling illustrate the phenomenon of scientific rediscovery or revival, including some unpublished papers recently submitted to scientific journals that I have seen as a reviewer. I hope that my discussion of these rediscoveries will help advance the study of biological scaling by encouraging careful scholarship, by providing a useful historical and conceptual foundation for this research (also see [20]), by acquainting investigators (especially beginners) with some of the old literature on metabolic scaling, which contains a treasure trove of potentially useful, but inadequately appreciated data and hypotheses, and by outlining a potentially useful perspective for resolving some of the controversies in this field. I believe that to move forward effectively, we must know (and learn from) where we have been. As Gayon (p. 757 [18]) wrote with regard to the innovative allometric research of Steven J. Gould [21]: “I take it as a good example of the close connection that can sometimes relate inventive scientific work to historical awareness.” My discussion also allows me to place many discoveries and rediscoveries (especially recent ones) in the context of a synthetic, multi-mechanistic theory of metabolic scaling recently proposed in this journal [20]. Furthermore, I hope that my article will attract readers interested in not only biological scaling and the history of science, but also more generally the nature of living systems, a major subject area of this journal.
2. Rediscovery in Metabolic Scaling
2.1. Empirical Patterns
I focus on five major empirical patterns. I discuss four in this section and a fifth in Section 3.5.
2.1.1. The 2/3-Power Scaling of Metabolic Rate
Several investigators during the 1800s and early 1900s claimed that metabolic rate is proportional to body surface area, and thus scales with body mass to the 2/3-power. However, belief in this view declined during the mid- to late-1900s, when instead most investigators assumed that metabolic rate typically (if not universally) scales with body mass to the 3/4-power (reviewed in [19]). More recently, a belief in a universal 3/4-power law of metabolic scaling has also diminished, and several investigators have revived the view that metabolic rate may scale to the 2/3 power, or nearly so, in some taxa (e.g., endotherms) and under some conditions (e.g., when the intensity of resting metabolism is high) (as reviewed in [19,20]). I explain and document this history in more detail in Section 2.1.3, Section 2.2.1 and Section 3.1.2. The context-dependency of metabolic scaling is a major theme of this article.
2.1.2. Nonlinear (Curvilinear) Scaling of Metabolic Rate
Typically, biologists use linear regression to examine empirical relationships between the size of a specific trait and the total size of a living system in log-log space. Therefore, when curvilinear interspecific scaling was reported for mammalian metabolic rate in the journal Nature in 2010 [22], it was widely regarded as a novel discovery. However, it was actually a rediscovery because curvilinear (quadratic) scaling had already been reported for mammals in three previous studies that received little notice in this regard [23,24,25], as well as independently in two other mammalian studies [26,27] and two plant studies [28,29] published in 2010. As far back as 1978, investigators had reported that interspecific metabolic scaling in mammals is nonlinear with steeper slopes occurring in large versus small mammals ([30,31] and other references cited in [19]). In 1953, Zeuthen [32] had also reported nonlinear interspecific metabolic scaling in crustaceans. Nevertheless, the rediscovery of nonlinear (curvilinear) metabolic scaling has stimulated a search for additional examples, not only for resting metabolic rate [33], but also for field metabolic rate [34,35] and other biological traits in various taxa [36,37,38]. Why nonlinear interspecific metabolic scaling occurs is unknown, but several hypotheses have been proposed (e.g., [22,25,26,27,28,29,33,34,35,39,40,41,42,43,44,45,46]). Interestingly, nonlinear metabolic scaling appears to be rare for interspecific analyses [34,43,44], but quite common for intraspecific, ontogenetic analyses (e.g., [19,47,48,49]). Nonlinear ontogenetic metabolic scaling relates to developmental changes in energetically demanding processes, such as growth, locomotion and thermoregulation (reviewed in [19,20]).
2.1.3. Relationships between Metabolic Scaling Slopes and Elevations
A recent study reported a strong negative correlation between the slopes and intercepts (normalization constants) for the scaling of basal metabolic rate, as compared among various orders of mammals [50]. This apparent discovery is actually a rediscovery. Several previous studies reported inverse relationships between the slope and intercept of metabolic scaling relationships (e.g., [19,39,51,52,53,54,55,56,57]). Although these patterns have been considered statistical or mathematical autocorrelations or epiphenomena by some investigators [21,50,51,52,53], many of them appear to be biologically meaningful, as predicted by the ‘metabolic-level boundaries hypothesis’ (MLBH) [19,39,54,55,56,57]. Inverse relationships occur between scaling slopes and elevations, even when one calculates the latter as the mass-specific metabolic rate at the midpoint of a scaling relationship, a measure not mathematically linked to the slope, thus removing the autocorrelation effect [54,55,56,57]. Moreover, the elevations of scaling relationships (and by association the slopes) often relate to various intrinsic and extrinsic factors affecting metabolic level (e.g., lifestyle, activity level, and temperature [54,55,56,57,58,59,60,61]). According to the MLBH, at high levels of resting metabolism, the scaling slope should be chiefly influenced by surface-area-related resource uptake and (or) metabolic waste (including heat) loss (thus approaching 2/3, assuming isomorphic body shapes). However, at low metabolic levels, the scaling slope should be chiefly influenced by volume-related resource demand (thus approaching 1, assuming homogeneous scaling of resource demand by various tissues or organs with different metabolic activity) ([19,39,46,56]; also see Section 3.1.2).
Other observations show that relationships between metabolic scaling slopes and elevations are not merely statistical artifacts [46,56]. For example, the slopes for active metabolic rate tend to be positively related to elevation (metabolic level), contrary to the artifact hypothesis, which predicts negative relationships (provided that the intercept is to the left of the midpoint of each body-mass range), but consistent with the MLBH [19,39,46,56,60]. The MLBH successfully predicts that as activity level (and thus metabolic level) increases, volume-related resource demand by metabolizing muscles should increasingly influence the metabolic scaling slope, thus causing it to approach 1 [39,46,56,60]. Furthermore, the MLBH predicts that over all metabolic levels for both inactive and active metabolic rates the scaling slope should exhibit a concave upward relationship with metabolic level, as observed in mammals [39,46], birds [39,46], insects [46] and chitons [58]. However, investigators should use caution when attempting to explain relationships between metabolic scaling slopes and elevations, especially when the regression lines being compared cross one another or do not overlap in body-mass range (also see [46,55]).
This example of a rediscovery shows how better knowledge of the history of a scientific field may prevent or correct mistakes of interpretation. Relationships between metabolic scaling slopes and elevations need not be statistical artifacts, but may be biologically significant. Even the analysis of [50] supports this view, because it showed that controlling for body temperature caused the negative correlation between the metabolic scaling slopes and intercepts among various mammalian orders to disappear. Body temperature may relate to metabolic level, and in turn various other biological and ecological features of a species. Elevated body temperatures in endotherms are chiefly a result of, not a driver of metabolic rate. Therefore, it is problematic to control for body temperature, when examining variation in metabolic rate in mammals (also see [62]). Correcting for effects of body temperature on metabolic rate is more appropriate for most ectotherms, which rely chiefly on external, non-metabolically generated heat.
2.1.4. Multivariate Effects of Body Size and Temperature (and Other Variables) on Metabolic Rate
For over 100 years, biologists have known that both body size and temperature importantly influence metabolic rate. In a much-cited Science article published in 2001, these effects were combined into a single multivariate equation [63], which later became the ‘master equation’ of the influential ‘metabolic theory of ecology’ (MTE) [64,65]. Soon after, a science news writer even suggested that this central equation of the MTE represents a natural law with similar significance to that of Newton’s laws of physics [66]. However, this ‘discovery’ was essentially a rediscovery (also see [67]). Eighteen years earlier, three Canadian biologists used a similar multiplicative equation (with a different formula for the exponential effect of temperature) to explain interspecific variation in resting metabolic rate in various organisms [68]. Moreover, since at least as far back as 1972, numerous investigators have used multiplicative and additive multivariate equations to explain intraspecific variation in metabolic rate in relation to not only body size and temperature [69], but also other biological and environmental factors (reviewed in [20]). Making body-size adjustments before examining temperature effects on metabolic rate and vice versa, a major method used by proponents of the MTE, has also been used for decades (e.g., [51,70,71,72]).
These earlier studies are not merely of historical interest. For example, a study of the catfish Silurus meridionalis showed that body size and temperature do not have independent effects on metabolic rate, as assumed by the MTE, but rather have significant interactive effects [73]. This study supported extensive past and recent work showing that the metabolic scaling slope in ectothermic organisms often varies with ambient temperature ([19,20,54,56,57,59,72,73,74,75,76]; also see Section 3.4), which has been ignored by proponents of the MTE. Therefore, multivariate models incorporating the effects of body size and temperature on metabolic rate should include an interactive term (e.g., [73,74]).
2.2. Theoretical Explanations
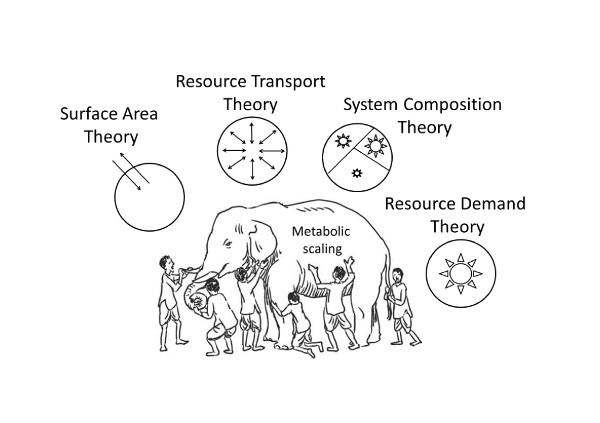
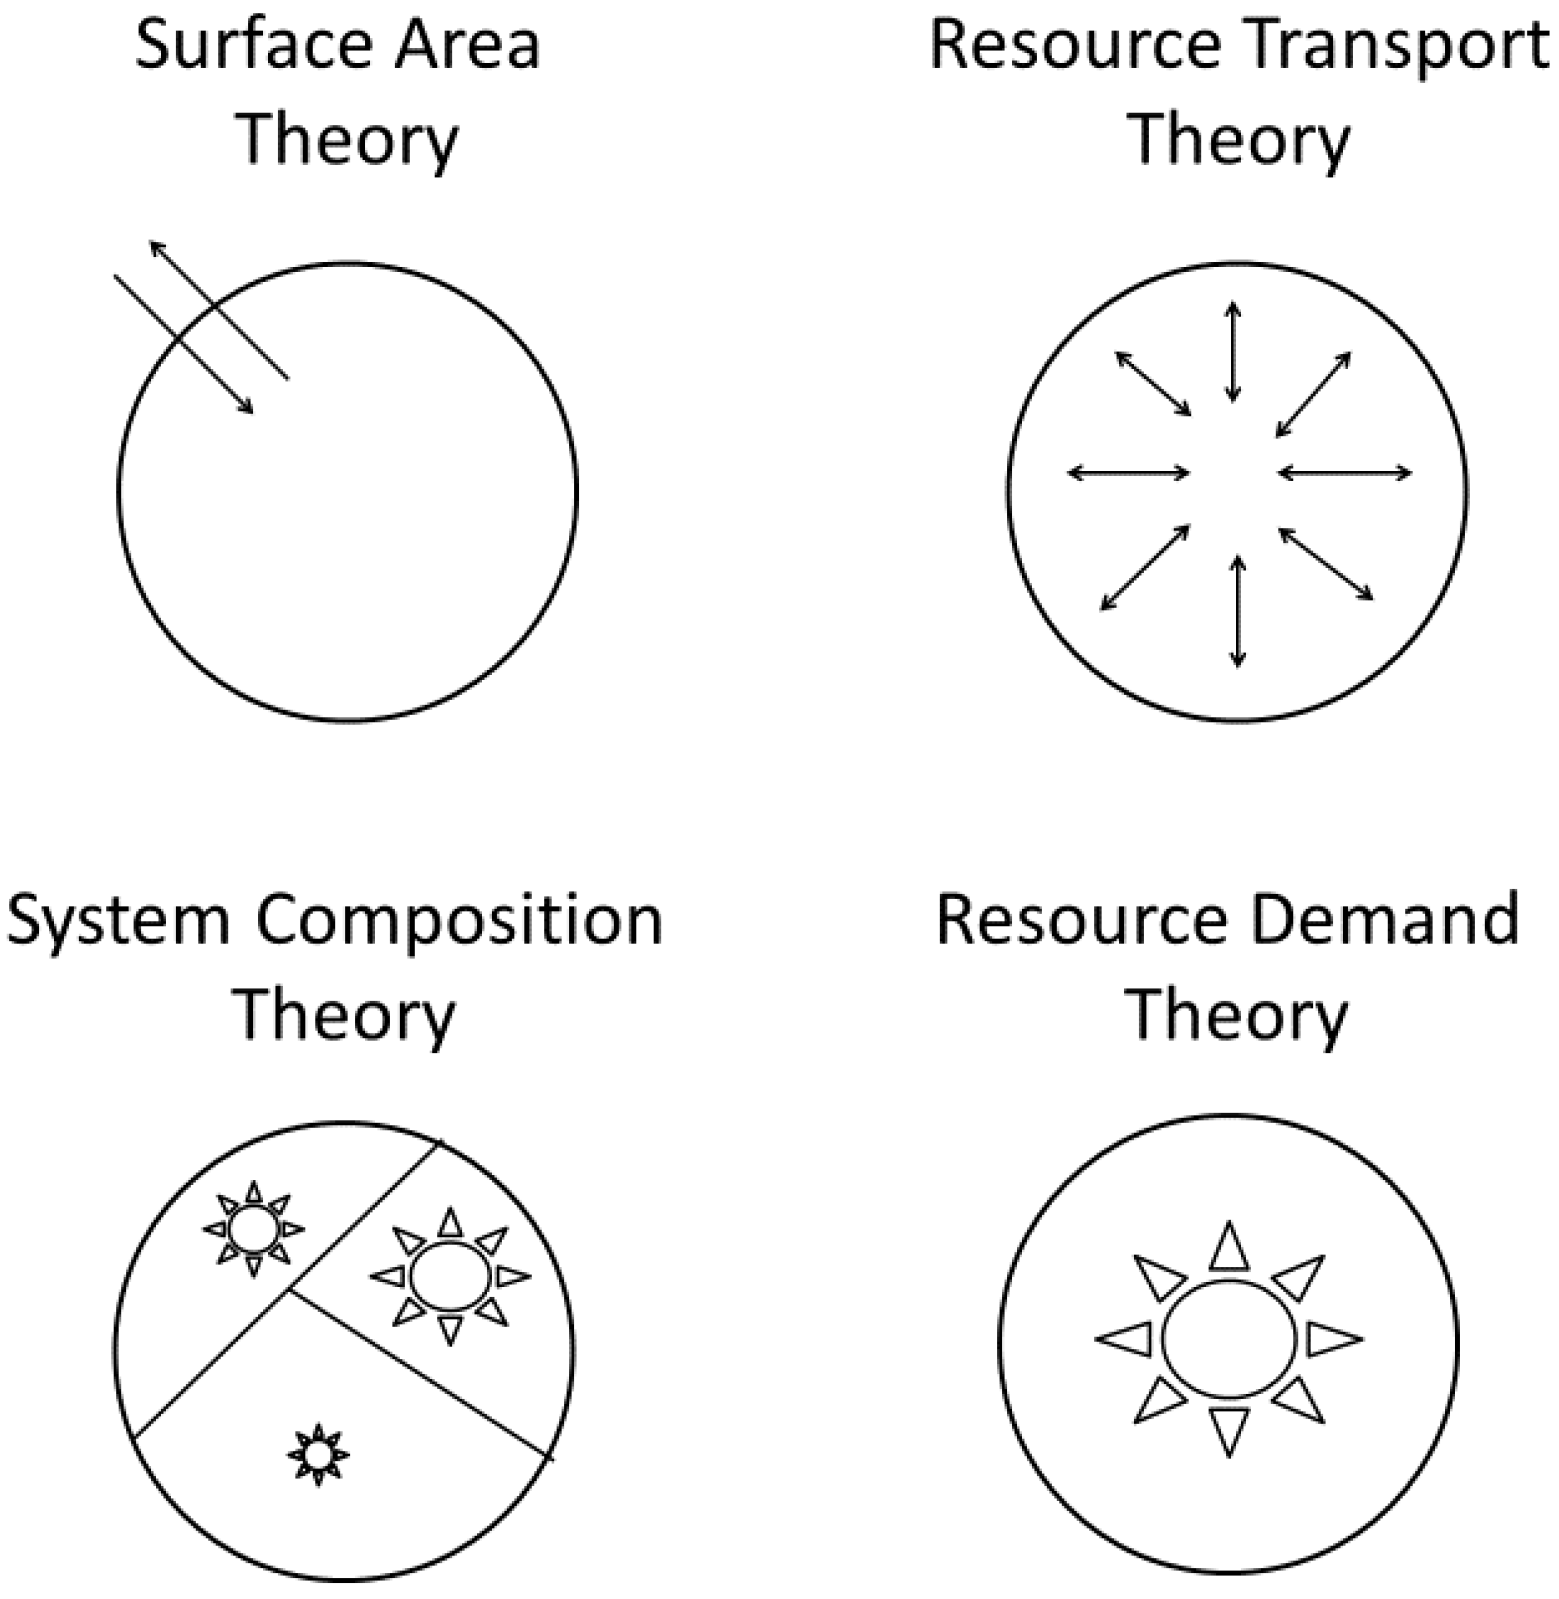
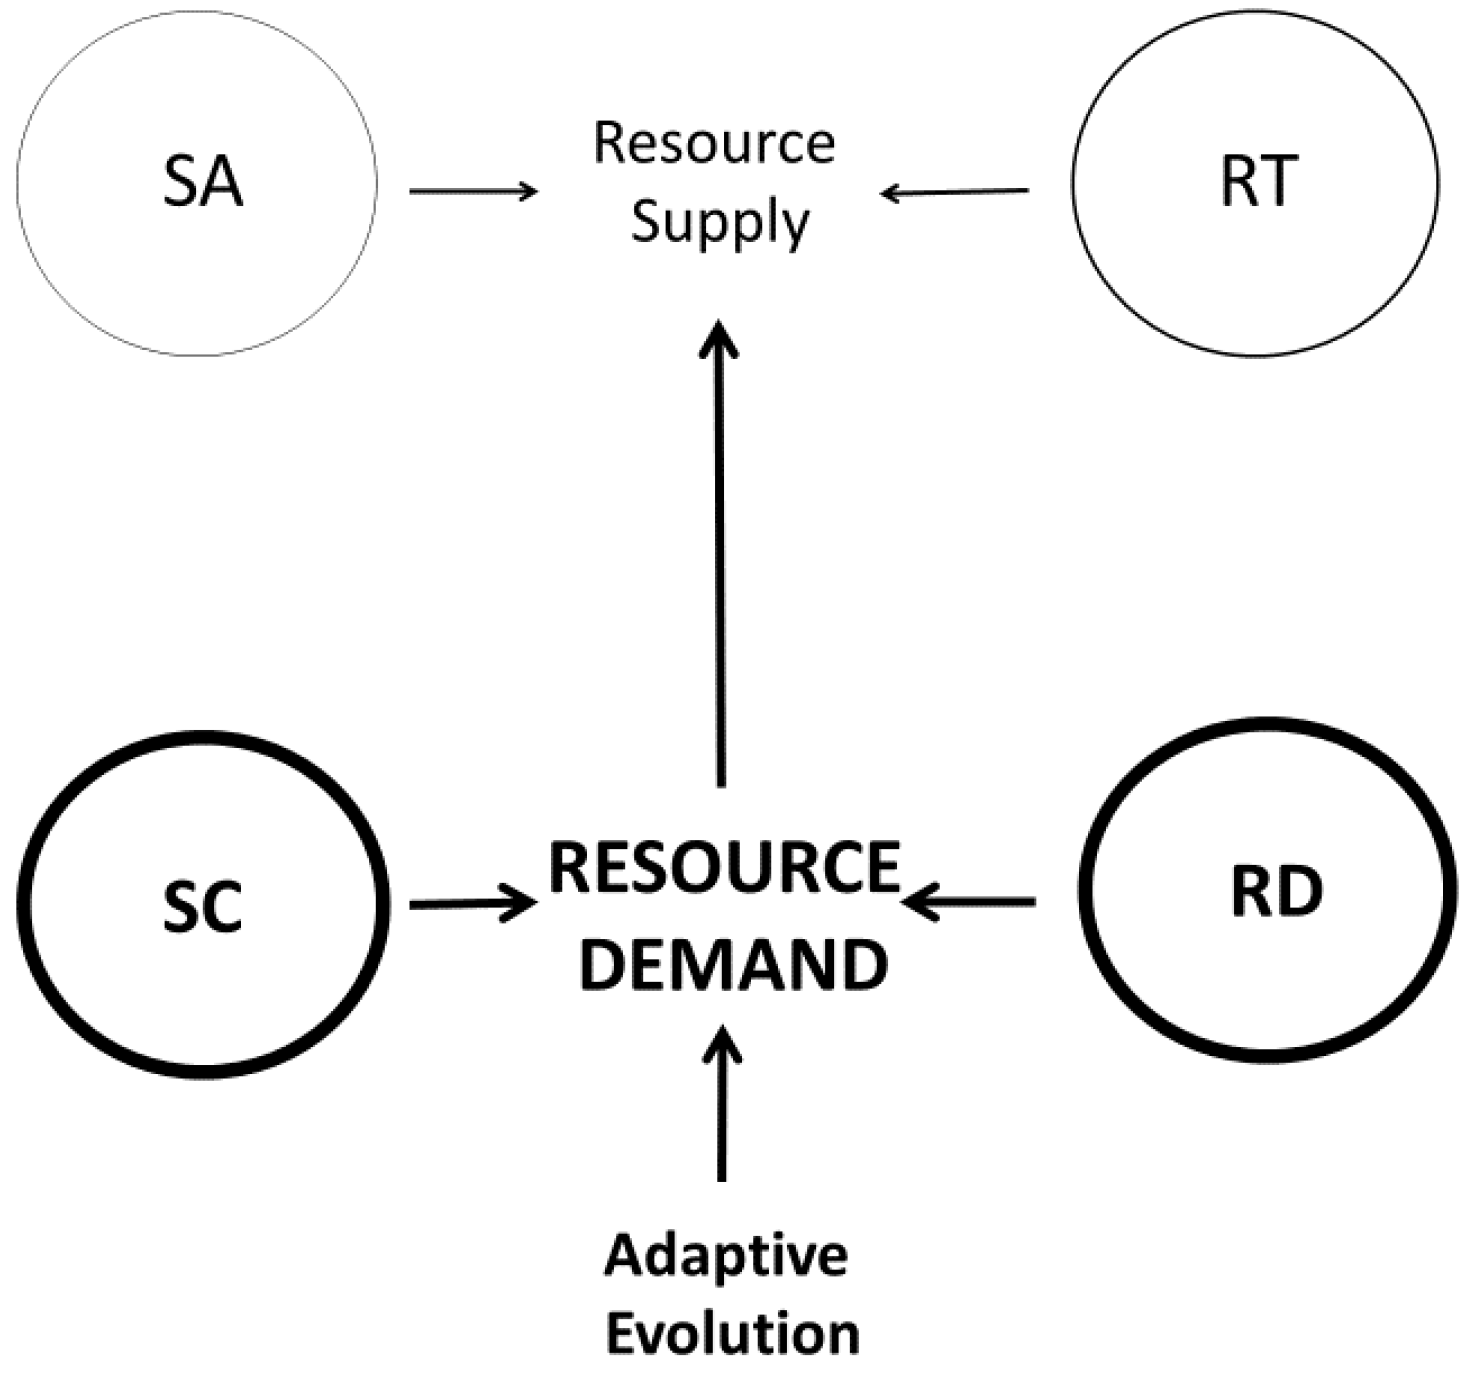
Numerous explanations of metabolic scaling have been proposed and later rediscovered and (or) revived. These include models or hypotheses invoking the effects of four-dimensional geometry, sometimes including biological time as the fourth dimension [17,77,78,79,80,81,82,83,84], the relative effects of resource supply versus demand (e.g., [19,20,46,70,85,86,87,88,89,90]), the biological regulation of metabolic rate (e.g., [20,87,90,91,92,93,94,95,96,97,98]), and various adaptive effects resulting from interactions with ecological factors (e.g., [19,20,46,99,100,101,102,103,104,105,106,107]). Here I focus on four major, much-discussed theoretical approaches encompassed by the ‘contextual multimodal theory’ (CMT) of metabolic scaling (Figure 1) recently proposed in this journal [20].
2.2.1. Surface-Area Models
The earliest known explanation of metabolic scaling (proposed in 1839) posited that maintenance of a constant body temperature in many kinds of birds and mammals requires that thermoregulatory heat production exactly balance heat loss, which is proportional to body surface area. Since surface area should scale with body volume or mass to the 2/3-power in isomorphic animals, heat loss and compensatory metabolic heat production should also scale to the 2/3-power [108]. During the late 1800s and early 1900s, multiple studies of intraspecific metabolic scaling in various species of birds and mammals supported this simple model [109,110,111], which came to be called the “surface law” [91,92]. However, in the 1930s, interspecific comparisons of various birds and mammals with a broad range of body sizes indicated that the metabolic scaling slope was closer to 3/4 than 2/3 [91,112]. Hemmingsen (1960) later reported metabolic scaling exponents near 3/4 in not only endothermic animals, but also ectothermic animals, and even unicellular organisms [70]. As a result, the 3/4-power (Kleiber’s) law was canonized as the predominant (if not universal) pattern of metabolic scaling [17,51,63,64,65,66,70,80,84,92,113,114,115,116]. Many investigators (but surprisingly not Kleiber himself, a founder of the 3/4-power law) rejected the thermoregulatory surface-area model of metabolic scaling, because it seemed incapable of explaining 3/4-power scaling, especially in ectothermic organisms that do not actively maintain constant body temperatures (see also [20]). Furthermore, the metabolic scaling slope does not necessarily approximate the theoretical values of 2/3 or 3/4, but may vary extensively between ~0 and >1, in association with differences in taxonomic affiliation, lifestyle, developmental stage, physiological status, and various ecological factors (e.g., [19,20,23,24,26,27,32,34,39,44,45,46,47,48,49,54,55,56,57,58,59,60,61,72,73,74,75,76,99,100,101,102,103,104,105,106,107,117,118,119,120,121]).
Although thermoregulatory surface-area (SA) models are not applicable to all metabolic scaling relationships, they may still apply in specific cases, e.g., in endotherms that maintain nearly constant, high body temperatures. In this context, during the last two decades, several investigators have revived the previously rejected thermal approach ([19,20,27,39,41,46,56,85,97,122,123,124], but see [125,126]). In particular, metabolic heat production compensating for surface-area-related heat loss figures importantly in various heat-flow models [41,122,124], the metabolic-level boundaries hypothesis (MLBH) [19,39,46,56], and the heat dissipation model [123], as applied specifically to endotherms. Multiple observations support thermoregulatory SA models, including the close similarity between the body-mass scaling of body surface-area, heat loss and metabolic heat production in resting birds and mammals and those exposed to cold in a He-O2 atmosphere with high thermal conductivity [20,39,41,46,56,127,128], the close similarity between the scaling of basal metabolism in huddled mammals and that of the exposed surface area of a huddle [20], and the similar scaling of metabolic heat production and thermal conductance in birds and mammals at low ambient temperatures (e.g., 0 °C) [129].
Although the effects of heat exchange on metabolic scaling are clearly important in endotherms, some investigators have suggested that they apply to organisms generally, including ectotherms [122,130]. However, one of these models [122] makes predictions that are not supported by available data (i.e., it incorrectly predicts lower scaling slopes in ectotherms vs. endotherms: see data in [19,39,46,117]). The other model [130] predicts paradoxically opposing results under different conditions (i.e., that higher heat dissipation should be associated with lower scaling exponents in resting animals, but higher scaling exponents in active animals). This model also assumes that heat dissipates outward from the body to the environment, and ignores reverse heat flow. Although thermoregulation in endotherms typically involves net outward flow of heat to the environment, the opposite often happens in ectotherms (e.g., during basking), which can significantly alter body temperature and metabolic rate.
Another class of SA models that focuses on surface-area-related resource uptake and metabolic waste excretion shows more promise for explaining metabolic scaling in ectotherms, at least in part. These models have been discussed since the 1930s ([131] and other references cited in [19]). Recent studies of pelagic invertebrates have revived these models. In pelagic animals that have integuments permeable to respiratory gases, nutrients and wastes, the scaling of the rates of metabolism (oxygen consumption) and excretion of metabolic wastes matches that for estimated body surface area ([132,133,134]; but see [135]). However, it is still unknown whether surface-area-related material exchange rates constrain metabolic rate in skin-breathing pelagic invertebrates. The opposite may also have occurred. Body shape and associated surface area may have evolved to match metabolic demand [133]. This reverse causation likely explains parallel scaling of gill surface area and metabolic (oxygen consumption) rate in amphipod crustaceans [136] and perhaps fishes, as well [137,138] (also see Section 3.3).
In any case, the effects of surface-area-related resource uptake and metabolic waste excretion on metabolic scaling are likely contingent on specific biological and ecological conditions. For example, matches between the scaling of metabolic rate and body surface area should occur in skin-breathing animals, but not in arthropods or other animals with impervious exoskeletons, as was observed [132]. In addition, the MLBH predicts that surface-area-related resource uptake and metabolic waste excretion (or heat loss) should most influence the scaling of resting metabolic rate when the metabolic intensity of an animal is high. This hypothesis predicts that the scaling exponent should decrease (approaching 2/3) with increasing resting metabolic level, as has been frequently observed both within and among species with respect to differences in lifestyle, physiological status and ambient temperature [19,39,54,55,56,57,59,72,73,74,75,76].
SA models may also inform metabolic scaling relationships at multiple hierarchical levels, including the cell, tissue, individual and social group. Above I have already described some applications of SA models to metabolic scaling at the levels of individuals and social groups (also see [20]). As for the cellular level, in the 1950s, Davison [139,140] postulated that metabolic scaling depends on whether body size increases by increasing cell size, cell number or both. He assumed that larger cells should have lower mass-specific metabolic rates because they have less metabolically active cell membrane (surface area) per cell volume for transport of ions and metabolites. Therefore, if body size increases by cell enlargement, the metabolic scaling exponent should be 2/3; if by cell multiplication, the exponent should be 1; and if by both, the exponent should be between 2/3 and 1. However, this model received little attention (but see [21,141]) until it was rediscovered nearly 50 years later [142]. Since that time, many investigators have discussed the cell-size model, including providing additional theoretical formulations, conceptual justifications, and empirical tests [19,20,56,97,105,106,130,143,144,145,146,147,148]. However, so far the model has received mixed empirical support [19,20,97,105,106,139,140,141,142,143,145,149,150,151,152,153,154,155].
The surface-area approach may also be relevant at the tissue level. According to a recent version of Dynamic Energy Budget (DEB) theory, the surface area of internal storage depots affects the flow of nutrients to somatic cells, and consequently the relationship of metabolic rate to body size [156]. This storage-dynamics model predicts that larger animals should have proportionately more storage material with low metabolic activity, and proportionately less structural tissue with high metabolic activity, thus causing a negative allometry of metabolic rate (log-log slope < 1). However, although mammals show positive allometry of fat (lipid) mass [17], as predicted, insects exhibit isometry of lipid mass (slope ~ 1) [157], contrary to this model. Therefore, the negative allometry of metabolic rate in both of these taxa [39,92,115,116,119,127,143] does not appear to relate consistently to the scaling of storage mass. Other evidence also indicates that the scaling of metabolic rate and storage mass need not relate (see Section 2.2.3). In addition, although DEB theory predicts steeper scaling of metabolic rate in small versus large mammals [156], the opposite actually occurs (see Section 2.1.2).
2.2.2. Resource-Transport Models
A highly cited model of metabolic scaling published in the journal Science in 1997 invoked resource-supply limits resulting from the geometry and physics of internal resource-transport networks [158]. According to this model and others like it ([80,84,159,160,161,162]; and other references cited in [19,20]), as body size increases, the average travel distance and energetic/structural costs for resource distribution to metabolizing cells increases, which reduces the rate at which cells receive oxygen and nutrients, thus decreasing mass-specific metabolic rate. However, these resource-transport network (RTN) models are not entirely novel, but represent partial rediscoveries and reformulations of explanations already proposed as early as the 1800s [108,163]. Sarrus and Rameaux (1839) noted that metabolic rate should be proportional to blood flow [108]; and Hoesslin (1889) proposed a physical model to explain the 2/3-power surface law as being the result of geometric and physical limits on blood flow, thus resulting in oxygen limitation to metabolizing cells [163]. Kleiber (1961) also argued that metabolic rate and the rate of circulation of oxygen- and nutrient-laden blood should be co-adjusted. In doing so, he specified many of the same assumptions as those used in the 1997 RTN model [158], including that capillary size, blood pressure and blood velocity are body-size independent constants, that blood volume is directly proportional to body mass, and that metabolic rate is related to the efficiency of oxygen transport. Notably, both Hoesslin and Kleiber used the principles of geometric similarity, as have recent RTN models. Further studies anticipated modern RTN models, including those that proposed that the fractal-like nature of circulatory systems affects metabolic scaling [164,165].
Again, this discussion is not merely of historical interest, because several early workers, including Kleiber, realized that oxygen supply via the circulatory system unlikely causes the scaling of basal (resting) metabolic rate in birds and mammals, but has become adjusted to the metabolic demand required (see also [20]). For example, over 150 years ago, Regnault and Reiset [166] observed that the metabolic rates of rabbits and dogs are unchanged by exposure to atmospheric oxygen levels 2–3 times above normal [167]. In the mid-1900s, several investigators also discounted the effects of oxygen supply limits on metabolic scaling because excised tissues continue to show allometric metabolic scaling in the presence of high oxygen levels (e.g., [168,169]). In addition, Kleiber [92] discussed several lines of evidence (based largely on the work of Krogh [170]) indicating that the anatomy and functioning of circulatory systems, and thus the delivery of oxygen and other resources to metabolizing cells, are more a response to metabolic demand, than a constraint on it (as also corroborated by several recent studies reviewed in [20]). For example, capillary number and use vary markedly with activity level and associated metabolic demand of muscle tissue ([92,170] and references cited in [20]). Furthermore, Bertalanffy [94] noted that hemodynamic resource transport (RT) models do not apply to many kinds of organisms without closed circulatory systems or with no circulatory systems at all. For these reasons, RT models were not widely accepted explanations for metabolic scaling during most of the 1900s. However, apparently many modern workers have been unaware of this history, and during the last two decades, RT models were again proposed and became widely regarded as fundamental, universal explanations of metabolic scaling. In response, some biologists have recently rediscovered or revived the argument that oxygen-supply limits cannot be a universal explanation for metabolic scaling, thus undermining RTN models. For example, Harrison [106] recently assembled extensive evidence (some of it new) contradicting oxygen limitation as a general mechanism, including that oxygen availability to cells is not lower in large versus small animals, contrary to that predicted. Other workers have also discussed additional lines of evidence contradicting the predictions of RTN models (e.g., [19,20,46,97,98,132,133,134]). For instance, cells extracted from homogeneous tissues and cultured in vitro in oxygen- and nutrient-rich media often exhibit lower, rather than higher metabolic rates than those in vivo [reviewed in [97]), contrary to that predicted by RTN models [171,172]. In addition, studies of several kinds of animals show that aerobic capacity need not limit the rates of growth and metabolism ([98]. Furthermore, although RTN models predict that the metabolic scaling exponent should be lower in organisms that grow primarily in two rather than three dimensions, the opposite occurs in diverse pelagic invertebrates [132,133].
Nevertheless, RTN models continue to enjoy wide acceptance and application, despite having the least amount of direct (mechanistic) empirical support compared to the three other major theoretical approaches discussed here (see [20] and also Section 3.2). New RTN-based models (e.g., [84,173,174,175,176]) or applications (e.g., [22,172,177]) continue to appear that have not sufficiently heeded the history of accumulating negative evidence against the assumptions, logic and predictions of previous RTN models.
A new approach has even invoked costs of resource transport at the cellular level rather than at the systemic, whole-body level [130]. Like previous cell-size models [139,140,142], this RT model predicts that if body size increases by increasing cell size, the metabolic scaling slope should be 2/3, whereas if it increases by cell number the slope should be 1, and if body size increases by increasing both cell size and number, the slope should be between 2/3 and 1. However, according to this RT model, increased transport distances and costs within larger cells cause these patterns, rather than decreased mass-specific metabolic activities related to cross-membrane transport of ions, nutrients and metabolic wastes that are associated with decreased cell membrane surface area per cell volume, as postulated by SA models [139,140,142]. Currently, data are not available to distinguish between these possibilities, which are not mutually exclusive. In any case, tests of the identical predictions of the SA and RT versions of the cell-size model have produced mixed support (see Section 2.2.1). Most support comes from scaling analyses at the intraspecific (ontogenetic) level (the focal level of the RT model [130]; but see [152,155]), whereas support at the interspecific level is weaker. For example, although cell-size models correctly predict the hypometric (negatively allometric) scaling (slope ~ 0.75) among species of insects [145], they do not for mammals. These models predict that interspecific metabolic scaling in mammals should be nearly isometric (log-log slope ~ 0.98–0.99, calculated as b = 1 − a/3 [138], where a = the scaling slope for cell mass in relation to body mass ~0.03–0.05 [17,141]), but actually mammalian basal metabolic rate scales with a much lower slope (≤0.75) [39,92,115,119,127] (cf. [113,178]). The RT model of [130] attempts to account for this disparity by also invoking additional effects of heat dissipation, which are especially important in endotherms (see also [56,85], and Section 2.2.1). However, the RT cell-size model (as well as SA cell-size models) cannot explain allometric metabolic scaling observed in vitro for freshly excised homogeneous tissue cells of similar size taken from donor animals encompassing diverse body sizes ([179] and other references cited in [19,20,92,144]). Nor can it explain isometric or near isometric metabolic scaling observed in some unicellular eukaryotes (e.g., [54,180,181,182,183]), or isometric or hypermetric (positively allometric) scaling (slopes ≥ 1) observed in prokaryotic cells [54,182,184,185].
2.2.3. System-Composition Models
During the last four decades, several investigators have rediscovered or revived system-composition (SC) models of metabolic scaling (e.g., [25,28,29,85,89,99,106,156,167,186,187,188,189,190]; and other references cited in [19,20]). These models focus on how body-size-related changes in the relative proportions of system components (e.g., tissues and organs) with different metabolic activities affect the scaling of metabolic rate. For example, DEB theory postulates that the hypometric (negatively allometric) scaling of metabolic rate (slope < 1) observed among species within specific taxa is the result of increased proportions of storage mass with low metabolic activity in species with larger body sizes [85,156]. In addition, Wang and colleagues reported that changes in the relative proportions of tissues (organs) with high versus low metabolic activity could explain the hypometric scaling of basal metabolic rate in mammals [189,191]. Similarly, Harrison [106] recently suggested that the negative allometry of metabolic rate in animals is in part the result of decreased proportions of neurosensory tissues (including the brain and various sensory organs) with high metabolic activity in larger species. However, largely forgotten investigators in the 1930s first developed the SC approach (reviewed in [20]). For example, Kestner (1936) claimed that the hypometry of metabolic rate in mammals results entirely from decreases in the relative masses of highly metabolically active tissues and organs, including the brain and central nervous system, heart, liver, kidneys and other viscera [192]. However, in the mid-1900s, influential workers (e.g., [92,93,94]) rejected SC models as general explanations for metabolic scaling, which led to their temporary dormancy until the 1980s.
In the wake of revived interest, recent studies have provided mixed support for SC models (also see [20]). At the intraspecific level, the hypometry of metabolic rate of various fish species relates, at least in part, to increases in the relative masses of tissues with low metabolic activity (e.g., fat and skeletal tissues), and decreases in the relative masses of tissues with high metabolic activity (e.g., brain, heart, kidney, hepatopancreas, and digestive tract) during growth (e.g., [152,186,187]. Supportive results also exist for plants [190,193], humans [194] and cladocerans [195], but not for amphipods [105,196] and insects [49]. In the freshwater amphipod Gammarus minus, the inter-population variation in the scaling of resting metabolic rate is unrelated to the scaling of relatively metabolically inert fat and skeletal materials [105].
At the interspecific level, whole body scaling analyses of the metabolic activity of multiple tissues and organs in mammals support SC models [189,191], but analyses of specific tissues or organs have yielded mixed results (also see [113]), possibly in part because they have not considered the metabolic effects of all tissues and organs, which may interact in various ways. For example, SC models, including DEB theory [85,156] are supported by the positive allometry of fat mass in mammals [17], and of ‘dead wood’ in plants [28,29], but they are contradicted by the isometry of fat and skeletal tissues in insects [157,197] (see also Section 2.2.1). Furthermore, a study designed to test SC effects showed that hypometric metabolic scaling is not caused by a positive allometry of either fat or exoskeletal materials in 15 species of carabid beetles [198]. In fact, both fat and exoskeletal masses showed negative allometry, the opposite of that predicted. In addition, three major lines of evidence contradict or limit the applicability of the neurosensory SC component of the models of [106,192]. First, the concave upward scaling of basal metabolic rate in mammals is opposite of the scaling of brain mass, which is concave downward [34]. Second, several mammal studies have shown that basal metabolic rate is weakly or non-significantly correlated with brain size, after controlling for the effect of body size and other relevant factors (e.g., [199,200,201,202,203,204]). If a functional link exists between brain mass and metabolic rate, it may only occur in eutherian mammals, which have long periods of placental nutrient provisioning of offspring [202]. Furthermore, this possible link may involve an effect of maternal metabolic rate (and thus rate of energy provisioning) on neonatal brain growth ([205,206,207]; but see [208]), rather than a direct effect of the high-energy use of the adult brain on metabolic rate, as suggested by some investigators (e.g., [106,192,200,209]. This hypothesis is consistent with a lack of a positive correlation between body-size adjusted metabolic rate and adult brain mass in animal taxa without prolonged intrauterine development, including birds [210], marsupials [202,211] and teleost fishes [212,213], which also contradicts the models of [106,192]. However, future research should examine whether these non-significant relationships arise from compensatory effects of other metabolically active organs. Third, the neurosensory SC component of the models of [106,192] obviously does not apply to organisms without brains, including plants and some simple sedentary animals [214].
The above results suggest that although SC models may be useful in specific cases, they do not constitute a complete and universal explanation of metabolic scaling (also see [20]). In further support of this point, they obviously cannot explain hypometric metabolic scaling observed in homogeneous tissues [92,93,97,113,168,179]. In any case, investigators should not ignore SC models when attempting to explain metabolic scaling (also see [89,167]). They may even have value at multiple levels of biological organization, including cells and social groups (see [20]). For example, recent work on ant colonies suggests that their frequently observed hypometric metabolic scaling may be the result of decreases in the relative frequencies of active versus inactive ants in larger colonies ([215,216], but see [217]). This constitutes a SC effect at the colony level.
2.2.4. Resource-Demand Models
During the last four decades, several investigators have rediscovered or revived resource-demand (RD) models of metabolic scaling (e.g., [46,56,85,87,89,90,98,103,105,106,167]; and other references cited in [19,20]). These models consider how the resource demand of various whole body processes, such as growth, locomotion and thermoregulation, affect the scaling of metabolic rate [19,20,46,56]. Here I focus on explanations involving the metabolic demand of growth and development, which are especially relevant to body-size scaling [19,85,98,103,105,106,136,193,218,219,220,221]. Most of these explanations (including DEB theory) consider how changes in growth rate during ontogeny affect the scaling of metabolic rate [19,85,98,103,105,136,193,218,219,220,221]. As with SC models, growth-based RD explanations of metabolic scaling originated in the 1930s and 1940s ([222,223,224]; reviewed in [20]), but most modern investigators appear to be unaware of this work.
Strong empirical support for growth-based RD models exists at the intraspecific level. Several studies in diverse species of plants [193], invertebrates [103,105,136,219,220,222] and vertebrates [218,221,223,224] have shown that increased growth rate is associated with steeper ontogenetic scaling of metabolic rate (slopes often approaching 1) (also see 19,20,98]. This support involves not only numerous correlative analyses, but also multiple experimental manipulations. For example, Teissier (1931) showed that nutrition-enhanced growth rate resulted in steeper scaling of metabolic rate in mealworm larvae (Tenebrio molitor) [222]. A similar outcome occurred in brown garden snails (Cornu asperum, formerly Helix aspersa), whose growth rate had been increased by artificial selection for increased body size [220]. A natural experiment involving varying natural selection on growth rate in amphipod populations living in springs with versus without visually hunting fish predators also revealed a close match between the ontogenetic scaling of the rates of growth and metabolism [105,136].
However, few investigators have considered how ontogenetic growth and development may affect interspecific metabolic scaling [19,106,225]. As one possible explanation, Glazier [19] speculated that ectothermic vertebrate animals exhibit steeper metabolic scaling than endothermic vertebrates because of differences in their post-maturational growth. Growth has a high energy cost [226], and thus post-maturational growth may elevate metabolic rate more in large versus small ectotherms, because the former grow more (though also longer) to reach larger sizes. The optimal evolutionary strategy may be for large, long-lived ectothermic vertebrates to expend relatively more energy on growth throughout their lifetimes, compared to small, short-lived species selected to divert more resources to reproduction. By contrast, growth should not significantly affect the metabolic scaling slope of adult endotherms, which exhibit little or no post-maturational growth [226]. However, this and related hypotheses discussed in [19,225] remain to be tested. More recently, Harrison [106] suggested that small animals have higher mass-specific metabolic rates than larger animals in part because they expend more energy for metabolically expensive growth. However, two major lines of evidence contradict this hypothesis, at least as a universal explanation. First, it cannot explain why basal metabolic rate estimated in adult birds and mammals scales hypometrically with body mass, because these animals show little or no post-maturational growth [214,226]. Second, rates of growth and metabolism are unrelated across species of birds [227] and mammals [228], and vertebrates generally [38,229], after controlling for body-size differences. By contrast, recent studies on birds report significant associations between rates of whole body growth and cell metabolism in tissue cultures [230,231]. In any case, interspecific associations between growth and metabolism are more likely to occur in growing juvenile animals, as observed in nestling songbirds at three different latitudes [232]. Empirical support for growth-based RD models at the interspecific level is presently weak for adult multicellular organisms. These models may best apply to immature multicellular organisms and to unicellular organisms, whose growth and metabolism interrelate inextricably (cf. [19,54,85]). For example, the hypermetric scaling of growth rate among species of unicellular prokaryotes may help explain their similarly steep scaling of metabolic rate (as suggested by [20] based on data in [182,233]).
Several recent studies have also rediscovered or revived the view that metabolic scaling results from resource demand intrinsically controlled at the cellular level. Kleiber [91,92,169] and Glazier [20] reviewed the early history of this viewpoint. Recent investigators have implicated membrane composition and function [89,167,179,234], mitochondrial activity and number [97,179,235,236,237], intracellular transport costs [130], DNA content [182,190], and other biochemical factors [238], as importantly involved in the intrinsic cellular control of metabolic scaling. Evidence for and against various specific aspects of this approach can be found in [19,20,89,91,92,93,94,130,167,169,235,236,237,238,239,240,241,242,243]. A major limitation of the cell-based RD approach is that it cannot explain by itself why the hypometric scaling of cellular metabolic rate is lost in cells cultured in vivo (reviewed in [20,97]). Nor can it explain by itself why the metabolic scaling slope varies in relation to body shape, developmental stage, physiological condition, and various ecological factors (e.g., [19,20,46,56,103,105,107,132,133]). The cell-based RD approach focuses on proximate causes at the cellular level, but ignores proximate systemic causes and ultimate (evolutionary) causes of metabolic scaling relationships (also see [20]).
3. Outlook
At this point, it should be clear that no one mechanism can fully explain the diversity of metabolic scaling relationships that have been observed within and among species. Consequently, many investigators now appreciate that a truly comprehensive theory of metabolic scaling must include multiple mechanisms (e.g., [19,20,27,46,56,85,87,89,90,130,147,156,167,176,179,182,214,244]).
3.1. Multi-Mechanistic Approaches
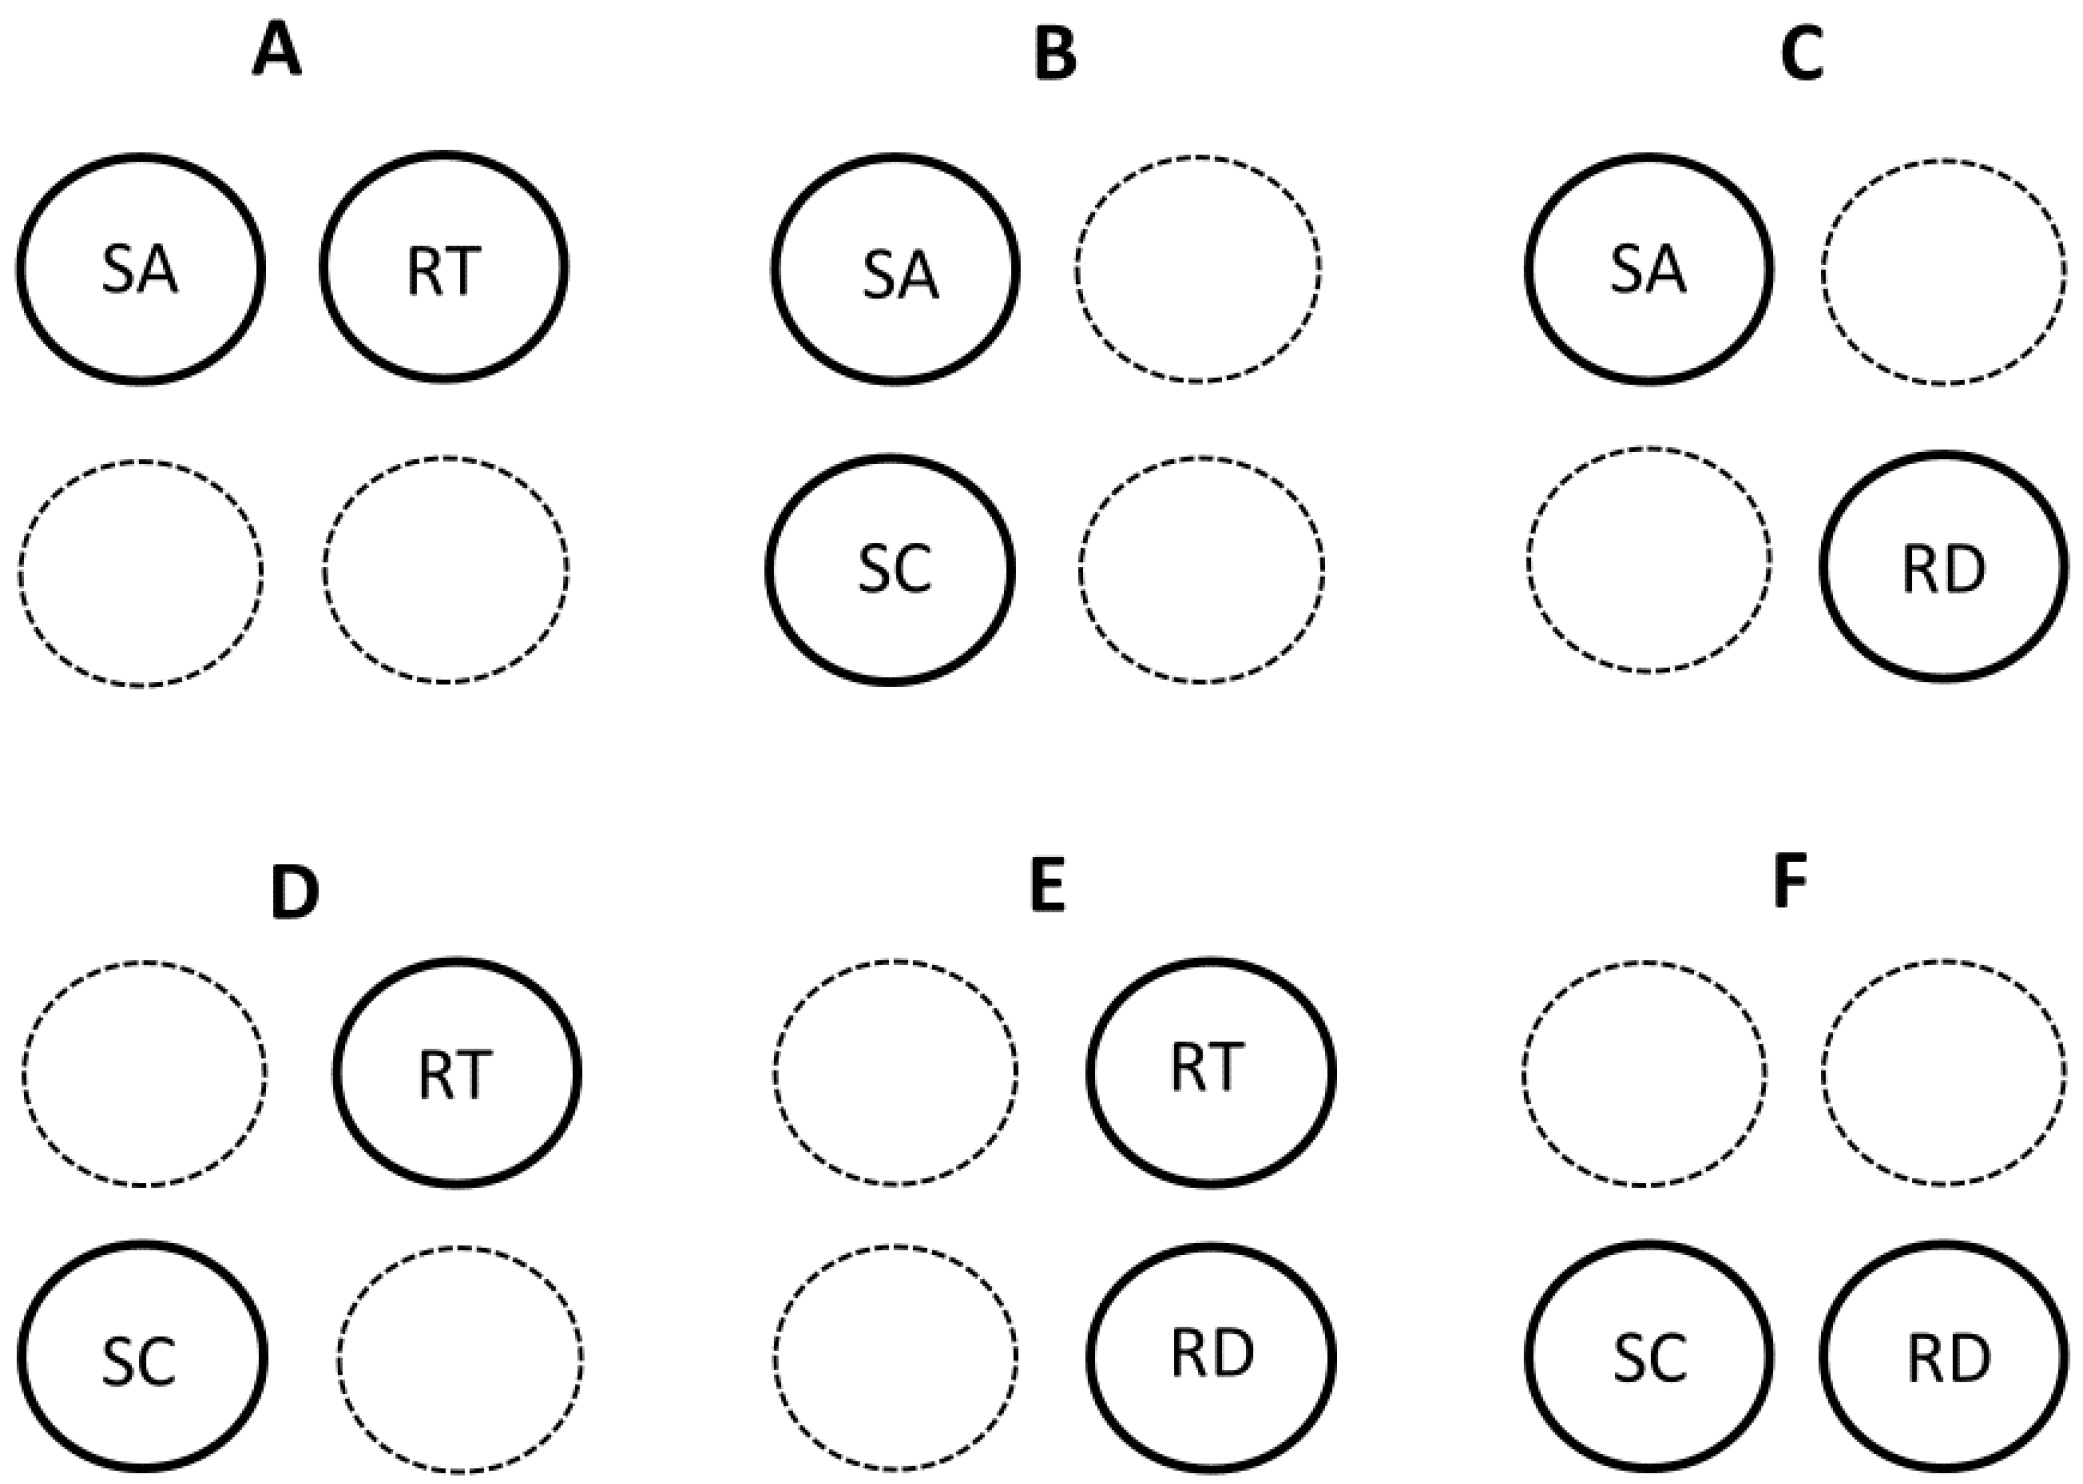
Here I briefly discuss several recent models or hypotheses that contain multiple mechanisms. I categorize several of these multi-mechanistic models according to their use of four possible component mechanisms or theoretical approaches represented by the contextual multimodal theory (CMT) of metabolic scaling [20]. All of these multi-mechanistic models include at least two modal mechanisms (Section 3.1.1) (Figure 2), whereas only three of them comprise three or four modal mechanisms (Section 3.1.2) (Figure 1, Figure 3 and Figure 4).
3.1.1. Models with Two Major Mechanisms
Collectively, the multi-mechanistic models so far proposed include all possible binary combinations of the four modal mechanisms (SA and RT, SA and SC, SA and RD, RT and SC, RT and RD, and SC and RD: see Figure 2). SA-RT models include those that combine the effects of resource transport inside the body and across internal body surfaces [80], the effects of heat flow inside the body and across external body surfaces [122], the effects of SA-related heat dissipation in small mammals and RT effects in large mammals [27], and the effects of intracellular RT and body-SA-related heat dissipation [130]. The SA-SC model of [148] combines the effects of surface-area related processes of cells with variation in the body composition of cells of different size. The metabolic-level boundaries hypothesis (MLBH) is primarily a SA-RD model (but see Section 3.1.2) that postulates that the relative effects of SA-related and volume (RD)-related processes on metabolic scaling vary with metabolic level [19,39,46,56]. RT-SC models combine the effects of resource-transport networks with effects of unequal tissue metabolic rates [176,245]. The RT-RD model of [86] considers the balance between RT-related resource supply and resource demand. SC-RD models focus on the combined effects of unequal tissue metabolic rates with resource demands at the cellular [25,89,167,246] or organismal levels [106].
Other kinds of mechanistic combinations are possible, as well. For example, integration of the MLBH with the cell-size model helps explain why the cell-size model by itself is unsuccessful in explaining specific metabolic scaling relationships (e.g., of resting endotherms, as compared to dormant, hibernating or strenuously active animals [56]). This integration also deepens our understanding of why the scaling slope for resting metabolic rate decreases with increasing metabolic level: it may be the result of increased effects of SA-related processes at not only the organismal level, but also the cellular level [56,147]. Furthermore, when metabolic level is controlled, an increase in cell size (entailing a decrease in cellular SA/volume) should cause the metabolic scaling slope to decrease toward 2/3, as shown by a comparison of four cyprinid fish species [147].
3.1.2. Models with Three or Four Major Mechanisms
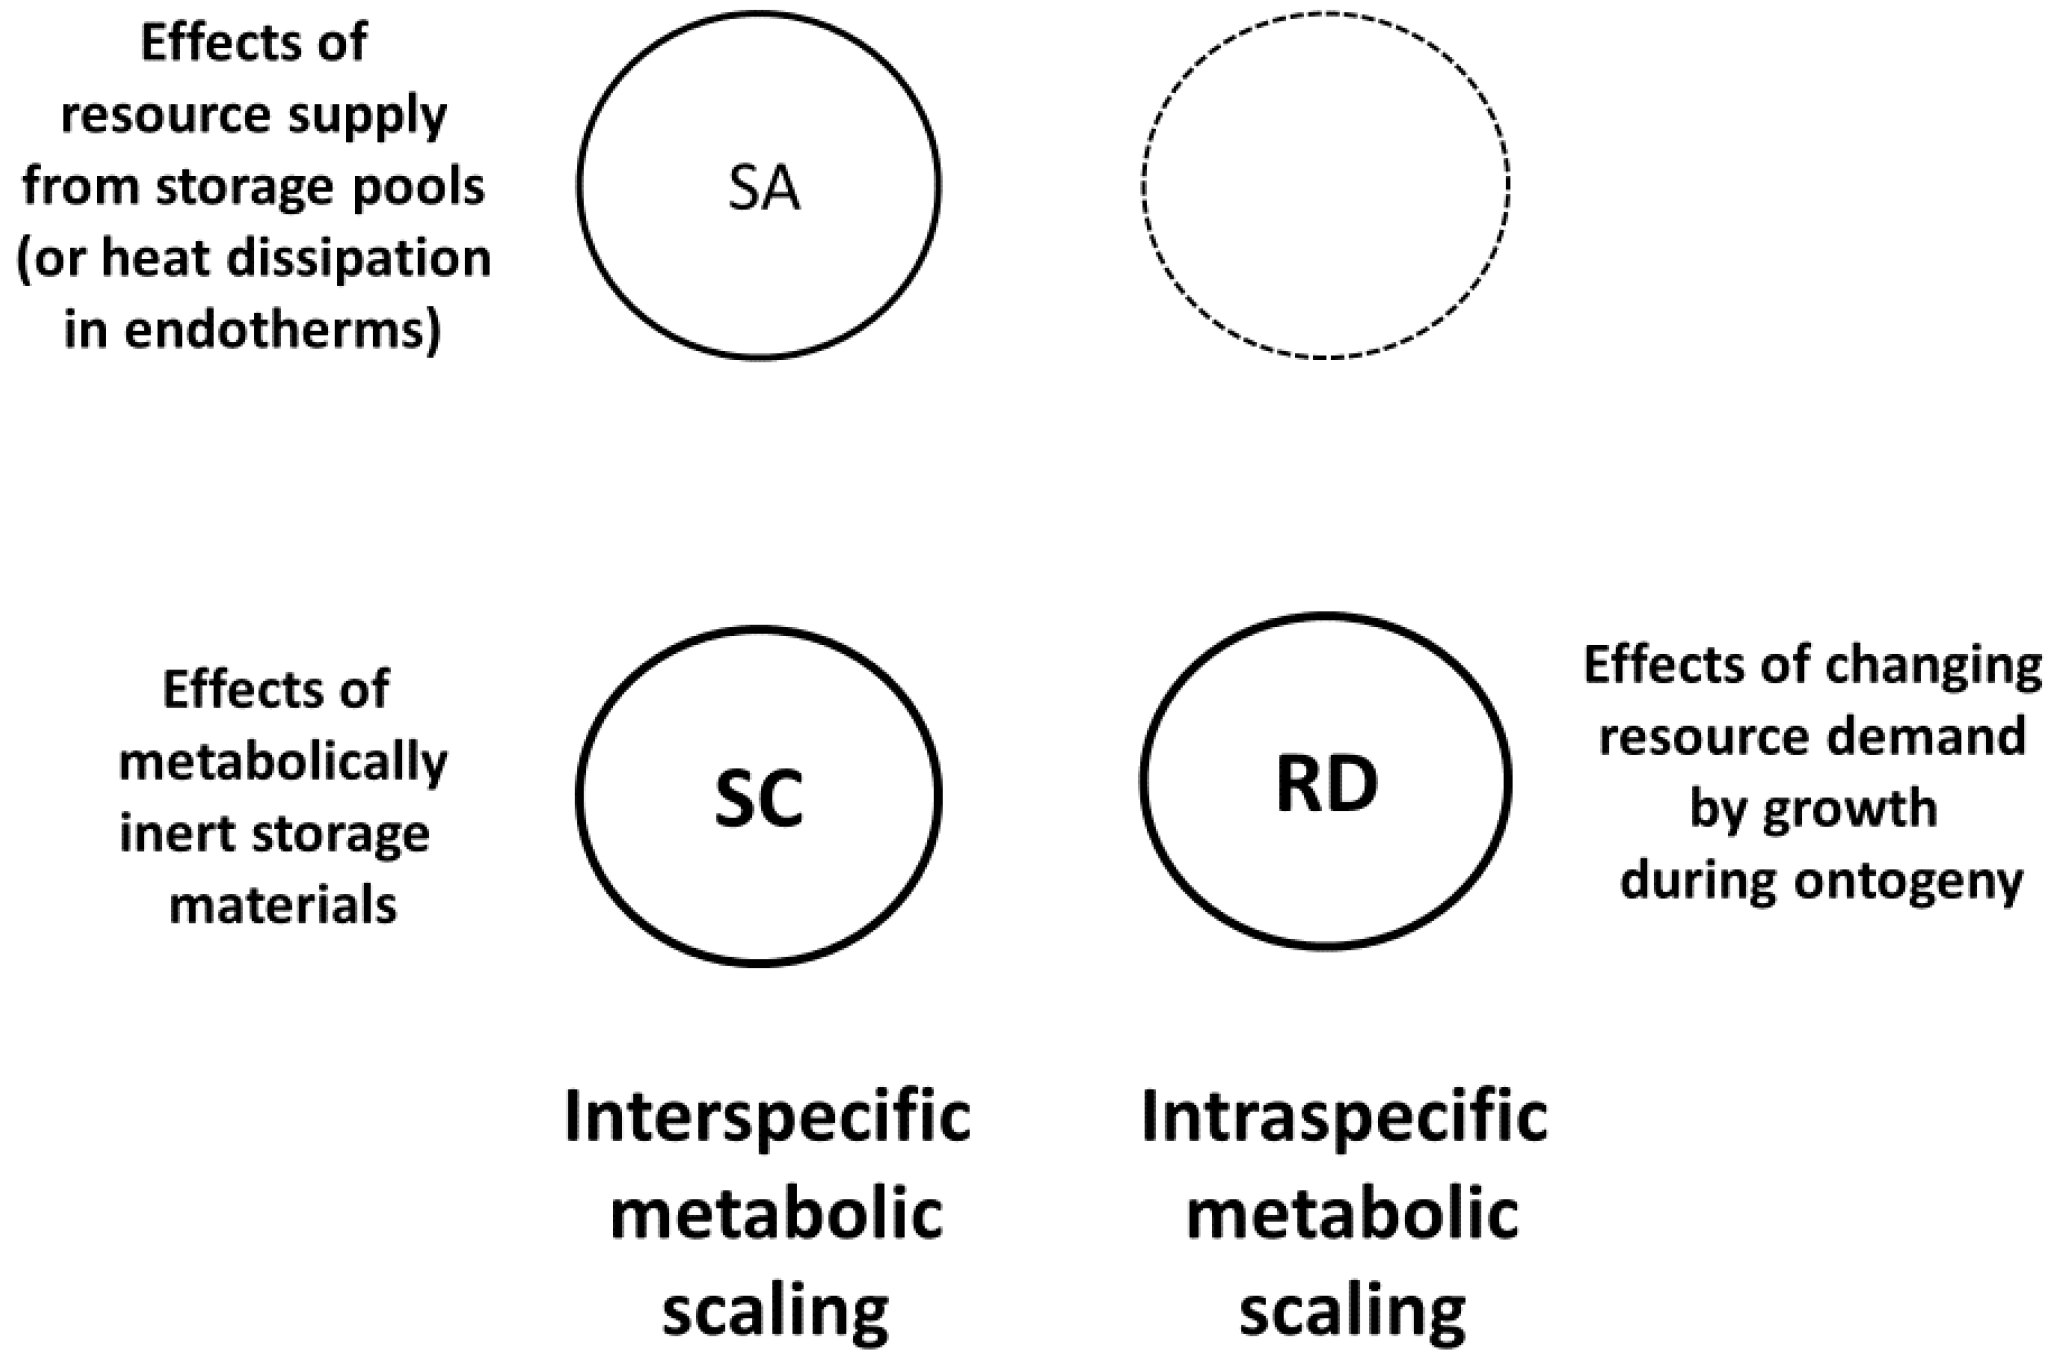
I know of only three theories of metabolic scaling that embrace three or four of the possible modal mechanisms: DEB theory (Figure 3), the MLBH (Figure 4) and the CMT (Figure 1). DEB theory includes SA, SC and RD effects. According to this theory, SA and SC mechanisms are involved in how storage material supposedly affects interspecific metabolic scaling in a universal way ([85,156]; also see Section 2.2.1 and Section 2.2.3). DEB theory also invokes SA-related heat-dissipation effects to explain why the scaling slope of basal metabolic rate in endotherms is near 2/3, a special case [85]. In addition, this theory posits that intraspecific metabolic scaling relates to changing resource demands for growth during ontogeny ([85]; also see Section 2.2.4).
Although the MLBH is primarily a SA-RD model (see Section 3.1.1; Figure 2), as originally proposed, it also included the possibility of RT effects at high metabolic levels (Figure 4 [19,46]). However, recent applications of this model have ignored RT effects (based on the theory of [158,159,160,161,162]) because they apply only to a small subset of all living species (e.g., vertebrate animals with closed circulatory systems) (also see Section 3.2). The MLBH successfully predicts covariation between metabolic scaling slopes and elevations even in organisms with open circulatory systems or none at all [19,46,54,56,58,59].
The CMT includes all four modal mechanisms (Figure 1). According to the CMT, each of these mechanisms only applies under specific biological and ecological conditions. This ‘meta-mechanistic’ approach encompasses both DEB theory and the MLBH, and helps to explain their limits of application. All three approaches include the contingent effects of SA-related heat dissipation in endotherms. SC effects may not always explain interspecific metabolic scaling, as claimed by DEB theory (see Section 2.2.3), because other SA and RD effects (as postulated by the MLBH) may be more important in specific cases. The CMT also allows for SC effects on intraspecific metabolic scaling, which current DEB theory ignores (see [20]). In addition, the CMT explains why the MLBH does not always make accurate predictions. For example, the MLBH predicts that the metabolic scaling exponent should approach 1, as the level of resting metabolism decreases. However, SC effects may cause the scaling exponent to be significantly <1, even when metabolic level is low, as observed in trees and ticks, which accumulate large amounts of metabolically inert structural material as they grow (Figure 4; also see [20]). In these cases, isometric metabolic scaling should occur only when the masses of metabolically active tissues are considered.
3.2. Mechanistic Approaches with Most Empirical Support
Four years ago, Glazier [20] assessed the relative empirical support for each of the four modal mechanisms of the CMT. Surprisingly, he claimed that the most widely known and applied mechanism (based on resource-transport network theory [80,86,158,159,160,161,162]) had the least amount of empirical support. This remains true today. Direct empirical support (rather than indirect correlative evidence) for RT effects on metabolic scaling has yet to appear, even though the much-acclaimed RTN theory of West and colleagues [158] is now over 20 years old. Moreover, several lines of evidence contradict predictions of RTN models (see Section 2.2.2 and reviews of [19,20,46,98,106]). Only the SA and RD mechanisms, which figure importantly in DEB theory and the MLBH, have direct empirical support, including corroborative experimental evidence (reviewed in [20]). Obviously, further tests of all four modal mechanisms are required.
3.3. Causal Interrelationships among Multiple Mechanisms
Another incompletely resolved issue is how the four modal mechanisms relate causally. Some theoretical approaches emphasize effects of resource supply, which then constrain resource demand, whereas others emphasize effects of resource demand, to which resource supply must adjust to maintain a positive energy balance. Others argue that resource supply and demand reciprocally influence each other, and thereby have become co-adjusted (see reviews in [19,20,98,106]).
For example, RTN models assume that resource supply, constrained by RT networks, dictates resource (metabolic) demand [80,86,158,159,160,161,162]. However, evidence against resource-supply limits (see Section 2.2.2) suggests that reverse causation may be operating, i.e., that resource demand may often dictate metabolic rate and the resource supply required. Primary effects of RD mechanisms are supported by shifts in metabolic scaling related to changes in various demand processes, including growth, locomotion, heat production, and food processing [20,46,56,98]. In addition, the anatomy and functioning of RT networks are malleable and change significantly in response to increased resource demand (e.g., as caused by energy-expensive exercise and milk production, reviewed in [20]). Furthermore, numerous biochemical kinetic studies show that the rates of several kinds of metabolic reactions are controlled by ATP demand, rather than by substrate supply, contrary to common belief (reviewed in [19,98]). Accordingly, Harrison [106] has recently argued that resource-demand processes, including both SC and RD effects, primarily cause metabolic scaling (Figure 2 and Figure 5). Consequently, resource supply, as controlled by SA and RT mechanisms, secondarily responds to match and thereby support resource demand (Figure 5).
Although SC and RD mechanisms may often be primary drivers of metabolic scaling, SA mechanisms may also be critical in specific cases [214]. For example, thermoregulatory SA models posit that SA-related heat dissipation requires compensatory metabolic heat production to maintain constant body temperatures in endotherms. Both experimental and comparative work support this view (see [20,97] and Section 2.2.1). In addition, high metabolic activity in resting organisms (as related to energetic lifestyles or high temperatures) may often cause SA (and possibly RT) mechanisms to influence metabolic scaling more than RD mechanisms (Figure 4). This view is supported by frequently observed inverse correlations between the slopes and elevations of metabolic scaling relationships, both within and among species, as predicted by the MLBH [19,20,46,56,129]. Experimental manipulations of environmental temperature and oxygen concentrations, as well as of respiratory surface areas, also support primary effects of SA mechanisms on metabolic scaling in specific contexts (see reviews in [19,20]). For example, lunged salamanders permitted to breath both air and water exhibit steeper metabolic scaling than those allowed to breathe only water [247]. Similarly, lunged salamanders exhibit steeper metabolic scaling than lungless salamanders [248,249]. Pulmonate snails that breathe relatively high-oxygen air also exhibit significantly higher metabolic rates than prosobranch snails of equivalent size that breathe relatively low-oxygen water [250]. In addition, close associations between the scaling of metabolic rate and the SA of respiratory structures or of the body in skin-breathing animals (e.g., [132,133,136,251,252,253,254]) suggest that SA mechanisms are often importantly involved in metabolic scaling, if not as primary drivers, at least as necessary providers of required resources. Metabolic scaling may often involve a regulatory co-adjustment between resource supply and demand [20]. Although workers in the mid-1900s argued that biological regulation is important in metabolic scaling (e.g., [92,93,94]), this view has been largely dormant and I predict will be revived (cf. [20,90,95,96,97,98]), as is occurring in studies of morphological scaling (e.g., [255]).
3.4. Relative Effects of Intrinsic and Extrinsic Factors
Consideration of the causal (mechanistic) basis of metabolic scaling raises critical questions about the relative roles of intrinsic and extrinsic factors in these relationships. Traditionally, metabolic scaling theory has focused on intrinsic properties of organisms and their cells, including body shape and structure, tissue metabolic requirements, and cell size, structure and function. This approach has tended to emphasize proximate (functional) causes, rather than ultimate (evolutionary) causes. RTN models exemplify this intrinsic approach [80,84,86,158,159,160,161,162]. Even though RTN models use evolutionary optimization arguments, their proponents typically regard these models as universally applicable, or nearly so, regardless of organism or environment. The primary causal mechanism involves internal constraints of RT networks that limit resource supply to metabolizing cells, and thus collectively whole-body metabolic rate, which in turn energizes various other biological processes. The metabolic theory of ecology (MTE), which is based on RTN models, extends this flow of causation to include effects of metabolism on the rates of various ecological and evolutionary processes [64,65]. In short, the MTE emphasizes the primary intrinsic control of metabolic rate, which then acts as a ‘pacemaker’ for all other biological and ecological processes (cf. [98]). According to the MTE, temperature (an extrinsic factor) also affects metabolism, but does so independently of body size, thus altering the elevation, but not slope of metabolic scaling relationships (also see Section 2.1.4). According to this view, intrinsic factors primarily cause the scaling slopes of metabolism and other associated processes. Ecological factors are only of secondary importance and chiefly affect the elevation, rather than slope of metabolic scaling relationships.
However, three major lines of evidence indicate that metabolic scaling slopes are not solely the result of intrinsic factors (i.e., “engineering” [62]), but also strongly respond to extrinsic (environmental) factors. First, changes in temperature can affect not only the elevation, but also the slope of metabolic scaling relationships, both within and among species (see Section 2.1.4), as predicted by the MLBH [19,46,54,56,57,59,129] and the viscosity hypothesis of Verberk and Atkinson [256]. Second, several other kinds of abiotic and biotic factors may influence metabolic scaling slopes (reviewed in [19,20,56,103,121]). Third, evidence is growing that RTN-constrained supply of oxygen and nutrients does not universally, or even typically control metabolic rate and its scaling with body size (see Section 2.2.2 and Section 3.3). In many cases, metabolic rate is affected by various resource-demand processes that are in turn influenced by diverse physiological, behavioral and ecological factors [19,20,46,56,57,58,60,98,99,103,105,106,212,257]. Contrary to the MTE view, metabolic rate may not always be a pacemaker for other biological and ecological processes (reviewed in [98]; also see [51,244,257,258]). Recognition of demand-side effects on metabolic scaling opens up numerous possibilities for how extrinsic (ecological) factors may affect these relationships [20]. For example, Glazier and colleagues [105] have shown how visually hunting fish predators significantly alter the ontogenetic scaling of energy-expensive growth (a RD process), and in turn the scaling of metabolic rate in the freshwater amphipod G. minus. Daan and colleagues [99] also argued that increased adult mortality risk in small, short-lived versus large, long-lived birds selected for higher parental energy expenditure and an associated larger metabolic machinery (including proportionately larger brains, hearts, and other visceral organs) in smaller birds, thus causing a hypometric scaling of basal metabolic rate. Harrison [106] later rediscovered and elaborated on this ecological SC explanation [214]. In addition, ecological factors may influence the role of SA-related processes in metabolic scaling. For example, in G. minus, the presence of fish predators has not only affected the scaling of metabolic rate, but also the scaling of gill surface area, and thus the capacity to uptake oxygen needed for metabolism [136]. High temperatures may also increase the influence of SA-related processes on metabolic scaling, as postulated by the MLBH [19,46,56,57,59]. In addition, significant parallel shifts in the scaling of body SA and metabolic rate occur in association with major ontogenetic habitat shifts (e.g., from pelagic larvae to benthic adults) in many aquatic invertebrates [133]. The influence of adaptive evolution, as mediated by various ecological factors, on SA, SC and RD mechanisms of metabolic scaling, is schematically depicted in Figure 6 (also see Figure 4 and Figure 5 in [20]).
In short, extrinsic (ecological) factors may have primary effects on metabolic scaling [20,98,99,100,101,102,103,104,105,106,107], rather than merely secondary effects, as postulated by models based on intrinsic physical and biological properties [63,64,158,159,160,161,162]. Glazier and colleagues [105] have recommended the development of an “ecological theory of metabolism” (ETM), as an alternative (or complement) to the MTE (cf. [20,45,46,98,106,121,195]). According to the MTE, metabolic rate and its scaling with body mass affect various ecological phenomena, whereas in opposite fashion, the ETM considers how various ecological factors affect metabolic rate and how it scales with body mass. An ETM offers more promise for explaining the broad diversity of metabolic scaling relationships and their associations with various ecological factors than does the MTE, which invokes an ideal 3/4-power law for the body-size scaling of metabolic rate that is unaffected by ecology. Incisive experimental and comparative studies are now much needed to distinguish the relative effects of resource supply versus demand, and of intrinsic versus extrinsic factors on metabolic scaling [19,20,106,121].
3.5. The Diversity of Metabolic Scaling
I recommend that future theoretical work on metabolic scaling should break free of an alluring fixation on a specific idealized metabolic scaling exponent (e.g., 2/3 or 3/4), and embrace the full diversity of exponents that exists that is not merely the result of statistical error. Over 100 years ago, Krogh [259] published the first power functions for metabolic rate in a variety of ectothermic and endothermic animals, and showed that no one scaling exponent could describe them all (also see [260]). In keeping with the overall theme of my article, this discovery of metabolic scaling diversity was rediscovered many times during the 1900s (e.g., [23,32,261,262,263]), but largely ignored in favor of a 3/4-power law. Only during the last two decades, has a true appreciation of the broad diversity of metabolic scaling relationships been spreading widely (see e.g., [19,20,24,26,27,33,34,39,44,46,50,54,55,56,57,58,103,105,106,107,117,118,121,132,142,143,147,149,153,182,193,219,225,260,264,265]), thus helping to stimulate the development of multi-mechanistic explanatory models (see Section 3.1). The recognition of diversity is not necessarily a hindrance to the development of general theory, as sometimes thought (cf. [19,20]).
4. Conclusions
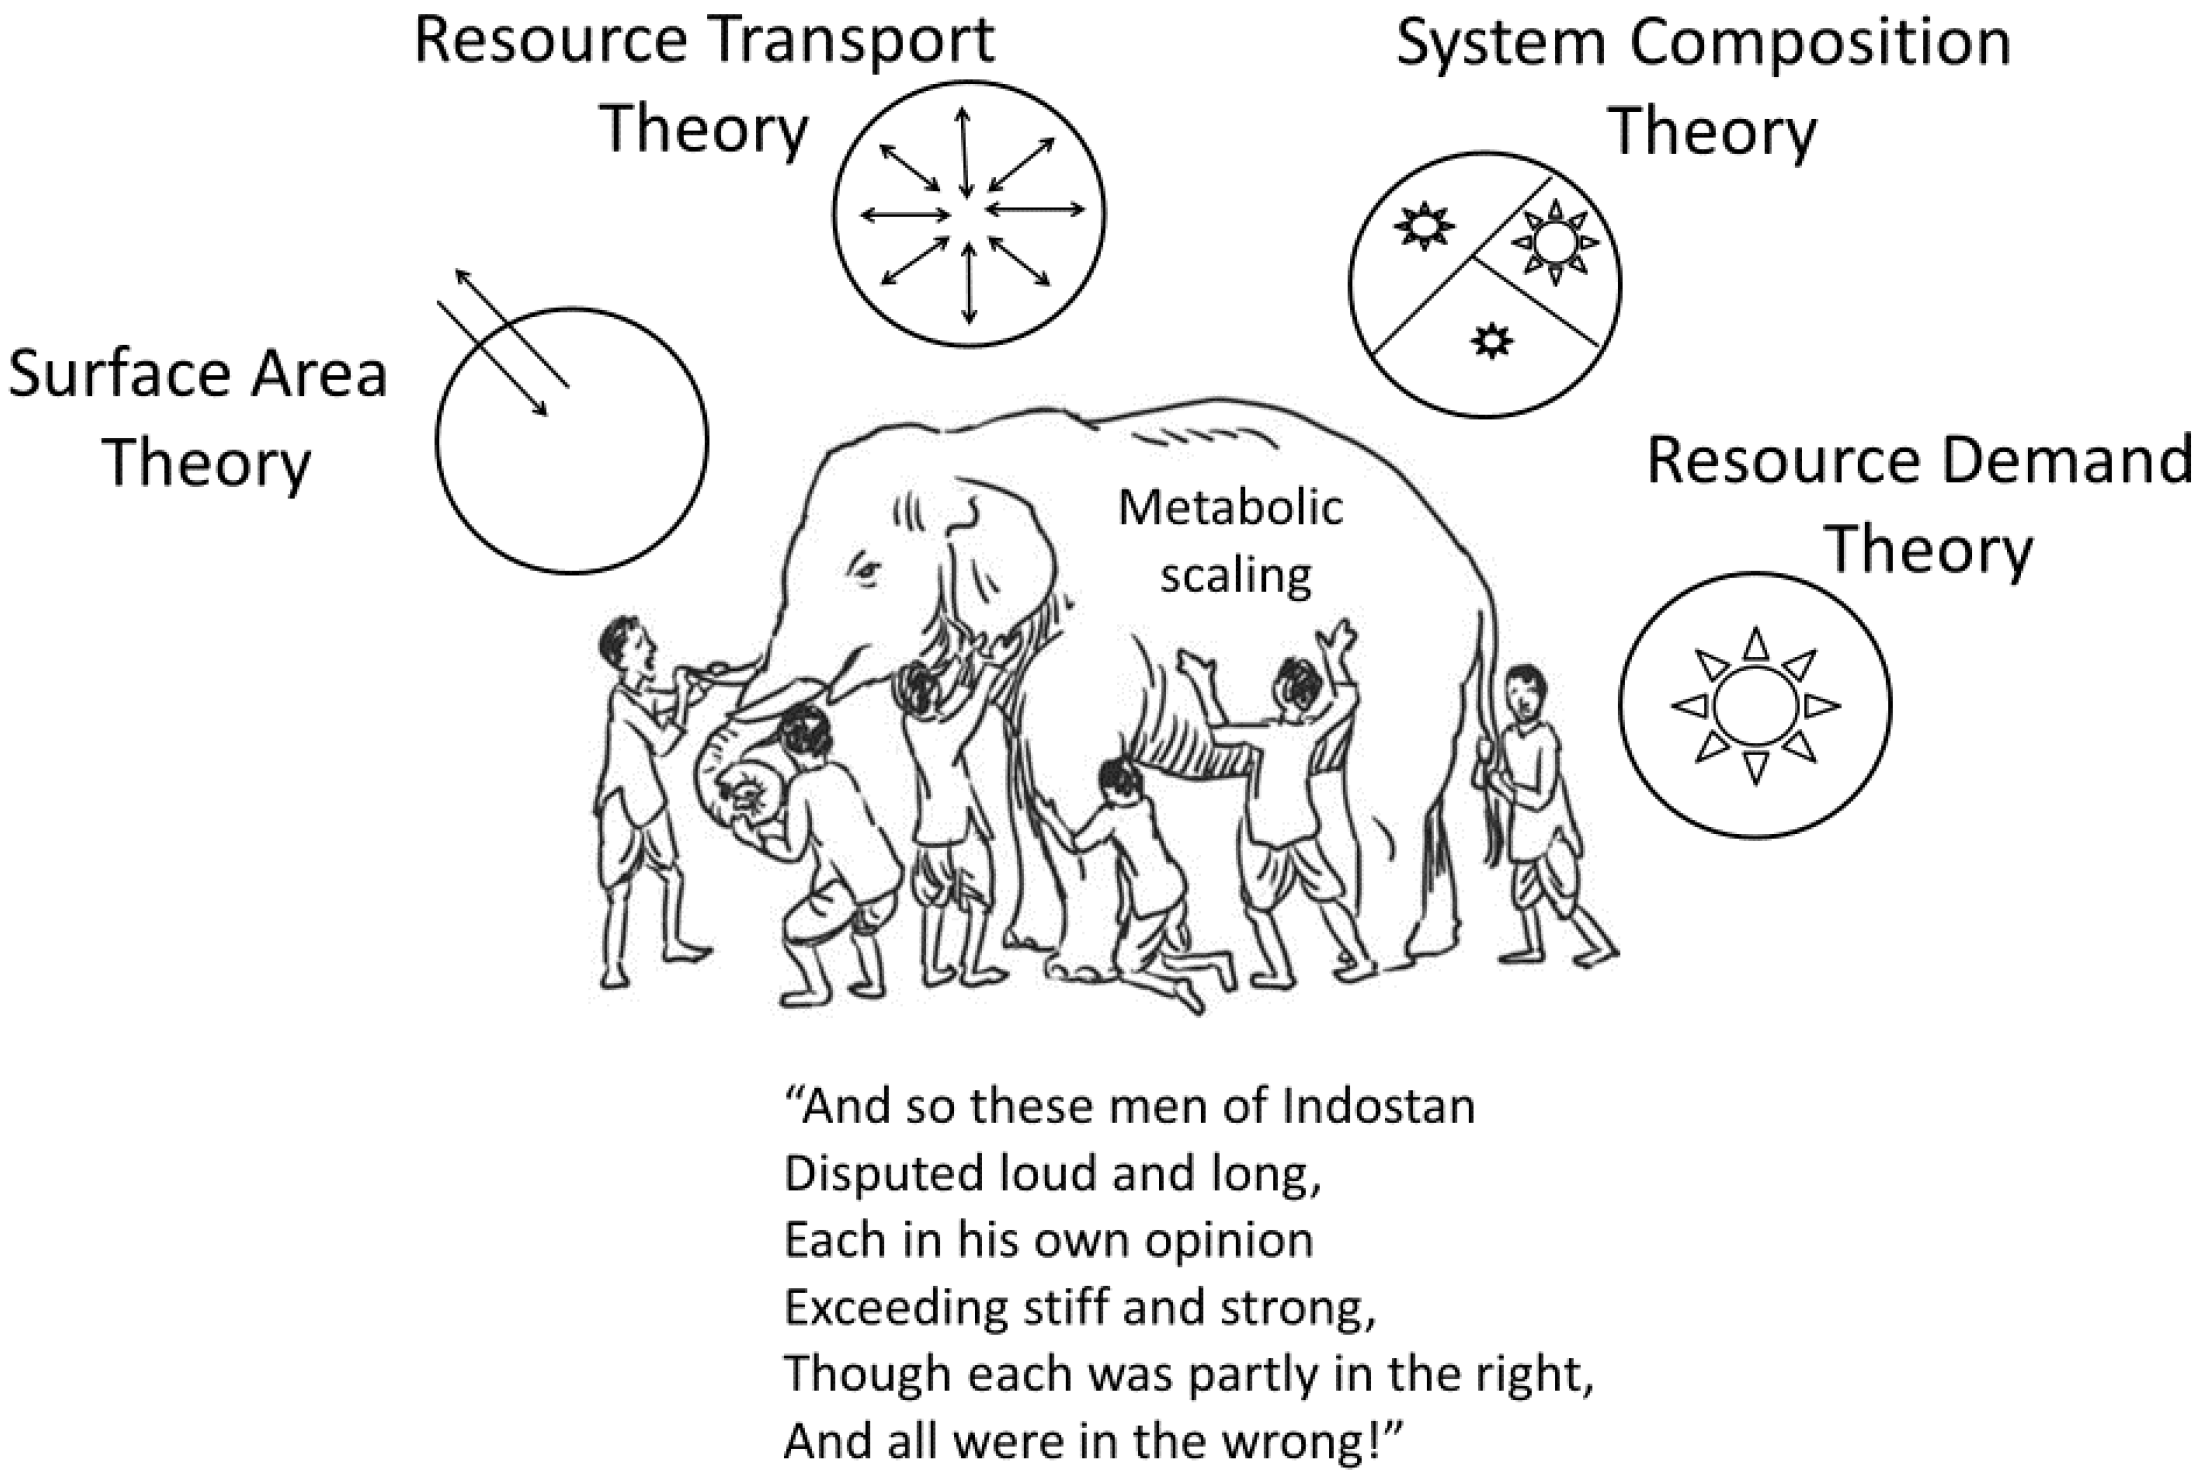
Most biological scaling studies have examined single kinds of allometric relations, and specific theoretical explanations for them, in isolation from others [19,51], thus creating a problem epitomized by John G. Saxe’s poem about the blind men attempting to understand an elephant by separately and independently examining its individual body parts [17] (Figure 7). When striving for a general theory of biological scaling, investigators should fully consider multiple hypotheses, mechanisms and kinds of scaling relationships, and their possible integration [17,20]. The frequently forgotten or underappreciated work of their predecessors can help light the way.
Acknowledgments
I thank Jon F. Harrison for useful discussions about some of the issues discussed in this article. I also thank the reviewers for their encouragement and helpful comments.
Conflicts of Interest
The author declares no conflict of interest.
References
- Sclater, A. The extent of Charles Darwin’s knowledge of Mendel. J. Biosci. 2006, 31, 191–193. [Google Scholar] [CrossRef] [PubMed]
- Fisher, R.A. Has Mendel’s work been rediscovered? Ann. Sci. 1936, 1, 115–137. [Google Scholar] [CrossRef]
- Kottler, M.J. Hugo de Vries and the rediscovery of Mendel’s laws. Ann. Sci. 1979, 36, 517–538. [Google Scholar] [CrossRef]
- Moore, R. The “rediscovery” of Mendel’s work. Bioscene 2001, 27, 13–24. [Google Scholar]
- Carlson, E.A. Mendel’s Legacy: The Origin of Classical Genetics; Cold Spring Harbor Laboratory Press: Cold Spring Harbor, NY, USA, 2004. [Google Scholar]
- Darwin, C.; Wallace, A. On the tendency of species to form varieties; and on the perpetuation of varieties and species by natural means of selection. Zool. J. Linn. Soc. 1858, 3, 45–62. [Google Scholar] [CrossRef]
- Merton, R.K. Singletons and multiples in scientific discovery: A chapter in the sociology of science. Proc. Am. Philos. Soc. 1961, 105, 470–486. [Google Scholar]
- Packard, K.S. The origin of waveguides: A case of multiple rediscovery. IEEE Trans. Microw. Theory Tech. 1984, 32, 961–969. [Google Scholar] [CrossRef]
- Gingerich, O. Did Copernicus owe a debt to Aristarchus? J. Hist. Astron. 1985, 16, 37–42. [Google Scholar] [CrossRef]
- Brown, J.H.; Lomolino, M.V. Independent discovery of the equilibrium theory of island biogeography. Ecology 1989, 70, 1954–1957. [Google Scholar] [CrossRef]
- Oliver, S.; Ozin, G.A.; Ozin, L.A. Skeletons in the cupboard: Rediscovery in science. Adv. Mater. 1995, 7, 948–951. [Google Scholar] [CrossRef]
- Merton, R.K. On Social Structure and Science; University of Chicago Press: Chicago, IL, USA, 1996. [Google Scholar]
- Sacks, O. Scotoma: Forgetting and neglect in science. In Prematurity in Scientific Discovery: On Resistance and Neglect; Hook, E.B., Ed.; University of California Press: Berkeley, CA, USA, 2002; pp. 70–83. [Google Scholar]
- Sengor, A.M.C. The repeated rediscovery of mélanges and its implications for the possibility and the role of objective evidence in the scientific enterprise. Spec. Pap. Geol. Soc. Am. 2003, 373, 385–446. [Google Scholar]
- Van Raan, A.F.J. Sleeping beauties in science. Scientometrics 2004, 59, 467–472. [Google Scholar] [CrossRef]
- Ke, Q.; Ferrara, E.; Radicchi, F.; Flammini, A. Defining and identifying Sleeping Beauties in science. Proc. Natl. Acad. Sci. USA 2015, 112, 7426–7431. [Google Scholar] [CrossRef] [PubMed]
- Calder, W.A. Size, Function and Life History; Harvard University Press: Cambridge, MA, USA, 1984. [Google Scholar]
- Gayon, J. History of the concept of allometry. Am. Zool. 2000, 40, 748–758. [Google Scholar] [CrossRef]
- Glazier, D.S. Beyond the “3/4-power law”: Variation in the intra- and interspecific scaling of metabolic rate in animals. Biol. Rev. 2005, 80, 611–662. [Google Scholar] [CrossRef] [PubMed]
- Glazier, D.S. Metabolic scaling in complex living systems. Systems 2014, 2, 451–540. [Google Scholar] [CrossRef]
- Gould, S.J. Allometry and size in ontogeny and phylogeny. Biol. Rev. 1966, 41, 587–638. [Google Scholar] [CrossRef] [PubMed]
- Kolokotrones, T.; Savage, V.; Deeds, E.J.; Fontana, W. Curvature in metabolic scaling. Nature 2010, 464, 753–756. [Google Scholar] [CrossRef] [PubMed]
- Hayssen, V.; Lacy, R.C. Basal metabolic rates in mammals: Taxonomic differences in the allometry of BMR and body mass. Comp. Biochem. Physiol. Mol. Integr. Physiol. 1985, 81, 741–754. [Google Scholar] [CrossRef]
- Kozłowski, J.; Konarzewski, M. West, Brown and Enquist’s model of allometric scaling again: The same questions remain. Funct. Ecol. 2005, 19, 739–743. [Google Scholar] [CrossRef]
- Painter, P.R. Data from necropsy studies and in vitro studies lead to a model for allometric scaling of basal metabolic rate. Theor. Biol. Med. Model. 2005, 2. [Google Scholar] [CrossRef]
- Capellini, I.; Venditti, C.; Barton, R.A. Phylogeny and metabolic scaling in mammals. Ecology 2010, 91, 2783–2793. [Google Scholar] [CrossRef] [PubMed]
- Clarke, A.; Rothery, P.; Isaac, N.J.B. Scaling of basal metabolic rate with body mass and temperature in mammals. J. Anim. Ecol. 2010, 79, 610–619. [Google Scholar] [CrossRef] [PubMed]
- Cheng, D.L.; Li, T.; Zhong, Q.L.; Wang, G.X. Scaling relationship between tree respiration rates and biomass. Biol. Lett. 2010, 6, 715–717. [Google Scholar] [CrossRef] [PubMed]
- Mori, S.; Yamaji, K.; Ishida, A.; Prokushkin, S.G.; Masyagina, O.V.; Hagihara, A.; Rafiqul Hoque, A.T.M.; Suwa, R.; Osawa, A.; Nishizono, T.; et al. Mixed-power scaling of whole-plant respiration from seedlings to giant trees. Proc. Natl. Acad. Sci. USA 2010, 107, 1447–1451. [Google Scholar] [CrossRef] [PubMed]
- Zotin, A.I.; Konoplev, V.A.; Grudnitsky, V.A. The questions of non-linearity for using criterion of orderliness. In Thermodynamics of Biological Processes; Lamprecht, I., Zotin, A.I., Eds.; Walter de Gruyter: Berlin, Germany, 1978; pp. 361–370. [Google Scholar]
- Dodds, P.S.; Rothman, D.H.; Weitz, J.S. Re-examination of the “3/4-law” of metabolism. J. Theor. Biol. 2001, 209, 9–27. [Google Scholar] [CrossRef] [PubMed]
- Zeuthen, E. Oxygen uptake as related to body size in organisms. Q. Rev. Biol. 1953, 28, 1–12. [Google Scholar] [CrossRef] [PubMed]
- Ehnes, R.B.; Rall, B.C.; Brose, U. Phylogenetic grouping, curvature and metabolic scaling in terrestrial invertebrates. Ecol. Lett. 2011, 14, 993–1000. [Google Scholar] [CrossRef] [PubMed]
- Müller, D.W.; Codron, D.; Werner, J.; Fritz, J.; Hummel, J.; Griebeler, E.M.; Clauss, M. Dichotomy of eutherian reproduction and metabolism. Oikos 2012, 121, 102–115. [Google Scholar] [CrossRef] [Green Version]
- Hudson, L.N.; Isaac, N.J.; Reuman, D.C. The relationship between body mass and field metabolic rate among individual birds and mammals. J. Anim. Ecol. 2013, 82, 1009–1020. [Google Scholar] [CrossRef] [PubMed]
- Bueno, J.; López-Urrutia, Á. Scaling up the curvature of mammalian metabolism. Front. Ecol. Evol. 2014, 2, 61. [Google Scholar] [CrossRef]
- Douhard, F.; Lemaître, J.F.; Rauw, W.M.; Friggens, N.C. Allometric scaling of the elevation of maternal energy intake during lactation. Front. Zool. 2016, 13, 32. [Google Scholar] [CrossRef] [PubMed]
- Myhrvold, N.P. Dinosaur metabolism and the allometry of maximum growth rate. PLoS ONE 2016, 11, e0163205. [Google Scholar] [CrossRef] [PubMed]
- Glazier, D.S. Effects of metabolic level on the body size scaling of metabolic rate in birds and mammals. Proc. R. Soc. B 2008, 275, 1405–1410. [Google Scholar] [CrossRef] [PubMed]
- Packard, G.C.; Birchard, G.F. Traditional allometric analysis fails to provide a valid predictive model for mammalian metabolic rates. J. Exp. Biol. 2008, 211, 3581–3587. [Google Scholar] [CrossRef] [PubMed]
- Roberts, M.F.; Lightfoot, E.N.; Porter, W.P. A new model for the body size–metabolism relationship. Physiol. Biochem. Zool. 2010, 83, 395–405. [Google Scholar] [CrossRef] [PubMed]
- Packard, G.C. Quantifying the curvilinear metabolic scaling in mammals. J. Exp. Zool. A Ecol. Genet. Physiol. 2015, 323, 540–546. [Google Scholar] [CrossRef] [PubMed]
- Uyeda, J.C.; Pennell, M.W.; Miller, E.T.; Maia, R.; McClain, C.R. The evolution of energetic scaling across the vertebrate tree of life. Am. Nat. 2017, 190, 185–199. [Google Scholar] [CrossRef] [PubMed]
- Isaac, N.J.; Carbone, C. Why are metabolic scaling exponents so controversial? Quantifying variance and testing hypotheses. Ecol. Lett. 2010, 13, 728–735. [Google Scholar] [CrossRef] [PubMed]
- Makarieva, A.M.; Gorshkov, V.G.; Li, B.-L. A note on metabolic rate dependence on body size in plants and animals. J. Theor. Biol. 2003, 221, 301–307. [Google Scholar] [CrossRef] [PubMed]
- Glazier, D.S. A unifying explanation for diverse metabolic scaling in animals and plants. Biol. Rev. 2010, 85, 111–138. [Google Scholar] [CrossRef] [PubMed]
- Killen, S.S.; Costa, I.; Brown, J.A.; Gamperl, A.K. Little left in the tank: Metabolic scaling in marine teleosts and its implications for aerobic scope. Proc. R. Soc. Lond. B 2007, 274, 431–438. [Google Scholar] [CrossRef] [PubMed]
- Moran, D.; Wells, R.M.G. Ontogenetic scaling of fish metabolism in the mouse-to-elephant mass magnitude range. Comp. Biochem. Physiol. A Mol. Integr. Physiol. 2007, 148, 611–620. [Google Scholar] [CrossRef] [PubMed]
- Streicher, J.W.; Cox, C.L.; Birchard, G.F. Non-linear scaling of oxygen consumption and heart rate in a very large cockroach species (Gromphadorhina portentosa): Correlated changes with body size and temperature. J. Exp. Biol. 2012, 215, 1137–1143. [Google Scholar] [CrossRef] [PubMed]
- Griebeler, E.M.; Werner, J. Mass, phylogeny, and temperature are sufficient to explain differences in metabolic scaling across mammalian orders? Ecol. Evol. 2016, 6, 8352–8365. [Google Scholar] [CrossRef] [PubMed]
- Peters, R.H. The Ecological Implications of Body Size; Cambridge University Press: Cambridge, UK, 1983. [Google Scholar]
- McNab, B.K. Complications inherent in scaling the basal rate of metabolism in mammals. Q. Rev. Biol. 1988, 63, 25–54. [Google Scholar] [CrossRef] [PubMed]
- West, D.; West, B.J. Statistical origin of allometry. Europhys. Lett. 2011, 94. [Google Scholar] [CrossRef]
- Glazier, D.S. Metabolic level and size-scaling of rates of respiration and growth in unicellular organisms. Funct. Ecol. 2009, 23, 963–968. [Google Scholar] [CrossRef]
- Glazier, D.S. Ontogenetic body-mass scaling of resting metabolic rate covaries with species-specific metabolic level and body size in spiders and snakes. Comp. Biochem. Physiol. A Mol. Integr. Physiol. 2009, 153, 403–407. [Google Scholar] [CrossRef] [PubMed]
- Glazier, D.S. The scaling of metabolic scaling within physical limits. Systems 2014, 2, 425–450. [Google Scholar] [CrossRef]
- Killen, S.S.; Atkinson, D.; Glazier, D.S. The intraspecific scaling of metabolic rate with body mass in fishes depends on lifestyle and temperature. Ecol. Lett. 2010, 13, 184–193. [Google Scholar] [CrossRef] [PubMed]
- Carey, N.; Sigwart, J.D.; Richards, J.G. Economies of scaling: More evidence that allometry of metabolism is linked to activity, metabolic rate and habitat. J. Exp. Mar. Biol. Ecol. 2013, 439, 7–14. [Google Scholar] [CrossRef]
- Carey, N.; Sigwart, J.D. Size matters: Plasticity in metabolic scaling shows body-size may modulate responses to climate change. Biol. Lett. 2014, 10, 20140408. [Google Scholar] [CrossRef] [PubMed]
- Glazier, D.S. Activity affects intraspecific body-size scaling of metabolic rate in ectothermic animals. J. Comp. Physiol. B 2009, 179, 821–828. [Google Scholar] [CrossRef] [PubMed]
- White, C.R.; Seymour, R.S. Allometric scaling of mammalian metabolism. J. Exp. Biol. 2005, 208, 1611–1619. [Google Scholar] [CrossRef] [PubMed] [Green Version]
- McNab, B.K. Extreme Measures: The Ecological Energetics of Birds and Mammals; University of Chicago Press: Chicago, IL, USA, 2012. [Google Scholar]
- Gillooly, J.F.; Brown, J.H.; West, G.B.; Savage, V.M.; Charnov, E.L. Effects of size and temperature on metabolic rate. Science 2001, 293, 2248–2251. [Google Scholar] [CrossRef] [PubMed]
- Brown, J.H.; Gillooly, J.F.; Allen, A.P.; Savage, V.M.; West, G.B. Toward a metabolic theory of ecology. Ecology 2004, 85, 1771–1789. [Google Scholar] [CrossRef]
- Brown, J.H.; Sibly, R.M. The metabolic theory of ecology and its central equation. In Metabolic Ecology: A Scaling Approach; Sibly, R.M., Brown, J.H., Kodric-Brown, A., Eds.; Wiley-Blackwell: Chichester, UK, 2012; pp. 21–33. [Google Scholar]
- Whitfield, J. In the Beat of a Heart: Life, Energy, and the Unity of Nature; John Henry Press: Washington, DC, USA, 2006. [Google Scholar]
- Glazier, D.S. Metabolic ecology: The whole story? Ecology 2013, 94, 263–264. [Google Scholar] [CrossRef]
- Robinson, W.R.; Peters, R.H.; Zimmermann, J. The effects of body size and temperature on metabolic rate of organisms. Can. J. Zool. 1983, 61, 281–288. [Google Scholar] [CrossRef]
- Dame, R.F. The ecological energies of growth, respiration and assimilation in the intertidal American oyster Crassostrea virginica. Mar. Biol. 1972, 17, 243–250. [Google Scholar] [CrossRef]
- Hemmingsen, A.M. Energy metabolism as related to body size and respiratory surfaces, and its evolution. Rep. Steno Mem. Hosp. Nord. Insulin Lab. 1960, 9, 1–110. [Google Scholar]
- Bennett, A.F.; Dawson, W.R. Metabolism. In Biology of the Reptilia, Volume 5: Physiology A; Gans, C., Dawson, W.R., Eds.; Academic Press: London, UK, 1976; pp. 127–223. [Google Scholar]
- Ivleva, I.V. The dependence of crustacean respiration rate on body mass and habitat temperature. Int. Rev. Gesamten Hydrobiol. 1980, 65, 1–47. [Google Scholar] [CrossRef]
- Xie, X.; Sun, R. The bioenergetics of the southern catfish (Silurus meridionalis Chen). I. Resting metabolic rate as a function of body weight and temperature. Physiol. Zool. 1990, 63, 1181–1195. [Google Scholar] [CrossRef]
- Ohlberger, J.; Mehner, T.; Staaks, G.; Hölker, F. Intraspecific temperature dependence of the scaling of metabolic rate with body mass in fishes and its ecological implications. Oikos 2012, 121, 245–251. [Google Scholar] [CrossRef]
- Xu, L.; Snelling, E.P.; Seymour, R.S. Burrowing energetics of the Giant Burrowing Cockroach Macropanesthia rhinoceros: An allometric study. J. Insect Physiol. 2014, 70, 81–87. [Google Scholar] [CrossRef] [PubMed]
- Gudowska, A.; Schramm, B.W.; Czarnoleski, M.; Kozłowski, J.; Bauchinger, U. Physical mechanism or evolutionary trade-off? Factors dictating the relationship between metabolic rate and ambient temperature in carabid beetles. J. Therm. Biol. 2017, 68, 89–95. [Google Scholar] [CrossRef] [PubMed]
- Lambert, R.; Teissier, G. Théorie de la similitude biologique. Ann. Physiol. Physicochim. Biol. 1927, 3, 212–246. [Google Scholar]
- Blum, J.J. On the geometry of four-dimensions and the relationship between metabolism and body mass. J. Theor. Biol. 1977, 64, 599–601. [Google Scholar] [CrossRef]
- Heusner, A.A. Energy metabolism and body size II. Dimensional analysis and energetic non-similarity. Resp. Physiol. 1982, 48, 13–25. [Google Scholar] [CrossRef]
- West, G.B.; Brown, J.H.; Enquist, B.J. The fourth dimension of life: Fractal geometry and allometric scaling of organisms. Science 1999, 284, 1677–1679. [Google Scholar] [CrossRef] [PubMed]
- Da Silva, J.K.L.; Garcia, G.J.; Barbosa, L.A. Allometric scaling laws of metabolism. Phys. Life Rev. 2006, 3, 229–261. [Google Scholar] [CrossRef]
- Ginzburg, L.; Damuth, J. The space-lifetime hypothesis: Viewing organisms in four dimensions, literally. Am. Nat. 2008, 171, 125–131. [Google Scholar] [CrossRef] [PubMed]
- West, D.; West, B.J. Physiologic time: A hypothesis. Phys. Life Rev. 2013, 10, 210–224. [Google Scholar] [CrossRef] [PubMed]
- Banavar, J.R.; Cooke, T.J.; Rinaldo, A.; Maritan, A. Form, function, and evolution of living organisms. Proc. Natl. Acad. Sci. USA 2014, 111, 3332–3337. [Google Scholar] [CrossRef] [PubMed]
- Kooijman, S.A.L.M. Dynamic Energy and Mass Budgets in Biological Systems; Cambridge University Press: Cambridge, UK, 2000. [Google Scholar]
- Banavar, J.R.; Damuth, J.; Maritan, A.; Rinaldo, A. Supply-demand balance and metabolic scaling. Proc. Natl. Acad. Sci. USA 2002, 99, 10506–10509. [Google Scholar] [CrossRef] [PubMed]
- Darveau, C.-A.; Suarez, R.K.; Andrews, R.D.; Hochachka, P.W. Allometric cascade as a unifying principle of body mass effects on metabolism. Nature 2002, 417, 166–170. [Google Scholar] [CrossRef] [PubMed]
- Weibel, E.R.; Bacigalupe, L.D.; Schmitt, B.; Hoppeler, H. Allometric scaling of maximal metabolic rate in mammals: Muscle aerobic capacity as determinant factor. Resp. Physiol. Neurobiol. 2004, 140, 115–132. [Google Scholar] [CrossRef] [PubMed]
- Hulbert, A.J.; Else, P.L. Membranes and the setting of energy demand. J. Exp. Biol. 2005, 208, 1593–1599. [Google Scholar] [CrossRef] [PubMed]
- Suarez, R.K.; Darveau, C.-A. Multi-level regulation and metabolic scaling. J. Exp. Biol. 2005, 208, 1627–1634. [Google Scholar] [CrossRef] [PubMed]
- Kleiber, M. Body size and metabolism. Hilgardia 1932, 6, 315–353. [Google Scholar] [CrossRef]
- Kleiber, M. The Fire of Life; Wiley: New York, NY, USA, 1961. [Google Scholar]
- Von Bertalanffy, L.; Pirozynski, W.J. Tissue respiration, growth, and basal metabolism. Biol. Bull. 1953, 105, 240–256. [Google Scholar] [CrossRef]
- Von Bertalanffy, L. Quantitative laws in metabolism and growth. Q. Rev. Biol. 1957, 32, 217–231. [Google Scholar] [CrossRef] [PubMed]
- Chaui-Berlinck, J.G.; Navas, C.A.; Monteiro, L.H.A.; Bicudo, J.E.P.W. Control of metabolic rate is a hidden variable in the allometric scaling of homeotherms. J. Exp. Biol. 2005, 208, 1709–1716. [Google Scholar] [CrossRef] [PubMed]
- Suarez, R.K. Energy and metabolism. Compr. Physiol. 2012, 2, 2527–2539. [Google Scholar] [CrossRef] [PubMed]
- Glazier, D.S. Body-mass scaling of metabolic rate: What are the relative roles of cellular versus systemic effects? Biology 2015, 4, 187–199. [Google Scholar] [CrossRef] [PubMed]
- Glazier, D.S. Is metabolic rate a universal “pacemaker” for biological processes? Biol. Rev. 2015, 90, 377–407. [Google Scholar] [CrossRef] [PubMed]
- Daan, S.; Masman, D.; Groenewold, A. Avian basal metabolic rates: Their association with body composition and energy expenditure in nature. Am. J. Physiol. Regul. Integr. Comp. Physiol. 1990, 259, R333–R340. [Google Scholar] [CrossRef] [PubMed]
- Witting, L. The body mass allometries as evolutionarily determined by the foraging of mobile organisms. J. Theor. Biol. 1995, 177, 129–137. [Google Scholar] [CrossRef]
- Witting, L. Body mass allometries caused by physiological or ecological constraints? Trends Ecol. Evol. 1998, 13, 25. [Google Scholar] [CrossRef]
- Kozłowski, J.; Weiner, J. Interspecific allometries are by-products of body size optimization. Am. Nat. 1997, 149, 352–380. [Google Scholar] [CrossRef]
- Glazier, D.S. The 3/4-power law is not universal: Evolution of isometric, ontogenetic metabolic scaling in pelagic animals. BioScience 2006, 56, 325–332. [Google Scholar] [CrossRef]
- McNab, B.K. The evolution of energetics in birds and mammals. In The Quintessential Naturalist: Honoring the Life and Legacy of Oliver P. Pearson; University of California Publications in Zoology, Kelt, D.A., Lessa, E.P., Salazar-Bravo, J., Patton, J.L., Eds.; University of California Press: Berkeley, CA, USA, 2007; Volume 134, pp. 67–110. [Google Scholar]
- Glazier, D.S.; Butler, E.M.; Lombardi, S.A.; Deptola, T.J.; Reese, A.J.; Satterthwaite, E.V. Ecological effects on metabolic scaling: Amphipod responses to fish predators in freshwater springs. Ecol. Monogr. 2011, 81, 599–618. [Google Scholar] [CrossRef]
- Harrison, J.F. Do performance-safety tradeoffs cause hypometric metabolic scaling in animals? Trends Ecol. Evol. 2017, 32, 653–664. [Google Scholar] [CrossRef] [PubMed]
- Pequeno, P.A.; Baccaro, F.B.; Souza, J.L.; Franklin, E. Ecology shapes metabolic and life history scalings in termites. Ecol. Eng. 2017, 42, 115–124. [Google Scholar] [CrossRef]
- Sarrus, F.; Rameaux, J.F. Application des sciences accessoires et principalement des mathématiques à la physiologie générale (Rapport sur une mémoire adressé à l’Académic royale de Médecine, séance du 23 juillet 1839). Bull. Acad. R. Méd. (Paris) 1839, 3, 1094–1100. [Google Scholar]
- Rubner, M. Über den Einfluss der Körpergrösse auf Stoff- und Kraftwechsel. Z. Biol. 1883, 19, 535–562. [Google Scholar]
- Richet, C.R. La Chaleur Animale; Bibliothèque Scientifique Internationale, Felix Alcan: Paris, France, 1889. [Google Scholar]
- Voit, E. Über die Grösse des Energiebedarfs der Tiere in Hungerzustande. Z. Biol. 1901, 41, 113–154. [Google Scholar]
- Brody, S.; Procter, R.C. Relation between basal metabolism and mature body weight in different species of mammals and birds. Univ. Missouri Agric. Exp. Stat. Res. Bull. 1932, 116, 89–101. [Google Scholar]
- Schmidt-Nielsen, K. Scaling: Why Is Animal Size So Important? Cambridge University Press: New York, NY, USA, 1984. [Google Scholar]
- Blaxter, K.L. Energy Metabolism in Animals and Man; Cambridge University Press: Cambridge, UK, 1989. [Google Scholar]
- Savage, V.M.; Gillooly, J.F.; Woodruff, W.H.; West, G.B.; Allen, A.P.; Enquist, B.J.; Brown, J.H. The predominance of quarter-power scaling in biology. Funct. Ecol. 2004, 18, 257–282. [Google Scholar] [CrossRef]
- Riveros, A.J.; Enquist, B.J. Metabolic scaling in insects supports the predictions of the WBE model. J. Insect Physiol. 2011, 57, 688–693. [Google Scholar] [CrossRef] [PubMed]
- White, C.R.; Phillips, N.F.; Seymour, R.S. The scaling and temperature dependence of vertebrate metabolism. Biol. Lett. 2006, 2, 125–127. [Google Scholar] [CrossRef] [PubMed]
- White, C.R.; Cassey, P.; Blackburn, T.M. Allometric exponents do not support a universal metabolic allometry. Ecology 2007, 88, 315–323. [Google Scholar] [CrossRef] [PubMed] [Green Version]
- McNab, B.K. An analysis of the factors that influence the level and scaling of mammalian BMR. Comp. Biochem. Physiol. A Mol. Integr. Physiol. 2008, 151, 5–28. [Google Scholar] [CrossRef] [PubMed]
- McNab, B.K. Ecological factors affect the level and scaling of avian BMR. Comp. Biochem. Physiol. A Mol. Integr. Physiol. 2009, 152, 22–45. [Google Scholar] [CrossRef] [PubMed]
- White, C.R.; Kearney, M.R. Metabolic scaling in animals: Methods, empirical results, and theoretical explanations. Compr. Physiol. 2014, 4, 231–256. [Google Scholar] [CrossRef] [PubMed]
- Bejan, A. The tree of convective heat streams: Its thermal insulation function and the predicted 3/4-power relation between body heat loss and body size. Int. J. Heat Mass Transf. 2001, 44, 699–704. [Google Scholar] [CrossRef]
- Speakman, J.R.; Król, E. Maximal heat dissipation capacity and hyperthermia risk: Neglected key factors in the ecology of endotherms. J. Anim. Ecol. 2010, 79, 726–746. [Google Scholar] [CrossRef] [PubMed]
- Kwak, H.S.; Im, H.G.; Shim, E.B. A model for allometric scaling of mammalian metabolism with ambient heat loss. Integr. Med. Res. 2016, 5, 30–36. [Google Scholar] [CrossRef] [PubMed]
- White, C.R.; Seymour, R.S. Does basal metabolic rate contain a useful signal? Mammalian BMR allometry and correlations with a selection of physiological, ecological, and life-history variables. Physiol. Biochem. Zool. 2004, 77, 929–941. [Google Scholar] [CrossRef] [PubMed] [Green Version]
- Seymour, R.; White, C. Can the basal metabolic rate of endotherms be explained by biophysical modeling? Response to “A new model for the body size–metabolism relationship”. Physiol. Biochem. Zool. 2011, 84, 107–110. [Google Scholar] [CrossRef] [PubMed]
- White, C.R.; Seymour, R.S. Mammalian basal metabolic rate is proportional to body mass2/3. Proc. Natl. Acad. Sci. USA 2003, 100, 4046–4049. [Google Scholar] [CrossRef] [PubMed]
- Mortola, J.P. Thermographic analysis of body surface temperature of mammals. Zool. Sci. 2013, 30, 118–124. [Google Scholar] [CrossRef] [PubMed]
- Glazier, D.S. Effects of contingency versus constraints on the body-mass scaling of metabolic rate. Challenges 2018, in press. [Google Scholar]
- Shestopaloff, Y.K. Metabolic allometric scaling model: Combining cellular transportation and heat dissipation constraints. J. Exp. Biol. 2016, 219, 2481–2489. [Google Scholar] [CrossRef] [PubMed]
- Ellenby, C. Relation between body size and metabolism. Nature 1937, 140, 853. [Google Scholar] [CrossRef]
- Hirst, A.G.; Glazier, D.S.; Atkinson, D. Body shape-shifting during growth permits tests that distinguish between competing geometric theories of metabolic scaling. Ecol. Lett. 2014, 17, 1274–1281. [Google Scholar] [CrossRef] [PubMed]
- Glazier, D.S.; Hirst, A.G.; Atkinson, D. Shape shifting predicts ontogenetic changes in metabolic scaling in diverse aquatic invertebrates. Proc. R. Soc. B Biol. Sci. 2015, 282, 20142302. [Google Scholar] [CrossRef] [PubMed]
- Hirst, A.G.; Lilley, M.K.S.; Glazier, D.S.; Atkinson, D. Ontogenetic body-mass scaling of nitrogen excretion relates to body surface area in diverse pelagic invertebrates. Limnol. Oceanogr. 2017, 62, 311–319. [Google Scholar] [CrossRef]
- Lane, S.J.; Shishido, C.M.; Moran, A.L.; Tobalske, B.W.; Arango, C.P.; Woods, H.A. Upper limits to body size imposed by respiratory-structural trade-offs in Antarctic pycnogonids. Proc. R. Soc. B Biol. Sci. 2017, 284, 20171779. [Google Scholar] [CrossRef] [PubMed]
- Glazier, D.S.; Paul, D.A. Ecology of ontogenetic body-mass scaling of gill surface area in a freshwater crustacean. J. Exp. Biol. 2017, 220, 2120–2127. [Google Scholar] [CrossRef] [PubMed]
- Lefevre, S.; McKenzie, D.J.; Nilsson, G.E. Models projecting the fate of fish populations under climate change need to be based on valid physiological mechanisms. Glob. Chang. Biol. 2017, 9, 3449–3459. [Google Scholar] [CrossRef] [PubMed]
- Pauly, D.; Cheung, W.W. Sound physiological knowledge and principles in modeling shrinking of fishes under climate change. Glob. Chang. Biol. 2017. [Google Scholar] [CrossRef] [PubMed]
- Davison, J. Body weight, cell surface, and metabolic rate in anuran Amphibia. Biol. Bull. 1955, 109, 407–419. [Google Scholar] [CrossRef]
- Davison, J. An analysis of cell growth and metabolism in the crayfish (Procambrus alleni). Biol. Bull. 1956, 110, 264–273. [Google Scholar] [CrossRef]
- Günther, B. Dimensional analysis and theory of biological similarity. Physiol. Rev. 1975, 55, 659–699. [Google Scholar] [CrossRef] [PubMed]
- Kozłowski, J.; Konarzewski, M.; Gawelczyk, A.T. Cell size as a link between noncoding DNA and metabolic rate scaling. Proc. Natl. Acad. Sci. USA 2003, 100, 14080–14085. [Google Scholar] [CrossRef] [PubMed]
- Chown, S.L.; Marais, E.; Terblanche, J.S.; Klok, C.J.; Lighton, J.R.B.; Blackburn, T.M. Scaling of insect metabolic rate is inconsistent with the nutrient supply network model. Funct. Ecol. 2007, 21, 282–290. [Google Scholar] [CrossRef]
- Savage, V.M.; Allen, A.P.; Brown, J.H.; Gillooly, J.F.; Herman, A.B.; Woodruff, W.H.; West, G.B. Scaling of number, size, and metabolic rate of cells with body size in mammals. Proc. Natl. Acad. Sci. USA 2007, 104, 4718–4723. [Google Scholar] [CrossRef] [PubMed]
- Glazier, D.S.; Powell, M.G.; Deptola, T.J. Body-size scaling of metabolic rate in the trilobite Eldredgeops rana. Paleobiology 2012, 39, 109–122. [Google Scholar] [CrossRef]
- Okie, J.G. General models for the spectra of surface area scaling strategies of cells and organisms: Fractality, geometric dissimilitude, and internalization. Am. Nat. 2013, 181, 421–439. [Google Scholar] [CrossRef] [PubMed]
- Luo, Y.; He, D.; Li, G.; Xie, H.; Zhang, Y.; Huang, Q. Intraspecific metabolic scaling exponent depends on red blood cell size in fishes. J. Exp. Biol. 2015, 218, 1496–1503. [Google Scholar] [CrossRef] [PubMed]
- Takemoto, K. Heterogeneity of cells may explain allometric scaling of metabolic rate. Biosystems 2015, 130, 11–16. [Google Scholar] [CrossRef] [PubMed]
- Starostová, Z.; Kubička, L.; Konarzewski, M.; Kozłowski, J.; Kratochvíl, L. Cell size but not genome size affects scaling of metabolic rate in eyelid geckos. Am. Nat. 2009, 174, E100–E105. [Google Scholar] [CrossRef] [PubMed]
- Maciak, S.; Janko, K.; Kotusz, J.; Choleva, L.; Boroń, A.; Juchno, D.; Kujawa, R.; Kozłowski, J.; Konarzewski, M. Standard metabolic rate (SMR) is inversely related to erythrocyte and genome size in allopolyploid fish of the Cobitis taenia hybrid complex. Funct. Ecol. 2011, 25, 1072–1078. [Google Scholar] [CrossRef]
- Glazier, D.S. Log-transformation is useful for examining proportional relationships in allometric scaling. J. Theor. Biol. 2013, 334, 200–203. [Google Scholar] [CrossRef] [PubMed]
- Huang, Q.; Zhang, Y.; Liu, S.; Wang, W.; Luo, Y. Intraspecific scaling of the resting and maximum metabolic rates of the crucian carp (Carassius auratus). PLoS ONE 2013, 8, e82837. [Google Scholar] [CrossRef] [PubMed]
- Starostová, Z.; Konarzewski, M.; Kozłowski, J.; Kratochvíl, L. Ontogeny of metabolic rate and red blood cell size in eyelid geckos: Species follow different paths. PLoS ONE 2013, 8, e64715. [Google Scholar] [CrossRef] [PubMed]
- Zhang, Y.; Huang, Q.; Liu, S.; He, D.; Wei, G.; Luo, Y. Intraspecific mass scaling of metabolic rates in grass carp (Ctenopharyngodon idellus). J. Comp. Physiol. B 2014, 184, 347–354. [Google Scholar] [CrossRef] [PubMed]
- Hermaniuk, A.; Rybacki, M.; Taylor, J.R. Metabolic rate of diploid and triploid Edible Frog Pelophylax esculentus correlates inversely with cell size in tadpoles but not in frogs. Physiol. Biochem. Zool. 2017, 90, 230–239. [Google Scholar] [CrossRef] [PubMed]
- Maino, J.L.; Kearney, M.R.; Nisbet, R.M.; Kooijman, S.A. Reconciling theories for metabolic scaling. J. Anim. Ecol. 2014, 83, 20–29. [Google Scholar] [CrossRef] [PubMed]
- Lease, H.M.; Wolf, B.O. Lipid content of terrestrial arthropods in relation to body size, phylogeny, ontogeny and sex. Physiol. Entomol. 2011, 36, 29–38. [Google Scholar] [CrossRef]
- West, G.B.; Brown, J.H.; Enquist, B.J. A general model for the origin of allometric scaling laws in biology. Science 1997, 276, 122–126. [Google Scholar] [CrossRef] [PubMed]
- Banavar, J.R.; Maritan, A.; Rinaldo, A. Size and form in efficient transportation networks. Nature 1999, 399, 130–132. [Google Scholar] [CrossRef] [PubMed]
- Savage, V.M.; Deeds, E.J.; Fontana, W. Sizing up allometric scaling theory. PLoS Comput. Biol. 2008, 4, e1000171. [Google Scholar] [CrossRef] [PubMed]
- Banavar, J.R.; Moses, M.E.; Brown, J.H.; Damuth, J.; Rinaldo, A.; Sibly, R.M.; Maritan, A. A general basis for quarter-power scaling in animals. Proc. Natl. Acad. Sci. USA 2010, 107, 15816–15820. [Google Scholar] [CrossRef] [PubMed]
- Dodds, P.S. On the optimal form of branching supply and collection networks. Phys. Rev. Lett. 2010, 104. [Google Scholar] [CrossRef] [PubMed]
- Von Hoesslin, H. Über die Ursache der scheinbaren Abhängigkeit des Umsatzes von der Grösse der Körperoberfläche. Arch. Anat. Physiol. Physiol. Abth. 1888, 11, 323–379. [Google Scholar]
- Sernetz, M.; Willems, H.; Bittner, H.R. Fractal Organization of Metabolism. In Energy Transformations in Cells and Organisms; Wieser, W., Gnaiger, E., Eds.; Georg Thieme Verlag: Stuttgart, Germany, 1989; pp. 82–90. [Google Scholar]
- Spatz, H.C. Circulation, metabolic rate, and body size in mammals. J. Comp. Physiol. B 1991, 161, 231–236. [Google Scholar] [CrossRef] [PubMed]
- Regnault, V.; Reiset, J. Recherches chimiques sur la respiration des animeaux des diverses classes. Ann. Chim. Phys. Ser. 3 1849, 26, 299–519. [Google Scholar]
- Hulbert, A.J. A sceptics view: “Kleiber’s Law” or the “3/4 Rule” is neither a law nor a rule but rather an empirical approximation. Systems 2014, 2, 186–202. [Google Scholar] [CrossRef]
- Weymouth, F.W.; Crismon, J.M.; Hall, V.E.; Belding, H.S.; Field, J. Total and tissue respiration in relation to body weight a comparison of the kelp crab with other crustaceans and with mammals. Physiol. Zool. 1944, 17, 50–71. [Google Scholar] [CrossRef]
- Kleiber, M. Body size and metabolic rate. Physiol. Rev. 1947, 27, 511–541. [Google Scholar] [CrossRef] [PubMed]
- Krogh, A. The Anatomy and Physiology of Capillaries; Yale University Press: New Haven, CT, USA, 1929. [Google Scholar]
- West, G.B.; Woodruff, W.H.; Brown, J.H. Allometric scaling of metabolic rate from molecules and mitochondria to cells and mammals. Proc. Natl. Acad. Sci. USA 2002, 99, 2473–2478. [Google Scholar] [CrossRef] [PubMed]
- Ahluwalia, A. Allometric scaling in-vitro. Sci. Rep. 2017, 7, 42113. [Google Scholar] [CrossRef] [PubMed]
- Briggs, L.A.; Krishnamoorthy, M. Exploring network scaling through variations on optimal channel networks. Proc. Natl. Acad. Sci. USA 2013, 110, 19295–19300. [Google Scholar] [CrossRef] [PubMed]
- Tekin, E.; Hunt, D.; Newberry, M.G.; Savage, V.M. Do vascular networks branch optimally or randomly across spatial scales? PLoS Comp. Biol. 2016, 12, e1005223. [Google Scholar] [CrossRef] [PubMed]
- Brummer, A.B.; Savage, V.M.; Enquist, B.J. A general model for metabolic scaling in self-similar asymmetric networks. PLoS Comp. Biol. 2017, 13, e1005394. [Google Scholar] [CrossRef] [PubMed]
- Roux, C.Z. Basal metabolic rate scaled to body mass within species by the fractal dimension of the vascular system and body composition. S. Afr. J. Anim. Sci. 2017, 47, 494–504. [Google Scholar] [CrossRef]
- Newberry, M.G.; Ennis, D.B.; Savage, V.M. Testing foundations of biological scaling theory using automated measurements of vascular networks. PLoS Comp. Biol. 2015, 11, e1004455. [Google Scholar] [CrossRef] [PubMed]
- Kozłowski, J.; Czarnołęski, M.; François-Krassowska, A.; Maciak, S.; Pis, T. Cell size is positively correlated between different tissues in passerine birds and amphibians, but not necessarily in mammals. Biol. Lett. 2010, 6, 792–796. [Google Scholar] [CrossRef] [PubMed]
- Porter, R.K.; Brand, M.D. Causes of differences in respiration rate of hepatocytes from mammals of different body mass. Am. J. Physiol.-Reg. Integr. Comp. Physiol. 1995, 269, R1213–R1224. [Google Scholar] [CrossRef] [PubMed]
- Fenchel, T. Respiration in heterotrophic unicellular eukaryotic organisms. Protist 2014, 165, 485–492. [Google Scholar] [CrossRef] [PubMed]
- Johnson, M.D.; Völket, J.; Moeller, H.V.; Breslauer, K.J.; Falkowski, P.G. Universal constant for heat production in protists. Proc. Natl. Acad. Sci. USA 2009, 106, 6696–6699. [Google Scholar] [CrossRef] [PubMed]
- DeLong, J.P.; Okie, J.G.; Moses, M.E.; Sibly, R.M.; Brown, J.H. Shifts in metabolic scaling, production, and efficiency across major evolutionary transitions of life. Proc. Natl. Acad. Sci. USA 2010, 107, 12941–12945. [Google Scholar] [CrossRef] [PubMed]
- Huete-Ortega, M.; Cermeño, P.; Calvo-Díaz, A.; Marañón, E. Isometric size-scaling of metabolic rate and the size abundance distribution of phytoplankton. Proc. R. Soc. B Biol. Sci. 2012, 279, 1815–1823. [Google Scholar] [CrossRef] [PubMed]
- Makarieva, A.M.; Gorshkov, V.G.; Li, B.L. Energetics of the smallest: Do bacteria breathe at the same rate as whales? Proc. R. Soc. Lond. B 2005, 272, 2219–2224. [Google Scholar] [CrossRef] [PubMed]
- García, F.C.; García-Martín, E.E.; Taboada, F.G.; Sal, S.; Serret, P.; López-Urrutia, Á. The allometry of the smallest: Superlinear scaling of microbial metabolic rates in the Atlantic Ocean. ISME J. 2016, 10, 1029–1036. [Google Scholar] [CrossRef] [PubMed] [Green Version]
- Oikawa, S.; Itazawa, Y. Allometric relationship between tissue respiration and body mass in the carp. Comp. Biochem. Physiol. A Mol. Integr. Physiol. 1984, 77, 415–418. [Google Scholar] [CrossRef]
- Oikawa, S.; Itazawa, Y. Allometric relationship between tissue respiration and body mass in a marine teleost, porgy Pagrus major. Comp. Biochem. Physiol. A Mol. Integr. Physiol. 1993, 105, 129–133. [Google Scholar] [CrossRef]
- Spaargaren, D.H. Metabolic rate and body size. Acta Biotheor. 1994, 42, 263–269. [Google Scholar] [CrossRef] [PubMed]
- Wang, Z.; O’Connor, T.P.; Heshka, S.; Heymsfield, S.B. The reconstruction of Kleiber’s law at the organ-tissue level. J. Nutr. 2001, 131, 2967–2970. [Google Scholar] [CrossRef] [PubMed]
- Kutschera, U.; Niklas, K.J. Organ-specific rates of cellular respiration in developing sunflower seedlings and their bearing on metabolic scaling theory. Protoplasma 2012, 249, 1049–1057. [Google Scholar] [CrossRef] [PubMed]
- Wang, Z.; Zhang, J.; Ying, Z.; Heymsfield, S.B. Organ-tissue level model of resting energy expenditure across mammals: New insights into Kleiber’s Law. ISRN Zool. 2012. [Google Scholar] [CrossRef]
- Kestner, O. Metabolism and size of organs. J. Physiol. 1936, 87, 39P–41P. [Google Scholar]
- Peng, Y.; Niklas, K.J.; Reich, P.B.; Sun, S. Ontogenetic shift in the scaling of dark respiration with whole-plant mass in seven shrub species. Funct. Ecol. 2010, 24, 502–512. [Google Scholar] [CrossRef]
- Holliday, M.A.; Potter, D.; Jarrah, A.; Bearg, S. The relation of metabolic rate to body weight and organ size. Pediatr. Res. 1967, 1, 185–195. [Google Scholar] [CrossRef] [PubMed]
- Glazier, D.S. Separating the respiration rates of embryos and brooding females of Daphnia magna: Implications for the cost of brooding and the allometry of metabolic rate. Limnol. Oceanogr. 1991, 36, 354–362. [Google Scholar] [CrossRef]
- Simčič, T.; Brancelj, A. Estimation of the proportion of metabolically active mass in the amphipod Gammarus fossarum. Freshw. Biol. 2003, 48, 1093–1099. [Google Scholar] [CrossRef]
- Lease, H.M.; Wolf, B.O. Exoskeletal chitin scales isometrically with body size in terrestrial insects. J. Morphol. 2010, 271, 759–768. [Google Scholar] [CrossRef] [PubMed]
- Schramm, B.W.; Gudowska, A.; Antoł, A.; Labecka, A.M.; Bauchinger, U.; Kozłowski, J.; Czarnoleski, M. Effects of fat and exoskeletal mass on the mass scaling of metabolism in Carabidae beetles. J. Insect Physiol. 2017. [Google Scholar] [CrossRef] [PubMed]
- McNab, B.K.; Eisenberg, J.F. Brain size and its relation to the rate of metabolism in mammals. Am. Nat. 1989, 133, 157–167. [Google Scholar] [CrossRef]
- Isler, K.; van Schaik, C.P. Metabolic costs of brain size evolution. Biol. Lett. 2006, 2, 557–560. [Google Scholar] [CrossRef] [PubMed]
- Finarelli, J.A. Does encephalization correlate with life history or metabolic rate in Carnivora? Biol. Lett. 2010, 6, 350–353. [Google Scholar] [CrossRef] [PubMed]
- Weisbecker, V.; Goswami, A. Brain size, life history, and metabolism at the marsupial/placental dichotomy. Proc. Natl. Acad. Sci. USA 2010, 107, 16216–16221. [Google Scholar] [CrossRef] [PubMed]
- Sobrero, R.; May-Collado, L.J.; Agnarsson, I.; Hernández, C.E. Expensive brains: “brainy” rodents have higher metabolic rate. Front. Evol. Neurosci. 2011, 3, 2. [Google Scholar] [CrossRef] [PubMed]
- McNab, B.K.; Köhler, M. The difficulty with correlations: Energy expenditure and brain mass in bats. Comp. Biochem. Physiol. A Molec. Intergr. Physiol. 2017, 212, 9–14. [Google Scholar] [CrossRef] [PubMed]
- Martin, R.D. Relative brain size and basal metabolic rate in terrestrial vertebrates. Nature 1981, 293, 57–60. [Google Scholar] [CrossRef] [PubMed]
- Martin, R.D. Scaling of the mammalian brain: The maternal energy hypothesis. Physiology 1996, 11, 149–156. [Google Scholar] [CrossRef]
- Barton, R.A.; Capellini, I. Maternal investment, life histories, and the costs of brain growth in mammals. Proc. Natl. Acad. Sci. USA 2011, 108, 6169–6174. [Google Scholar] [CrossRef] [PubMed] [Green Version]
- Halley, A.C. Minimal variation in eutherian brain growth rates during fetal neurogenesis. Proc. R. Soc. B Biol. Sci. 2017, 284, 20170219. [Google Scholar] [CrossRef] [PubMed]
- Brody, S. Bioenergetics and Growth; Hafner: New York, NY, USA, 1945. [Google Scholar]
- Isler, K.; van Schaik, C. Costs of encephalization: The energy trade-off hypothesis tested on birds. J. Hum. Evol. 2006, 51, 228–243. [Google Scholar] [CrossRef] [PubMed]
- Weisbecker, V.; Goswami, A. Reassessing the relationship between brain size, life history, and metabolism at the marsupial/placental dichotomy. Zool. Sci. 2014, 31, 608–612. [Google Scholar] [CrossRef] [PubMed]
- Killen, S.S.; Glazier, D.S.; Rezende, E.L.; Clark, T.D.; Atkinson, D.; Willener, A.S.; Halsey, L.G. Ecological influences and morphological correlates of resting and maximal metabolic rates across teleost fish species. Am. Nat. 2016, 187, 592–606. [Google Scholar] [CrossRef] [PubMed]
- Turschwell, M.P.; White, C.R. The effects of laboratory housing and spatial enrichment on brain size and metabolic rate in the eastern mosquitofish, Gambusia holbrooki. Biol. Open 2016, 5, 205–210. [Google Scholar] [CrossRef] [PubMed]
- Glazier, D.S. Resource supply and demand both affect metabolic scaling. Trends Ecol. Evol. 2018, in press. [Google Scholar]
- Waters, J.S.; Holbrook, C.T.; Fewell, J.H.; Harrison, J.F. Allometric scaling of metabolism, growth, and activity in whole colonies of the seed-harvester ant Pogonomyrmex californicus. Am. Nat. 2010, 176, 501–510. [Google Scholar] [CrossRef] [PubMed]
- Waters, J.S.; Ochs, A.; Fewell, J.H.; Harrison, J.F. Differentiating causality and correlation in allometric scaling: Ant colony size drives metabolic hypometry. Proc. R. Soc. B Biol. Sci. 2017, 284, 20162582. [Google Scholar] [CrossRef] [PubMed]
- Mason, K.S.; Kwapich, C.L.; Tschinkel, W.R. Respiration, worker body size, tempo and activity in whole colonies of ants. Physiol. Entomol. 2015, 40, 149–165. [Google Scholar] [CrossRef]
- Vleck, C.M.; Hoyt, D.F.; Vleck, D. Metabolism of avian embryos: Patterns in altricial and precocial birds. Physiol. Zool. 1979, 52, 363–377. [Google Scholar] [CrossRef]
- Riisgärd, H.U. No foundation of a “3/4 power scaling law” for respiration in biology. Ecol. Lett. 1998, 1, 71–73. [Google Scholar] [CrossRef]
- Czarnołęski, M.; Kozłowski, J.; Dumiot, G.; Bonnet, J.C.; Mallard, J.; Dupont-Nivet, M. Scaling of metabolism in Helix aspersa snails: Changes through ontogeny and response to selection for increased size. J. Exp. Biol. 2008, 211, 391–400. [Google Scholar] [CrossRef] [PubMed]
- Rombough, P. The energetics of embryonic growth. Respir. Physiol. Neurobiol. 2011, 178, 22–29. [Google Scholar] [CrossRef] [PubMed]
- Teissier, G. Recherches Morphologiques et Physiologiques Croissance des Insectes: Thèses Presentees a la Faculte des Sciences de L’Université de Paris pour obtenir le Grade de Docteur ès Sciences Naturelles. Doctoral thesis, Université de Paris, Paris, France, 1931. [Google Scholar]
- Riddle, O.; Nussmann, T.C.; Benedict, F.G. Metabolism during growth in a common pigeon. Am. J. Physiol. 1932, 101, 251–259. [Google Scholar] [CrossRef]
- Kibler, H.H.; Brody, S. Metabolism and growth rate of rats. J. Nutr. 1942, 24, 461–468. [Google Scholar] [CrossRef]
- Atanasov, A. The change of power coefficient in metabolism-mass relationship across life’s taxons during evolution: Prediction for mass-dependent metabolic model. Trakia J. Sci. 2010, 8, 12–24. [Google Scholar]
- Parry, G.D. The influence of the cost of growth on ectotherm metabolism. J. Theor. Biol. 1983, 101, 453–477. [Google Scholar] [CrossRef]
- Trevelyan, R.; Harvey, P.H.; Pagel, M.D. Metabolic rates and life histories in birds. Funct. Ecol. 1990, 4, 135–141. [Google Scholar] [CrossRef]
- Lovegrove, B.G. Age at first reproduction and growth rate are independent of basal metabolic rate in mammals. J. Comp. Physiol. B 2009, 179, 391–401. [Google Scholar] [CrossRef] [PubMed]
- Montes, L.; le Roy, N.; Perret, M.; de Buffrenil, V.; Castanet, J.; Cubo, J. Relationships between bone growth rate, body mass and resting metabolic rate in growing amniotes: A phylogenetic approach. Biol. J. Linn. Soc. 2007, 92, 63–76. [Google Scholar] [CrossRef]
- Jimenez, A.G.; Van Brocklyn, J.; Wortman, M.; Williams, J.B. Cellular metabolic rate is influenced by life-history traits in tropical and temperate birds. PLoS ONE 2014, 9, e87349. [Google Scholar] [CrossRef] [PubMed]
- Cooper-Mullin, C.; Jimenez, A.G.; Anthony, N.B.; Wortman, M.; Williams, J.B. The metabolic rate of cultured muscle cells from hybrid Coturnix quail is intermediate to that of muscle cells from fast-growing and slow-growing Coturnix quail. J. Comp. Physiol. B 2015, 185, 547–557. [Google Scholar] [CrossRef] [PubMed]
- Ton, R.; Martin, T.E. Metabolism correlates with variation in post-natal growth rate among songbirds at three latitudes. Funct. Ecol. 2016, 30, 743–748. [Google Scholar] [CrossRef]
- Kempes, C.P.; Dutkiewicz, S.; Follows, M.J. Growth, metabolic partitioning, and the size of microorganisms. Proc Natl. Acad. Sci. USA 2012, 109, 495–500. [Google Scholar] [CrossRef] [PubMed]
- Demetrius, L.; Tuszynski, J.A. Quantum metabolism explains the allometric scaling of metabolic rates. J. R. Soc. Interface 2010, 7, 507–514. [Google Scholar] [CrossRef] [PubMed]
- Okie, J.G.; Smith, V.H.; Martin-Cereceda, M. Major evolutionary transitions of life, metabolic scaling and the number and size of mitochondria and chloroplasts. Proc. R. Soc. B Biol. Sci. 2016, 283, 20160611. [Google Scholar] [CrossRef] [PubMed]
- Miettinen, T.P.; Björklund, M. Mitochondrial function and cell size: An allometric relationship. Trends Cell Biol. 2017, 27, 393–402. [Google Scholar] [CrossRef] [PubMed]
- Aryaman, J.; Hoitzing, H.; Burgstaller, J.P.; Johnston, I.G.; Jones, N.S. Mitochondrial heterogeneity, metabolic scaling and cell death. BioEssays 2017, 39, 1700001. [Google Scholar] [CrossRef] [PubMed]
- Rolfe, D.F.; Brown, G.C. Cellular energy utilization and molecular origin of standard metabolic rate in mammals. Physiol. Rev. 1997, 77, 731–758. [Google Scholar] [CrossRef] [PubMed]
- Newell, R.C.; Pye, V.I. Variations in the relationship between oxygen consumption, body size and summated tissue metabolism in the winkle Littorina littorea. J. Mar. Biol. Assoc. UK 1971, 51, 315–338. [Google Scholar] [CrossRef]
- Valencak, T.G.; Ruf, T. N-3 polyunsaturated fatty acids impair lifespan but have no role for metabolism. Aging Cell 2007, 6, 15–25. [Google Scholar] [CrossRef] [PubMed]
- Polymeropoulos, E.T.; Heldmaier, G.; Frappell, P.B.; McAllan, B.M.; Withers, K.W.; Klingenspor, M.; White, C.R.; Jastroch, M. Phylogenetic differences of mammalian basal metabolic rate are not explained by mitochondrial basal proton leak. Proc. R. Soc. Lond. B 2012, 279, 185–193. [Google Scholar] [CrossRef] [PubMed]
- Gonzalez, A.; Pagé, B.; Weber, J.M. Membranes as a possible pacemaker of metabolism in cypriniform fish: Does phylogeny matter? J. Exp. Biol. 2015, 218, 2563–2572. [Google Scholar] [CrossRef] [PubMed]
- Sukhotin, A.; Fokina, N.; Ruokolainen, T.; Bock, C.; Pörtner, H.O.; Lannig, G. Does the membrane pacemaker theory of metabolism explain the size dependence of metabolic rate in marine mussels? J. Exp. Biol. 2017, 220, 1423–1434. [Google Scholar] [CrossRef] [PubMed]
- O’Connor, M.P.; Kemp, S.J.; Agosta, S.J.; Hansen, F.; Sieg, A.E.; Wallace, B.P.; McNair, J.N.; Dunham, A.E. Reconsidering the mechanistic basis of the metabolic theory of ecology. Oikos 2007, 116, 1058–1072. [Google Scholar] [CrossRef]
- Makarieva, A.M.; Gorshkov, V.G.; Li, B.-L. Revising the distributive network models of West, Brown & Enquist (1997) and Banavar, Maritan & Rinaldo (1999). Metabolic inequity of living tissues provides clues for the observed allometric scaling rules. J. Theor. Biol. 2005, 237, 291–307. [Google Scholar] [CrossRef] [PubMed]
- Oikawa, S.; Itazawa, Y. Relationship between summated tissue respiration and body size in a marine teleost, the porgy Pagrus major. Fish. Sci. 2003, 69, 687–694. [Google Scholar] [CrossRef]
- Ultsch, G.R. Respiratory surface area as a factor controlling the standard rate of O2 consumption of aquatic salamanders. Resp. Physiol. 1976, 26, 357–369. [Google Scholar] [CrossRef]
- Whitford, W.G.; Hutchison, V.H. Body size and metabolic rate in salamanders. Physiol. Zool. 1967, 40, 127–133. [Google Scholar] [CrossRef]
- Feder, M.E. Oxygen consumption and activity in salamanders: Effect of body size and lunglessness. J. Exp. Zool. 1977, 202, 403–414. [Google Scholar] [CrossRef]
- Berg, K.; Ockelmann, K.W. The respiration of freshwater snails. J. Exp. Biol. 1959, 36, 690–708. [Google Scholar]
- Anderson, J.F. Metabolic rates of spiders. Comp. Biochem. Physiol. 1970, 33, 51–72. [Google Scholar] [CrossRef]
- Ultsch, G.R. A theoretical and experimental investigation of the relationship between metabolic rate, body size, and oxygen exchange capacity. Resp. Physiol. 1973, 18, 143–160. [Google Scholar] [CrossRef]
- Ultsch, G.R. Gas exchange and metabolism in the Sirenidae (Amphibia: Caudata)—I. Oxygen consumption of submerged sirenids as a function of body size and respiratory surface area. Comp. Biochem. Physiol. A Physiol. 1974, 47, 485–498. [Google Scholar] [CrossRef]
- White, C.R.; Seymour, R.S. Energetics: Physiological functions that scale to body mass in fish. In Encyclopedia of Fish Physiology: From Genome to Environment; Farrell, A.P., Ed.; Elsevier: Amsterdam, The Netherlands, 2011; pp. 1573–1582. [Google Scholar]
- Mirth, C.K.; Frankino, W.A.; Shingleton, A.W. Allometry and size control: What can studies of body size regulation teach us about the evolution of morphological scaling relationships? Curr. Opin. Insect Sci. 2016, 13, 93–98. [Google Scholar] [CrossRef] [PubMed]
- Verberk, W.C.; Atkinson, D. Why polar gigantism and Palaeozoic gigantism are not equivalent: Effects of oxygen and temperature on the body size of ectotherms. Funct. Ecol. 2013, 27, 1275–1285. [Google Scholar] [CrossRef] [Green Version]
- Swanson, D.L.; McKechnie, A.E.; Vézina, F. How low can you go? An adaptive energetic framework for interpreting basal metabolic rate variation in endotherms. J. Comp. Physiol. B 2017, 187, 1039–1056. [Google Scholar] [CrossRef] [PubMed]
- Kooijman, S.A.L.M.; Baas, J.; Bontje, D.; Broerse, M.; Jager, T.; Van Gestel, C.A.M.; Van Hattum, B. Scaling relationships based on partition coefficients and body sizes have similarities and interactions. SAR QSAR Environ. Res. 2007, 18, 315–330. [Google Scholar] [CrossRef] [PubMed]
- Krogh, A. The Respiratory Exchange of Animals and Man; Longmans, Green: London, UK, 1916. [Google Scholar]
- White, C.R. Physiology: There is no single p. Nature 2010, 464, 691–692. [Google Scholar] [CrossRef] [PubMed]
- Phillipson, J. Bioenergetic Options and Phylogeny. In Physiological Ecology: An Evolutionary Approach to Resource Use; Townsend, C.R., Calow, P., Eds.; Sinauer Associates: Sunderland, MA, USA, 1981; pp. 20–45. [Google Scholar]
- Withers, P.C. Comparative Animal Physiology; Saunders: Fort Worth, TX, USA, 1992. [Google Scholar]
- Patterson, M.R. A mass transfer explanation of metabolic scaling relationships in some aquatic invertebrates and algae. Science 1992, 255, 1421–1423. [Google Scholar] [CrossRef] [PubMed]
- Bokma, F. Evidence against universal metabolic allometry. Funct. Ecol. 2004, 18, 184–187. [Google Scholar] [CrossRef]
- Burgess, S.C.; Ryan, W.H.; Blackstone, N.W.; Edmunds, P.J.; Hoogenboom, M.O.; Levitan, D.R.; Wulff, J.L. Metabolic scaling in modular animals. Invertebr. Biol. 2017, 136, 456–472. [Google Scholar] [CrossRef]
- The Blind Men and the Elephant. Available online: http://library.timelesstruths.org/texts/ Treasures_of_the_ Kingdom_41/The_Blind_Men_and_the_Elephant/ (accessed on 26 January 2018).
Figure 1.
Schematic representation of the four modal theories included in the contextual multimodal theory (CMT) of metabolic scaling. Reproduced with permission from [20].
Figure 1.
Schematic representation of the four modal theories included in the contextual multimodal theory (CMT) of metabolic scaling. Reproduced with permission from [20].

Figure 2.
Schematic representation of theoretical models of metabolic scaling that embrace various binary combinations of four possible modal mechanisms or theories included in the contextual multimodal theory (CMT) of metabolic scaling [20]. SA = surface-area theory; RT = resource-transport theory; SC = system-composition theory; RD = resource-demand theory. (A) [27,80,122,130], (B) [148], (C) [19,39,46,56], (D) [176,245]. (E) [86], (F) [25,89,106,167,246].

Figure 3.
Schematic representation of the modal mechanisms used by Dynamic Energy Budget (DEB) theory to explain metabolic scaling [85,156]. Hypometric interspecific metabolic scaling (log-log slope < 1) is explained by surface area (SA) effects on resource supply from storage pools (or in endotherms by heat dissipation effects) and system composition (SC) effects involving disproportionate increases in metabolically inert storage materials with increasing body size. Intraspecific metabolic scaling results from ontogenetic changes in the resource demand (RD) of growth. DEB theory emphasizes SC and RD mechanisms, as indicated by larger code letters and thicker circular lines.

Figure 4.
Schematic representation of the modal mechanisms used by the metabolic-level boundaries hypothesis (MLBH) to explain metabolic scaling both within and among species [19,46,56]. The relative influence of the component mechanisms depends on metabolic level. At high levels of resting metabolism, surface-area (SA) or resource-transport (RT) related effects on resource supply and waste (including heat) loss cause the metabolic scaling exponent to approach 2/3 or 3/4 in isomorphic organisms. However, at low levels of resting metabolism or high levels of active metabolism, volume-related tissue maintenance or muscular power production (RD effects) causes the exponent to approach 1 (assuming no heterogeneous scaling of tissue metabolic rates). If RT effects occur, they are restricted to organisms with closed circulatory systems (e.g., vertebrate animals). The MLBH emphasizes SA and RD mechanisms, as indicated by larger code letters and thicker circular lines.

Figure 5.
Schematic representation of Harrison’s demand-side model of metabolic scaling [106] within the framework of the CMT [20]. Thick arrows and outlined circles denote Harrison’s emphasis on the adaptive evolution of two modal mechanisms affecting resource demand. This model posits that the two modal mechanisms affecting resource supply evolve in response to changes in resource demand. SA = surface-area theory; RT = resource-transport theory; SC = system-composition theory; RD = resource-demand theory.

Figure 6.
Schematic representation of the relative importance of four modal mechanisms, and their interactions within the framework of the CMT [20] (cf. Figure 1). Thick arrows and outlined circles denote the modal mechanisms and their interactions that are most supported by current evidence, according to [20]. This model posits that metabolic scaling may evolve in relation to changes, not only in both resource supply and demand, but also in surface-area related loss of wastes (including heat). Source [20] provides further details about how metabolic scaling may respond to co-adjusted changes in both resource supply and demand, and to various physiological, developmental and ecological factors, both functionally and evolutionarily. SA = surface-area theory; RT = resource-transport theory; SC = system-composition theory; RD = resource-demand theory.

Figure 7.
Metabolic scaling represented by an elephant with many different complex parts. Through history, scientists (like blind men) have focused on specific aspects of metabolic scaling (shown in part as the four modal mechanisms of the CMT [20]) and argued for their pre-eminent importance, but in the process failed to see the whole elephant and the environment in which it lives. One must inspect all parts of the ‘elephant’ and its ecological interactions to understand metabolic scaling fully. Based on John G. Saxe’s poem (picture of elephant and blind men, and the last lines of the poem from [266]).

© 2018 by the author. Licensee MDPI, Basel, Switzerland. This article is an open access article distributed under the terms and conditions of the Creative Commons Attribution (CC BY) license (http://creativecommons.org/licenses/by/4.0/).
Share and Cite
MDPI and ACS Style
Glazier, D.S. Rediscovering and Reviving Old Observations and Explanations of Metabolic Scaling in Living Systems. Systems 2018, 6, 4. https://doi.org/10.3390/systems6010004
AMA Style
Glazier DS. Rediscovering and Reviving Old Observations and Explanations of Metabolic Scaling in Living Systems. Systems. 2018; 6(1):4. https://doi.org/10.3390/systems6010004
Chicago/Turabian StyleGlazier, Douglas S. 2018. "Rediscovering and Reviving Old Observations and Explanations of Metabolic Scaling in Living Systems" Systems 6, no. 1: 4. https://doi.org/10.3390/systems6010004
Note that from the first issue of 2016, this journal uses article numbers instead of page numbers. See further details here.